| Param | Original file | Final file |
|---|---|---|
| Filename | modeM0/AS1C05_002T09_9000003566_24119cztM0_level2.evt | modeM0/AS1C05_002T09_9000003566_24119cztM0_level2_quad_clean.evt |
| Size (bytes) | 384,001,920 | 73,753,920 |
| Size | 366.2 MB | 70.3 MB |
| Events in quadrant A | 2,256,741 | 483,145 |
| Events in quadrant B | 2,302,219 | 485,075 |
| Events in quadrant C | 2,293,507 | 468,347 |
| Events in quadrant D | 4,437,698 | 447,095 |
| Mode M0 | |||
|---|---|---|---|
| Quadrant | BADHDUFLAG | Total packets | Discarded packets |
| A | 0 | 10011 | 0 |
| B | 0 | 10074 | 0 |
| C | 0 | 10007 | 0 |
| D | 0 | 16570 | 0 |
| Mode SS | |||
|---|---|---|---|
| Quadrant | BADHDUFLAG | Total packets | Discarded packets |
| A | 0 | 100 | 0 |
| B | 0 | 100 | 0 |
| C | 0 | 100 | 0 |
| D | 0 | 100 | 0 |
| Quadrant | Total seconds | Saturated seconds | Saturation percentage |
|---|---|---|---|
| A | 4984 | 2 | 0.040128% |
| B | 4984 | 2 | 0.040128% |
| C | 4984 | 26 | 0.521669% |
| D | 4984 | 544 | 10.914928% |
Noise dominated data is calculated using 1-second bins in cleaned event files. If a bin has >2000 counts, and if more than 50% of those come from <1% of pixels, then it is considered to be noise-dominated and hence unusable.
| Quadrant | # 1 sec bins | Bins with >0 counts | Bins with >2000 counts | High rate bins dominated by noise | Noise dominated (total time) | Noise dominated (detector-on time) | Marked lightcurve |
|---|---|---|---|---|---|---|---|
| A | 4984 | 4984 | 0 | 0 | 0.00% | 0.00% | 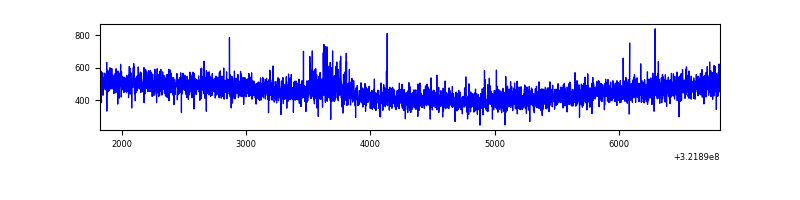 |
| B | 4984 | 4984 | 1 | 1 | 0.02% | 0.02% | 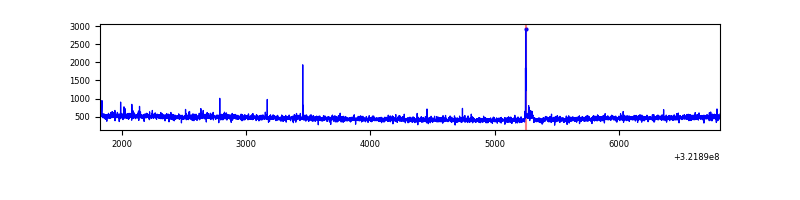 |
| C | 4984 | 4984 | 0 | 0 | 0.00% | 0.00% | 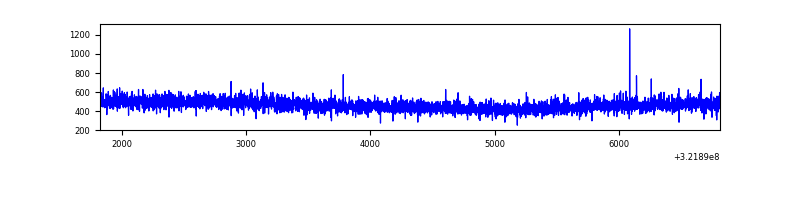 |
| D | 4984 | 4984 | 540 | 540 | 10.83% | 10.83% | 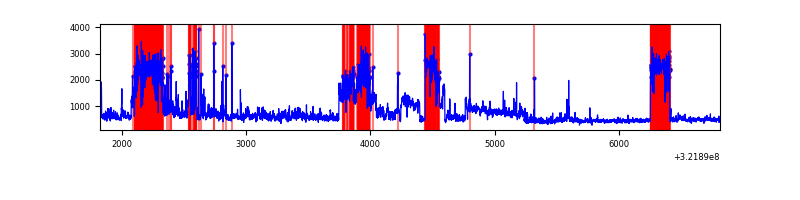 |
Top three noisy pixels from each quadrant. If the there are fewer than three noisy pixels in the level2.evt file, extra rows are filled as -1
| Pixel properties | Quadrant properties | ||||||
|---|---|---|---|---|---|---|---|
| Quadrant | DetID | PixID | Counts | Sigma | Mean | Median | Sigma |
| A | 4 | 2 | 19933 | 165.54 | 579 | 566 | 117.0 |
| A | 13 | 254 | 7238 | 57.03 | 579 | 566 | 117.0 |
| A | 3 | 137 | 5154 | 39.21 | 579 | 566 | 117.0 |
| B | 10 | 247 | 15324 | 132.54 | 576 | 562 | 111.4 |
| B | 12 | 111 | 13494 | 116.11 | 576 | 562 | 111.4 |
| B | 11 | 111 | 11671 | 99.74 | 576 | 562 | 111.4 |
| C | 14 | 238 | 89621 | 682.37 | 556 | 559 | 130.5 |
| C | 7 | 247 | 29596 | 222.47 | 556 | 559 | 130.5 |
| C | 3 | 233 | 4511 | 30.28 | 556 | 559 | 130.5 |
| D | 7 | 238 | 683365 | 5132.78 | 541 | 524 | 133.0 |
| D | 1 | 52 | 649754 | 4880.13 | 541 | 524 | 133.0 |
| D | 8 | 195 | 392585 | 2947.04 | 541 | 524 | 133.0 |
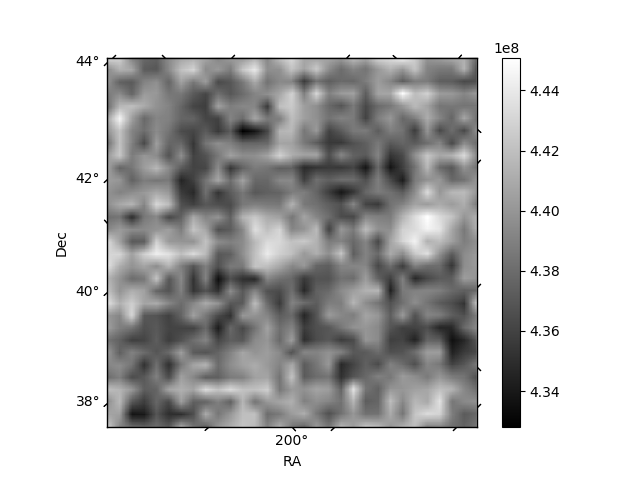
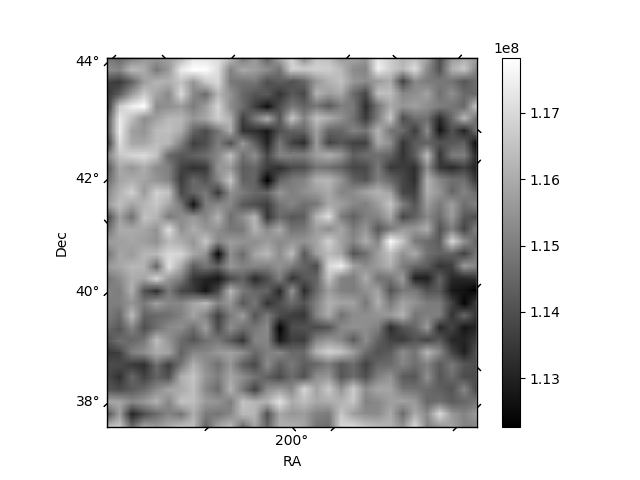
Histogram calculated using DETX and DETY for each event in the final _common_clean file
| Quadrant A | 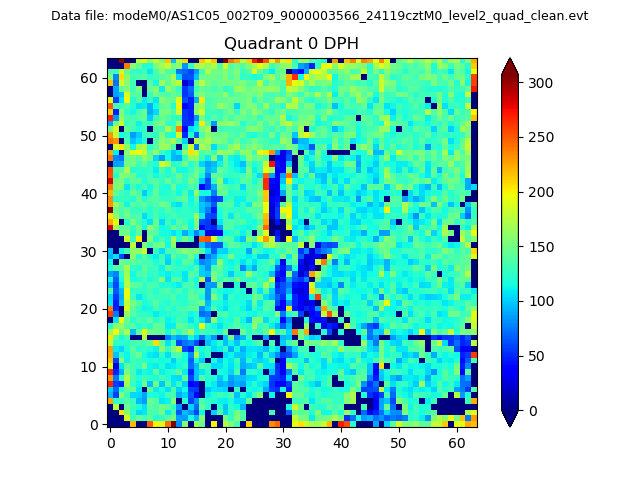 |
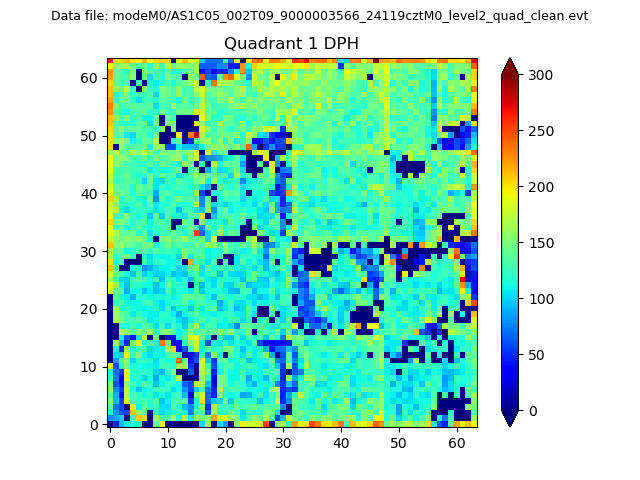 |
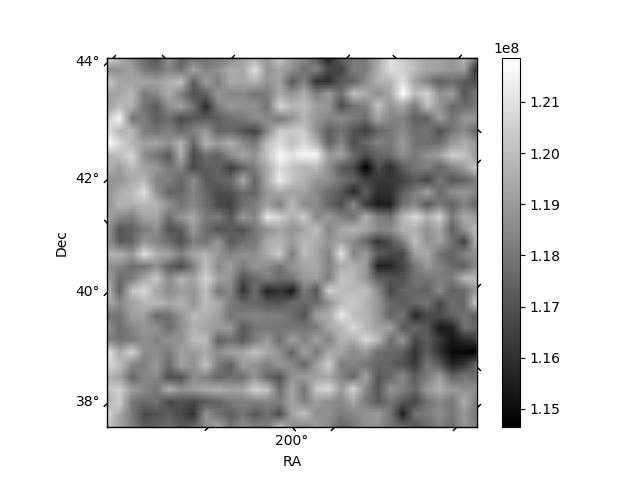
Quadrant B |
|---|---|---|---|
| Quadrant D | 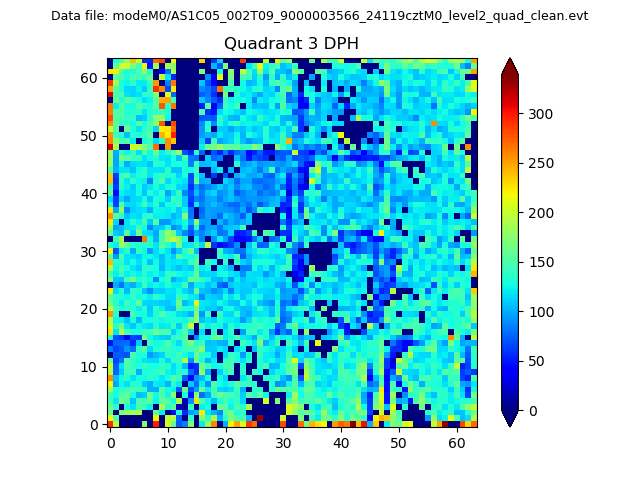 |
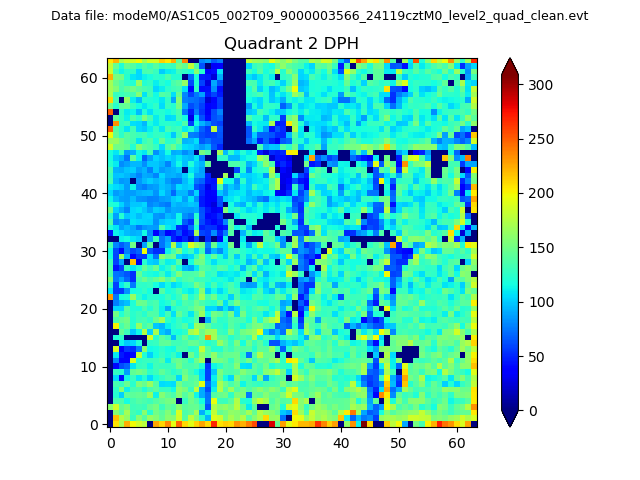 |
Quadrant C |
| Plot type | Count rate plots | Images |
|---|---|---|
| Comparison with Poisson distribution Blue bars denote a histogram of data divided into 1 sec bins. Red curve is a Poisson curve with rate = median count rate of data. |
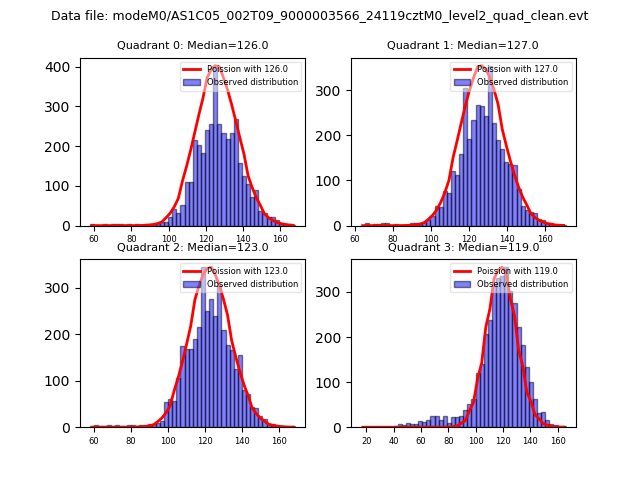 |
 |
| Quadrant-wise count rates Data is divided into 100 sec bins |
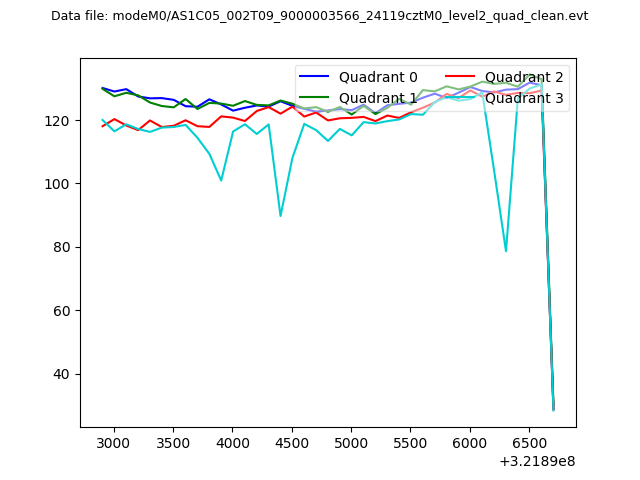 |
|
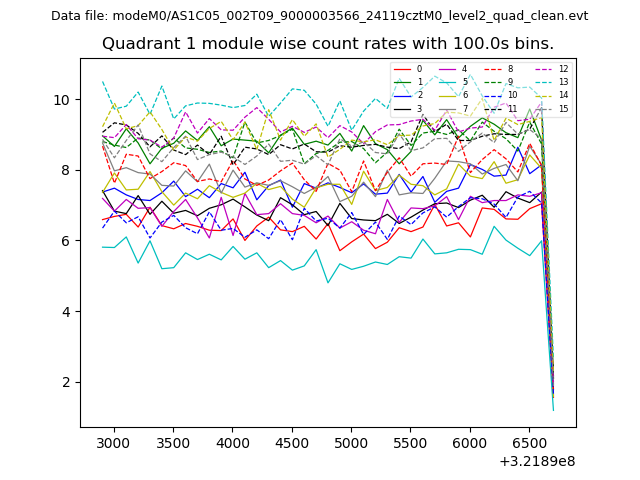
| Module-wise count rates for Quadrant A Data is divided into 100 sec bins |
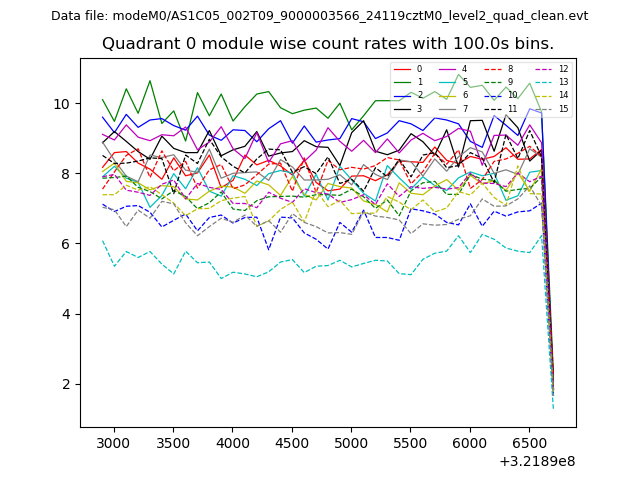 |
 |
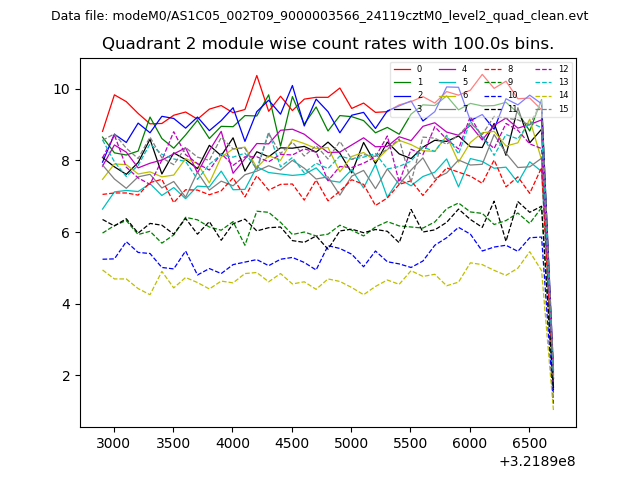
| Module-wise count rates for Quadrant B Data is divided into 100 sec bins |
 |
 |
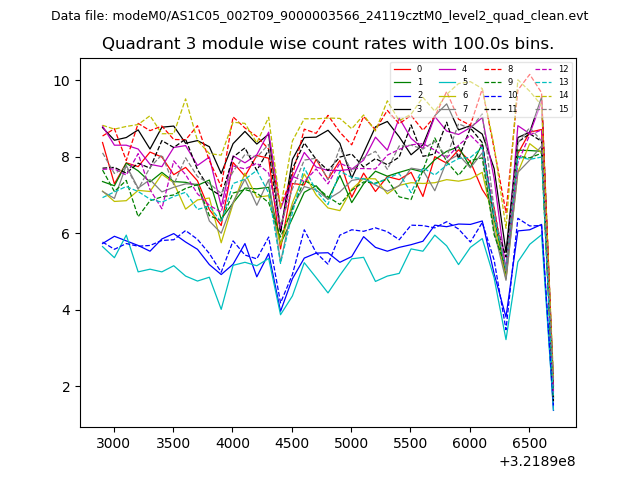
| Module-wise count rates for Quadrant C Data is divided into 100 sec bins |
 |
 |
| Module-wise count rates for Quadrant D Data is divided into 100 sec bins |
 |
 |
| Parameter | Plot |
|---|---|
| CZT HV Monitor | 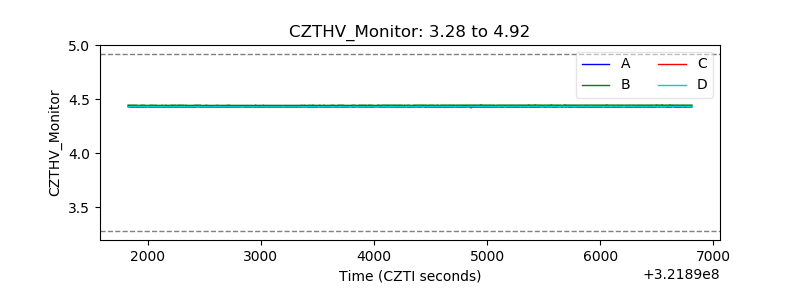 |
| D_VDD | 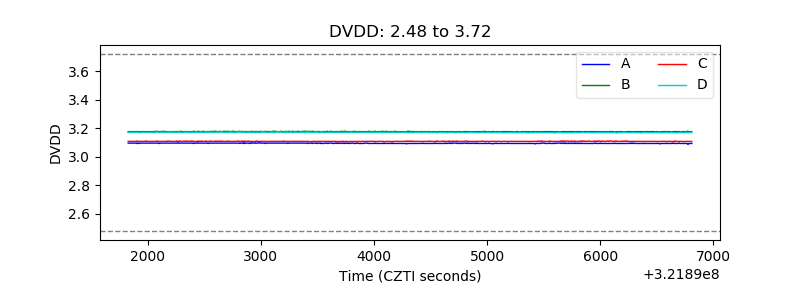 |
| Temperature 1 | 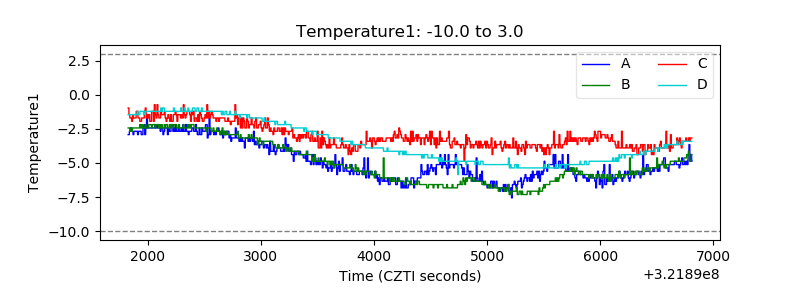 |
| Veto HV Monitor | 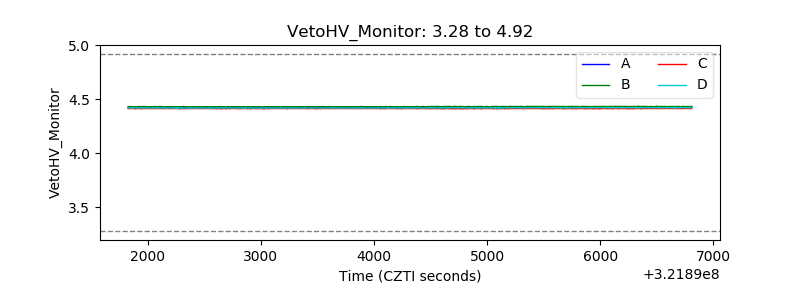 |
| Veto LLD | 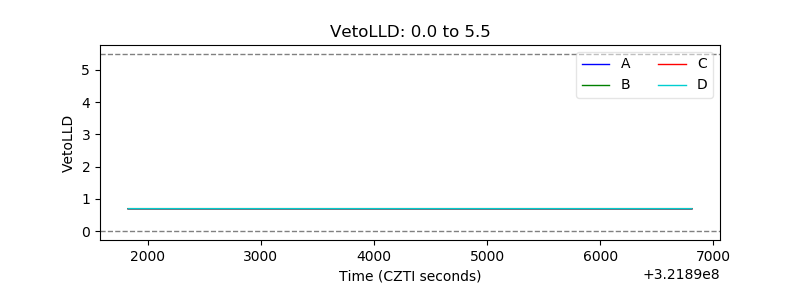 |
| Alpha Counter |  |
| _CPM_Rate | 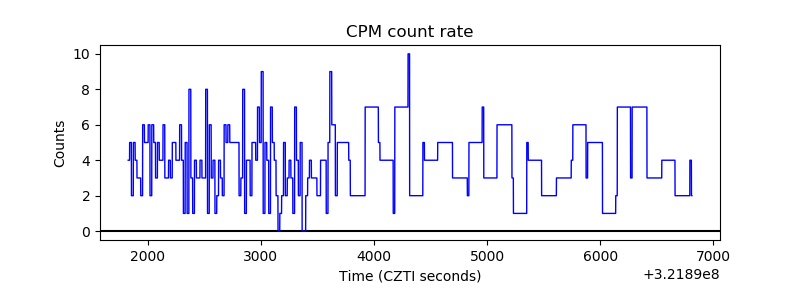 |
| CZT Counter | 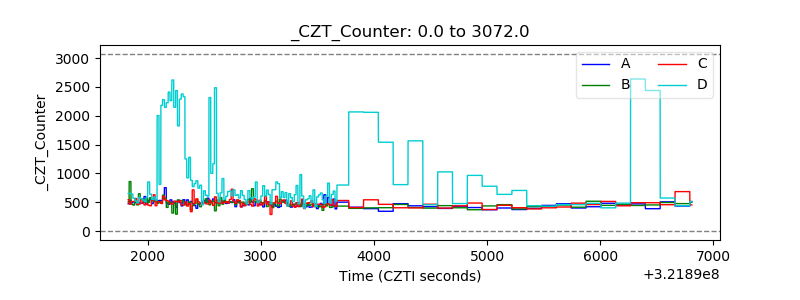 |
| +2.5 Volts monitor |  |
| +5 Volts monitor |  |
| _ROLL_ROT | 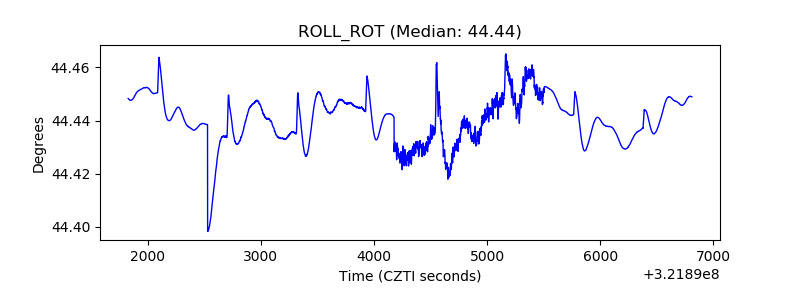 |
| _Roll_DEC | 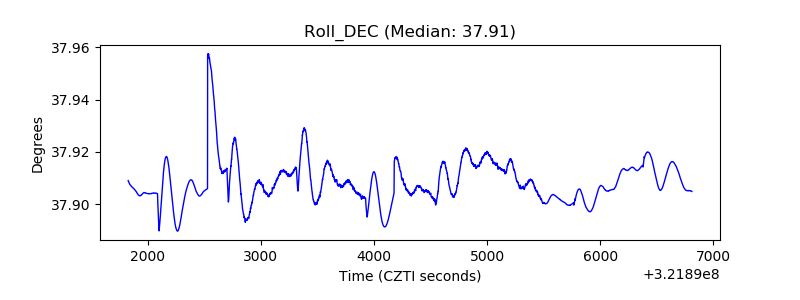 |
| _Roll_RA | 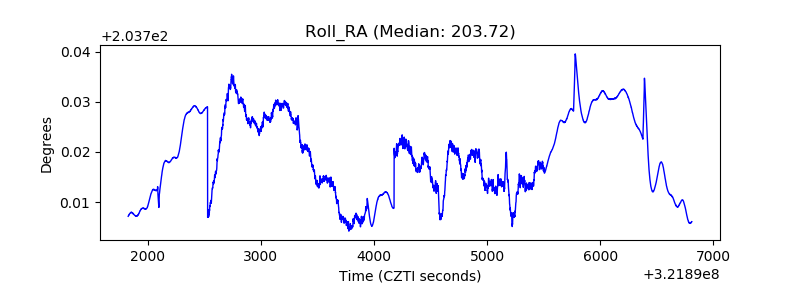 |
| Veto Counter | 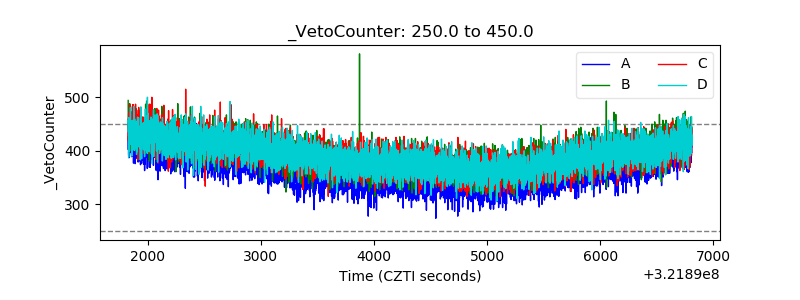 |