| Param | Original file | Final file |
|---|---|---|
| Filename | modeM0/AS1A07_047T01_9000003572cztM0_level2.fits | modeM0/AS1A07_047T01_9000003572cztM0_level2_quad_clean.evt |
| Size (bytes) | 149,261,760 | 192,502,080 |
| Size | 142.3 MB | 183.6 MB |
| Events in quadrant A | 935,680 | 1,271,232 |
| Events in quadrant B | 889,170 | 1,253,901 |
| Events in quadrant C | 876,322 | 1,172,932 |
| Events in quadrant D | 784,528 | 1,096,867 |
| Mode SS | |||
|---|---|---|---|
| Quadrant | BADHDUFLAG | Total packets | Discarded packets |
| A | 0 | 306 | 0 |
| B | 0 | 306 | 0 |
| C | 0 | 306 | 0 |
| D | 0 | 306 | 0 |
| Mode M9 | |||
|---|---|---|---|
| Quadrant | BADHDUFLAG | Total packets | Discarded packets |
| A | 0 | 27 | 0 |
| B | 0 | 27 | 0 |
| C | 0 | 27 | 0 |
| D | 0 | 27 | 0 |
| Mode M0 | |||
|---|---|---|---|
| Quadrant | BADHDUFLAG | Total packets | Discarded packets |
| A | 0 | 31012 | 0 |
| B | 0 | 31462 | 0 |
| C | 0 | 32341 | 0 |
| D | 0 | 35718 | 0 |
| Quadrant | Total seconds | Saturated seconds | Saturation percentage |
|---|---|---|---|
| A | 14996 | 198 | 1.320352% |
| B | 14996 | 207 | 1.380368% |
| C | 14996 | 390 | 2.600694% |
| D | 14996 | 369 | 2.460656% |
Noise dominated data is calculated using 1-second bins in cleaned event files. If a bin has >2000 counts, and if more than 50% of those come from <1% of pixels, then it is considered to be noise-dominated and hence unusable.
| Quadrant | # 1 sec bins | Bins with >0 counts | Bins with >2000 counts | High rate bins dominated by noise | Noise dominated (total time) | Noise dominated (detector-on time) | Marked lightcurve |
|---|---|---|---|---|---|---|---|
| A | 17691 | 14995 | 0 | 0 | 0.00% | 0.00% |  |
| B | 17691 | 14995 | 0 | 0 | 0.00% | 0.00% |  |
| C | 17691 | 14989 | 0 | 0 | 0.00% | 0.00% |  |
| D | 17691 | 14996 | 0 | 0 | 0.00% | 0.00% |  |
Top three noisy pixels from each quadrant. If the there are fewer than three noisy pixels in the level2.evt file, extra rows are filled as -1
| Pixel properties | Quadrant properties | ||||||
|---|---|---|---|---|---|---|---|
| Quadrant | DetID | PixID | Counts | Sigma | Mean | Median | Sigma |
| A | 0 | 29 | 909 | 11.16 | 243 | 232 | 60.6 |
| A | 7 | 110 | 756 | 8.64 | 243 | 232 | 60.6 |
| A | 0 | 30 | 704 | 7.78 | 243 | 232 | 60.6 |
| B | 2 | 9 | 723 | 10.33 | 235 | 226 | 48.1 |
| B | 2 | 8 | 618 | 8.14 | 235 | 226 | 48.1 |
| B | 5 | 255 | 588 | 7.52 | 235 | 226 | 48.1 |
| C | 9 | 188 | 625 | 6.76 | 231 | 218 | 60.2 |
| C | 12 | 241 | 611 | 6.52 | 231 | 218 | 60.2 |
| C | 12 | 249 | 610 | 6.51 | 231 | 218 | 60.2 |
| D | 4 | 160 | 584 | 6.2 | 223 | 203 | 61.4 |
| D | 6 | 67 | 557 | 5.76 | 223 | 203 | 61.4 |
| D | 10 | 189 | 555 | 5.73 | 223 | 203 | 61.4 |
Histogram calculated using DETX and DETY for each event in the final _common_clean file
| Quadrant A |  |
 |
Quadrant B |
|---|---|---|---|
| Quadrant D |  |
 |
Quadrant C |
| Plot type | Count rate plots | Images |
|---|---|---|
| Comparison with Poisson distribution Blue bars denote a histogram of data divided into 1 sec bins. Red curve is a Poisson curve with rate = median count rate of data. |
 |
 |
| Quadrant-wise count rates Data is divided into 100 sec bins |
 |
|
| Module-wise count rates for Quadrant A Data is divided into 100 sec bins |
 |
 |
| Module-wise count rates for Quadrant B Data is divided into 100 sec bins |
 |
 |
| Module-wise count rates for Quadrant C Data is divided into 100 sec bins |
 |
 |
| Module-wise count rates for Quadrant D Data is divided into 100 sec bins |
 |
 |
| Parameter | Plot |
|---|---|
| CZT HV Monitor |  |
| D_VDD |  |
| Temperature 1 |  |
| Veto HV Monitor |  |
| Veto LLD |  |
| Alpha Counter |  |
| _CPM_Rate |  |
| CZT Counter |  |
| +2.5 Volts monitor |  |
| +5 Volts monitor |  |
| _ROLL_ROT |  |
| _Roll_DEC |  |
| _Roll_RA | 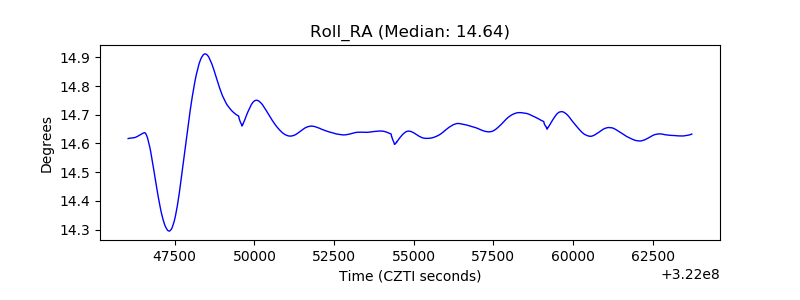 |
| Veto Counter |  |