| Param | Original file | Final file |
|---|---|---|
| Filename | modeM0/AS1A07_047T01_9000003572_24145cztM0_level2.evt | modeM0/AS1A07_047T01_9000003572_24145cztM0_level2_quad_clean.evt |
| Size (bytes) | 213,750,720 | 62,490,240 |
| Size | 203.8 MB | 59.6 MB |
| Events in quadrant A | 1,503,751 | 436,880 |
| Events in quadrant B | 1,513,386 | 442,382 |
| Events in quadrant C | 1,505,449 | 406,895 |
| Events in quadrant D | 1,754,843 | 402,188 |
| Mode SS | |||
|---|---|---|---|
| Quadrant | BADHDUFLAG | Total packets | Discarded packets |
| A | 0 | 58 | 0 |
| B | 0 | 58 | 0 |
| C | 0 | 58 | 0 |
| D | 0 | 58 | 0 |
| Mode M9 | |||
|---|---|---|---|
| Quadrant | BADHDUFLAG | Total packets | Discarded packets |
| A | 0 | 13 | 0 |
| B | 0 | 13 | 0 |
| C | 0 | 13 | 0 |
| D | 0 | 13 | 0 |
| Mode M0 | |||
|---|---|---|---|
| Quadrant | BADHDUFLAG | Total packets | Discarded packets |
| A | 0 | 6123 | 1 |
| B | 0 | 6138 | 1 |
| C | 0 | 6168 | 1 |
| D | 0 | 6986 | 1 |
| Quadrant | Total seconds | Saturated seconds | Saturation percentage |
|---|---|---|---|
| A | 2861 | 61 | 2.132122% |
| B | 2861 | 45 | 1.572877% |
| C | 2861 | 87 | 3.040895% |
| D | 2861 | 65 | 2.271933% |
Noise dominated data is calculated using 1-second bins in cleaned event files. If a bin has >2000 counts, and if more than 50% of those come from <1% of pixels, then it is considered to be noise-dominated and hence unusable.
| Quadrant | # 1 sec bins | Bins with >0 counts | Bins with >2000 counts | High rate bins dominated by noise | Noise dominated (total time) | Noise dominated (detector-on time) | Marked lightcurve |
|---|---|---|---|---|---|---|---|
| A | 4096 | 2862 | 0 | 0 | 0.00% | 0.00% | 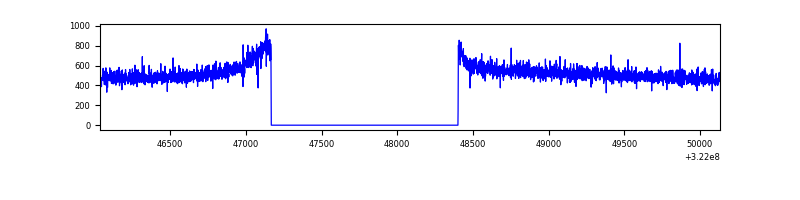 |
| B | 4096 | 2862 | 0 | 0 | 0.00% | 0.00% | 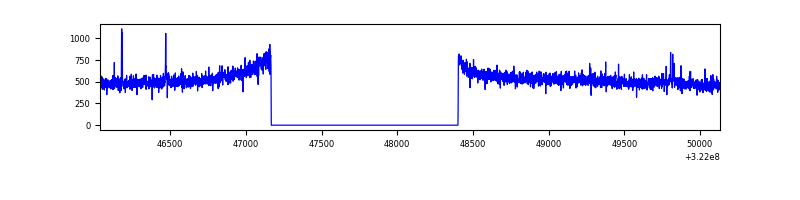 |
| C | 4096 | 2862 | 0 | 0 | 0.00% | 0.00% | 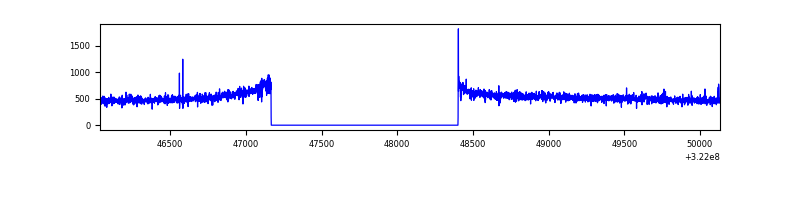 |
| D | 4096 | 2862 | 5 | 5 | 0.12% | 0.17% | 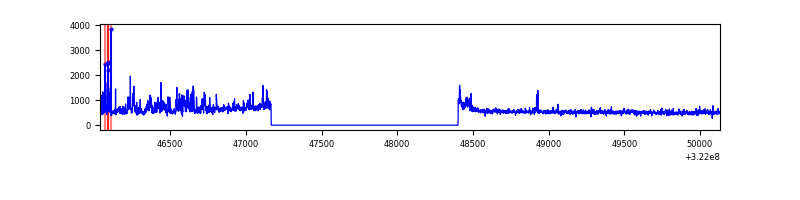 |
Top three noisy pixels from each quadrant. If the there are fewer than three noisy pixels in the level2.evt file, extra rows are filled as -1
| Pixel properties | Quadrant properties | ||||||
|---|---|---|---|---|---|---|---|
| Quadrant | DetID | PixID | Counts | Sigma | Mean | Median | Sigma |
| A | 13 | 254 | 4940 | 58.13 | 389 | 381 | 78.4 |
| A | 0 | 226 | 3365 | 38.05 | 389 | 381 | 78.4 |
| A | 3 | 137 | 3163 | 35.47 | 389 | 381 | 78.4 |
| B | 12 | 111 | 8316 | 108.3 | 384 | 375 | 73.3 |
| B | 0 | 190 | 7526 | 97.52 | 384 | 375 | 73.3 |
| B | 11 | 111 | 7418 | 96.05 | 384 | 375 | 73.3 |
| C | 14 | 238 | 59296 | 690.14 | 366 | 366 | 85.4 |
| C | 7 | 247 | 6155 | 67.8 | 366 | 366 | 85.4 |
| C | 3 | 233 | 5397 | 58.92 | 366 | 366 | 85.4 |
| D | 7 | 238 | 122973 | 1341.72 | 376 | 363 | 91.4 |
| D | 8 | 195 | 109512 | 1194.41 | 376 | 363 | 91.4 |
| D | 1 | 52 | 91154 | 993.52 | 376 | 363 | 91.4 |
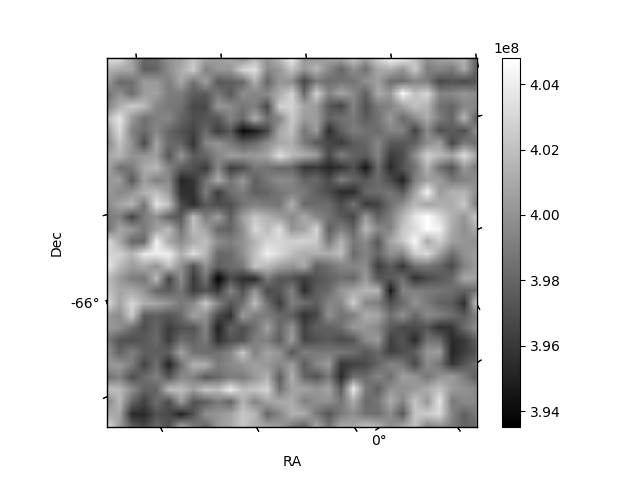
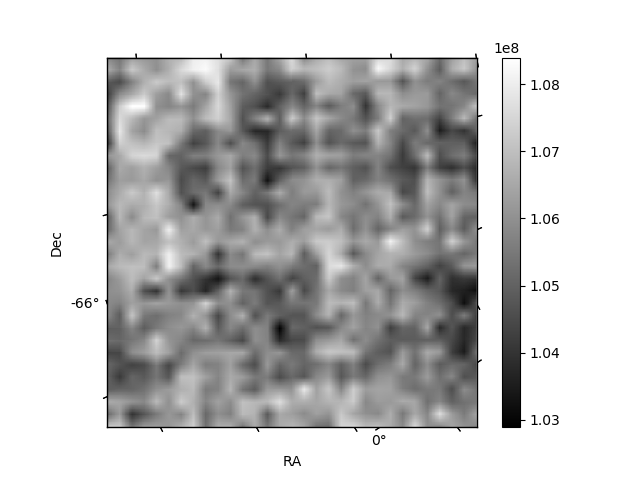
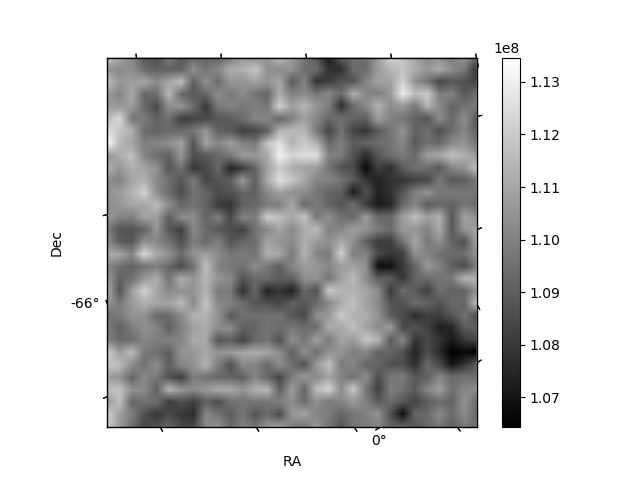
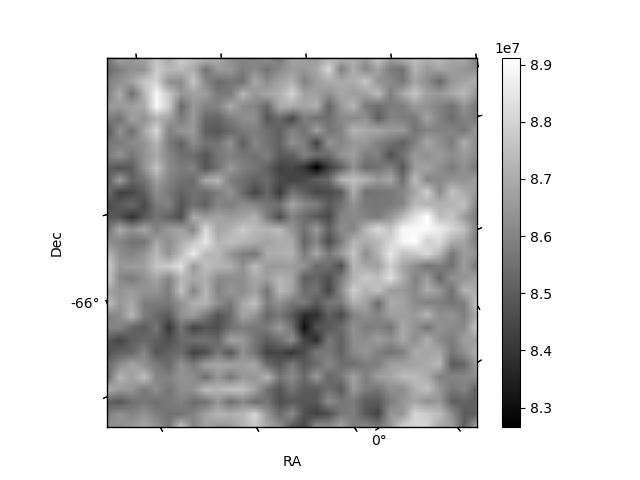
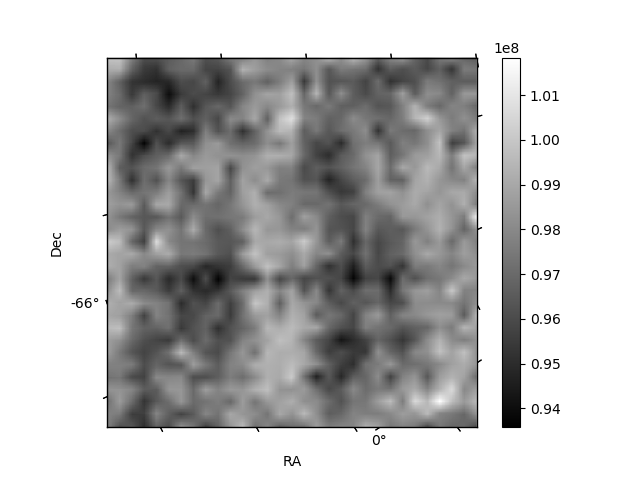
Histogram calculated using DETX and DETY for each event in the final _common_clean file
| Quadrant A | 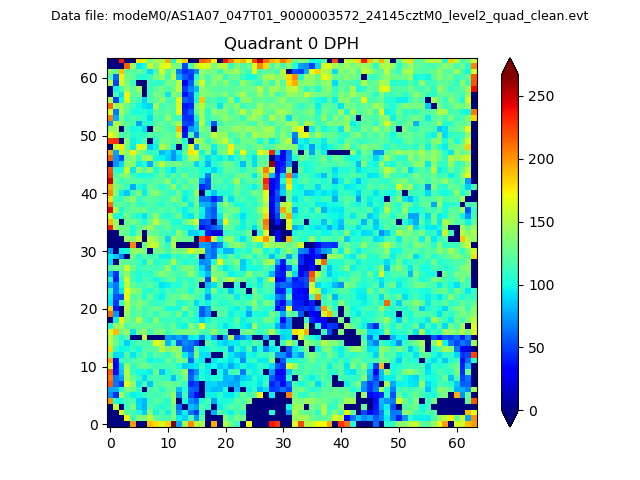 |
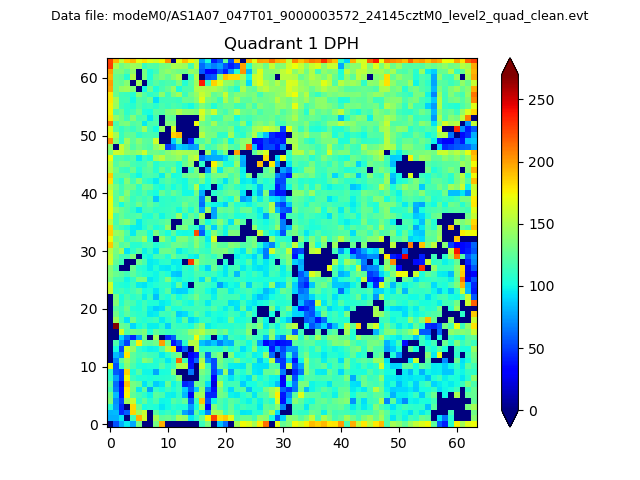 |
Quadrant B |
|---|---|---|---|
| Quadrant D | 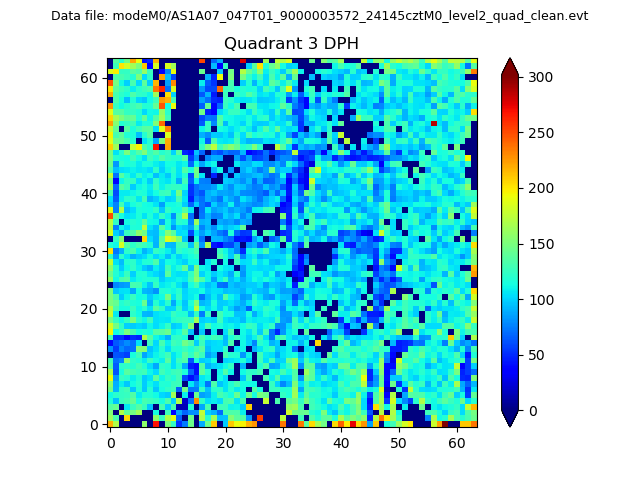 |
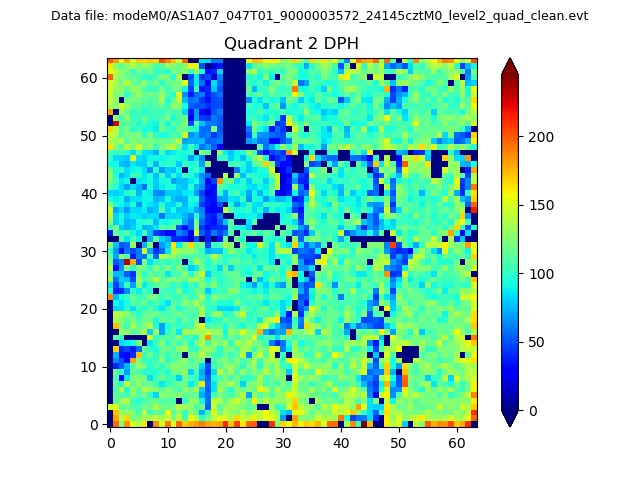 |
Quadrant C |
| Plot type | Count rate plots | Images |
|---|---|---|
| Comparison with Poisson distribution Blue bars denote a histogram of data divided into 1 sec bins. Red curve is a Poisson curve with rate = median count rate of data. |
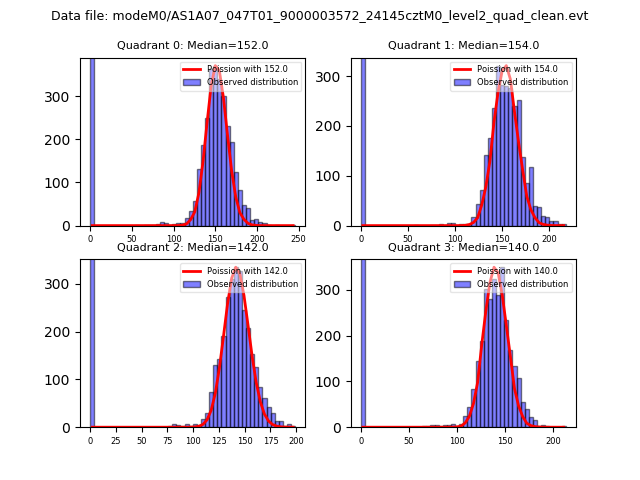 |
 |
| Quadrant-wise count rates Data is divided into 100 sec bins |
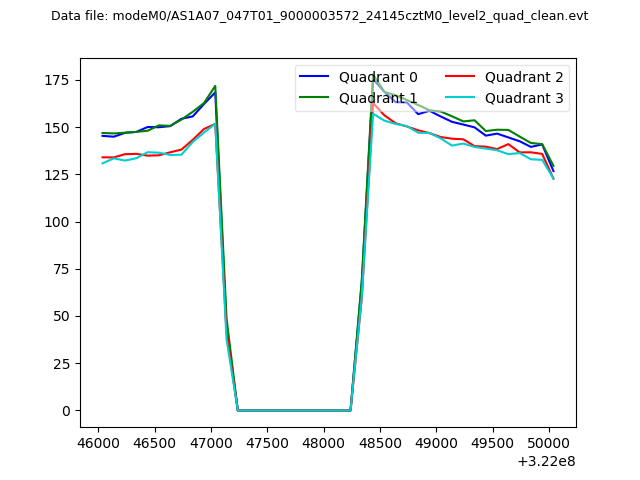 |
|
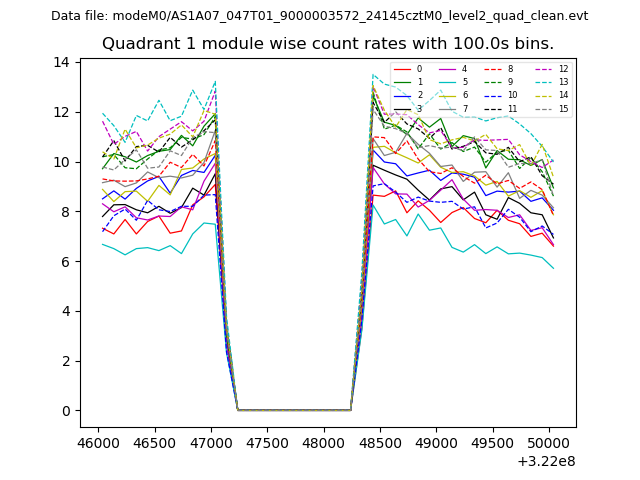
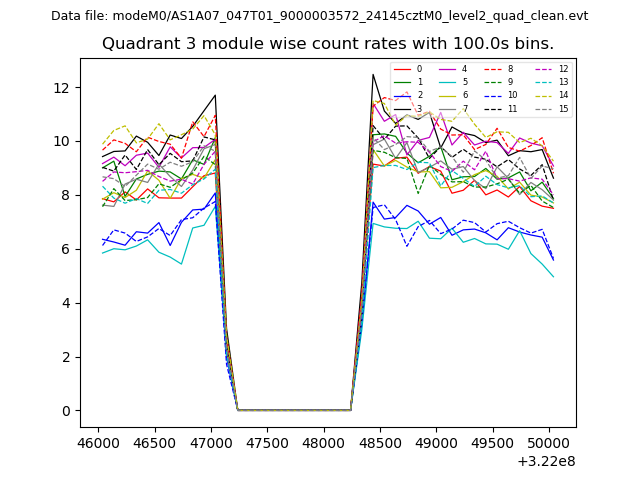
| Module-wise count rates for Quadrant A Data is divided into 100 sec bins |
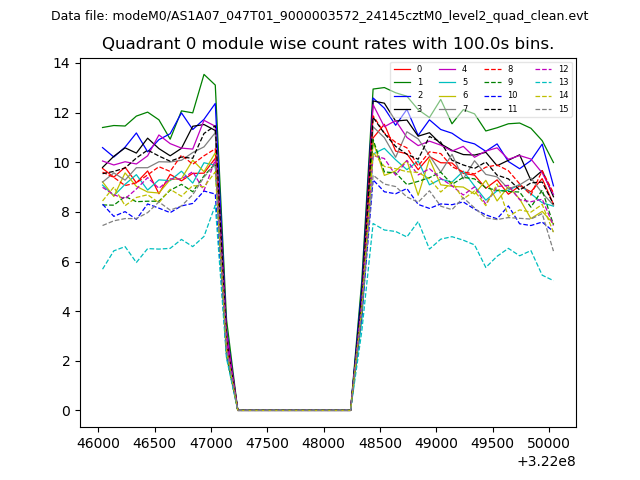 |
 |
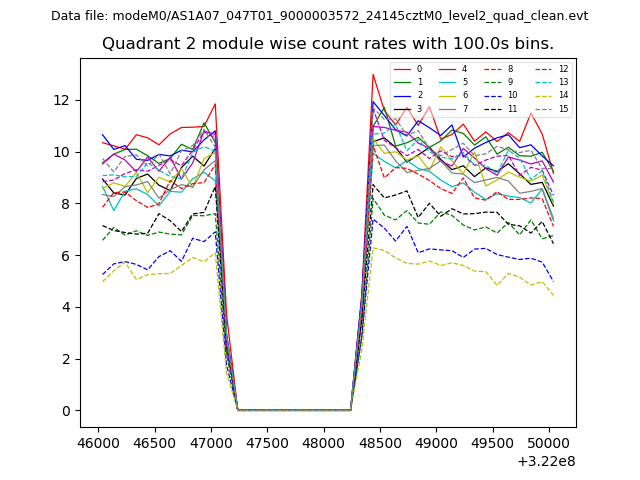
| Module-wise count rates for Quadrant B Data is divided into 100 sec bins |
 |
 |
| Module-wise count rates for Quadrant C Data is divided into 100 sec bins |
 |
 |
| Module-wise count rates for Quadrant D Data is divided into 100 sec bins |
 |
 |
| Parameter | Plot |
|---|---|
| CZT HV Monitor | 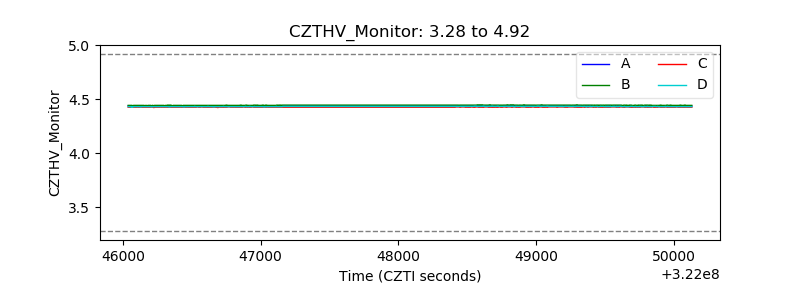 |
| D_VDD | 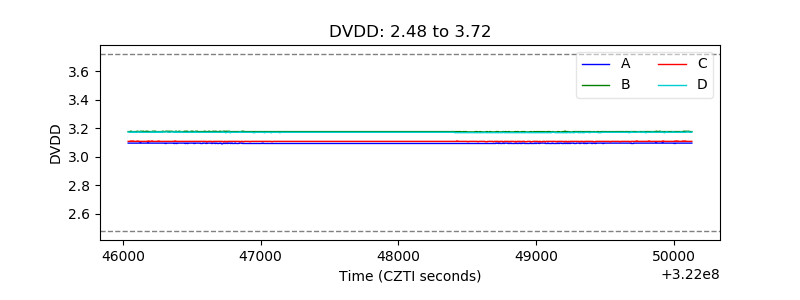 |
| Temperature 1 | 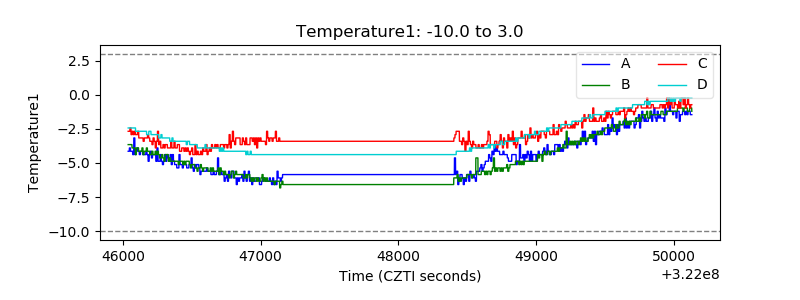 |
| Veto HV Monitor |  |
| Veto LLD | 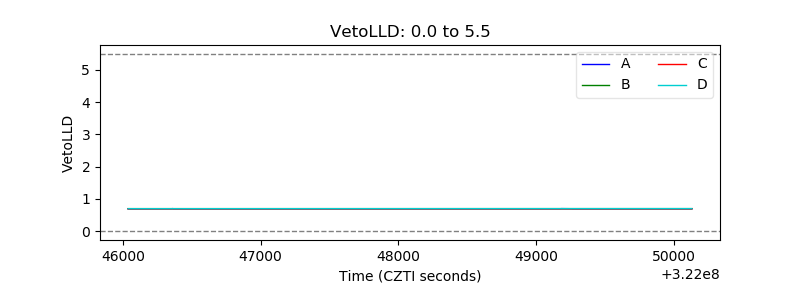 |
| Alpha Counter | 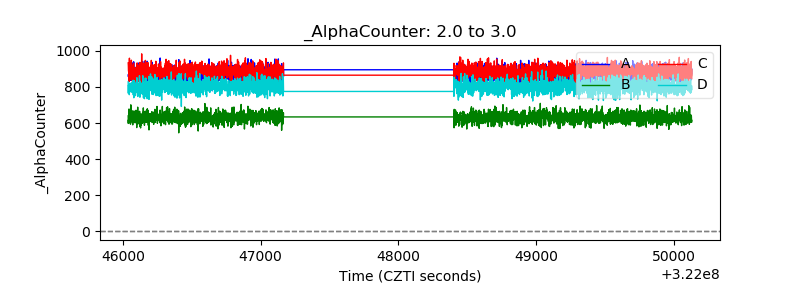 |
| _CPM_Rate |  |
| CZT Counter | 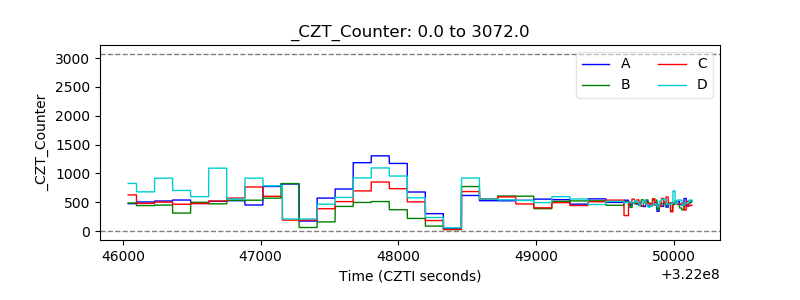 |
| +2.5 Volts monitor | 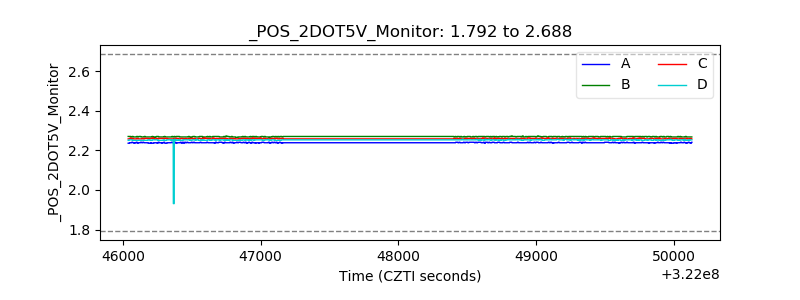 |
| +5 Volts monitor | 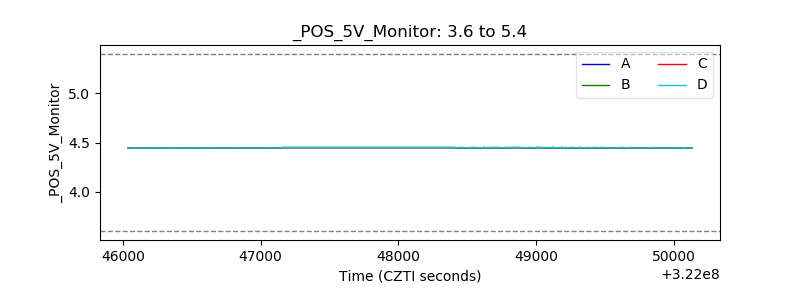 |
| _ROLL_ROT | 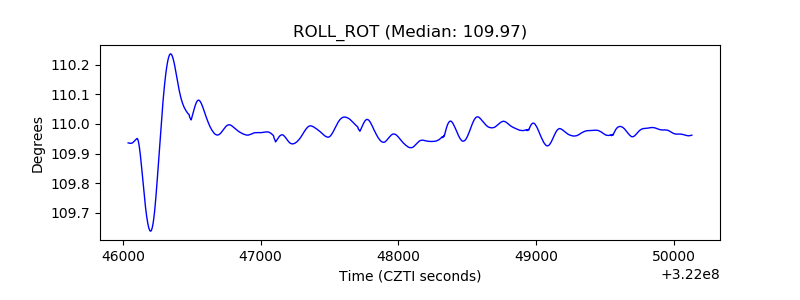 |
| _Roll_DEC |  |
| _Roll_RA | 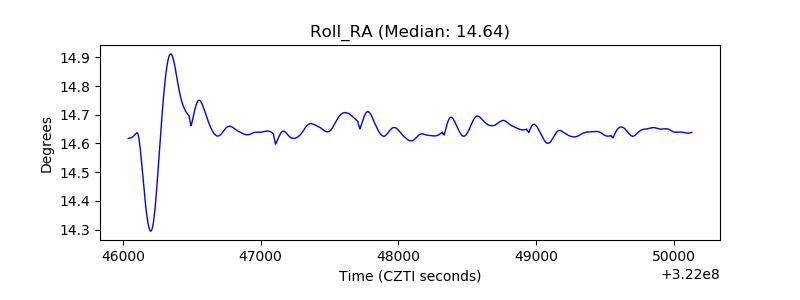 |
| Veto Counter | 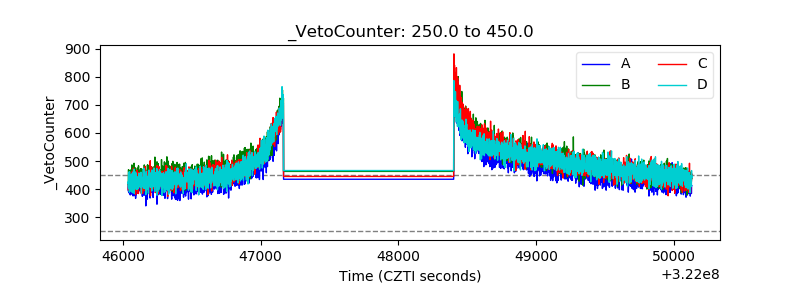 |