| Param | Original file | Final file |
|---|---|---|
| Filename | modeM0/AS1A07_047T01_9000003572_24146cztM0_level2.evt | modeM0/AS1A07_047T01_9000003572_24146cztM0_level2_quad_clean.evt |
| Size (bytes) | 485,228,160 | 136,771,200 |
| Size | 462.7 MB | 130.4 MB |
| Events in quadrant A | 3,263,256 | 948,745 |
| Events in quadrant B | 3,373,267 | 954,876 |
| Events in quadrant C | 3,530,077 | 887,933 |
| Events in quadrant D | 4,072,394 | 882,825 |
| Mode SS | |||
|---|---|---|---|
| Quadrant | BADHDUFLAG | Total packets | Discarded packets |
| A | 0 | 136 | 0 |
| B | 0 | 136 | 0 |
| C | 0 | 136 | 0 |
| D | 0 | 136 | 0 |
| Mode M9 | |||
|---|---|---|---|
| Quadrant | BADHDUFLAG | Total packets | Discarded packets |
| A | 0 | 9 | 0 |
| B | 0 | 9 | 0 |
| C | 0 | 9 | 0 |
| D | 0 | 9 | 0 |
| Mode M0 | |||
|---|---|---|---|
| Quadrant | BADHDUFLAG | Total packets | Discarded packets |
| A | 0 | 13793 | 1 |
| B | 0 | 14019 | 1 |
| C | 0 | 14639 | 1 |
| D | 0 | 16377 | 1 |
| Quadrant | Total seconds | Saturated seconds | Saturation percentage |
|---|---|---|---|
| A | 6718 | 77 | 1.146174% |
| B | 6718 | 63 | 0.937779% |
| C | 6718 | 173 | 2.575171% |
| D | 6718 | 148 | 2.203037% |
Noise dominated data is calculated using 1-second bins in cleaned event files. If a bin has >2000 counts, and if more than 50% of those come from <1% of pixels, then it is considered to be noise-dominated and hence unusable.
| Quadrant | # 1 sec bins | Bins with >0 counts | Bins with >2000 counts | High rate bins dominated by noise | Noise dominated (total time) | Noise dominated (detector-on time) | Marked lightcurve |
|---|---|---|---|---|---|---|---|
| A | 7643 | 6718 | 0 | 0 | 0.00% | 0.00% | 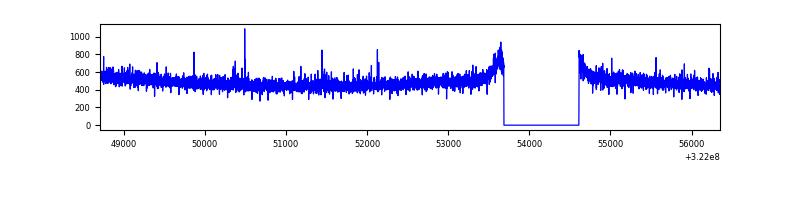 |
| B | 7643 | 6718 | 3 | 3 | 0.04% | 0.04% | 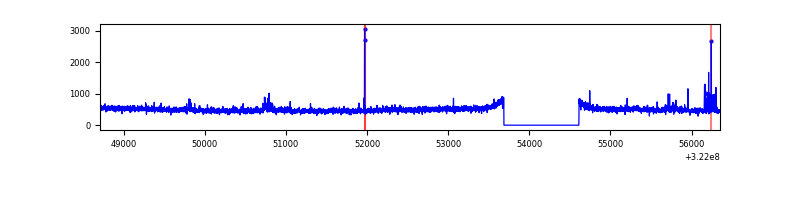 |
| C | 7643 | 6718 | 78 | 78 | 1.02% | 1.16% | 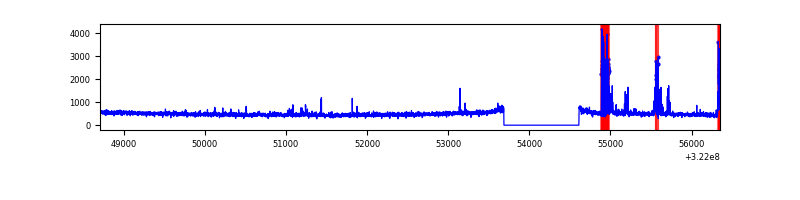 |
| D | 7643 | 6719 | 71 | 71 | 0.93% | 1.06% | 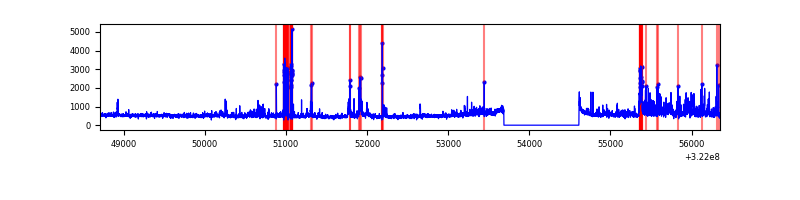 |
Top three noisy pixels from each quadrant. If the there are fewer than three noisy pixels in the level2.evt file, extra rows are filled as -1
| Pixel properties | Quadrant properties | ||||||
|---|---|---|---|---|---|---|---|
| Quadrant | DetID | PixID | Counts | Sigma | Mean | Median | Sigma |
| A | 13 | 254 | 10763 | 59.23 | 844 | 827 | 167.8 |
| A | 0 | 226 | 7284 | 38.49 | 844 | 827 | 167.8 |
| A | 3 | 137 | 6952 | 36.51 | 844 | 827 | 167.8 |
| B | 0 | 189 | 104595 | 674.72 | 828 | 810 | 153.8 |
| B | 12 | 111 | 17775 | 110.29 | 828 | 810 | 153.8 |
| B | 11 | 111 | 16179 | 99.92 | 828 | 810 | 153.8 |
| C | 2 | 16 | 240144 | 1329.97 | 784 | 788 | 180.0 |
| C | 14 | 238 | 127728 | 705.33 | 784 | 788 | 180.0 |
| C | 0 | 207 | 47879 | 261.66 | 784 | 788 | 180.0 |
| D | 8 | 195 | 373299 | 1898.22 | 810 | 786 | 196.2 |
| D | 7 | 238 | 344104 | 1749.45 | 810 | 786 | 196.2 |
| D | 1 | 52 | 258010 | 1310.74 | 810 | 786 | 196.2 |
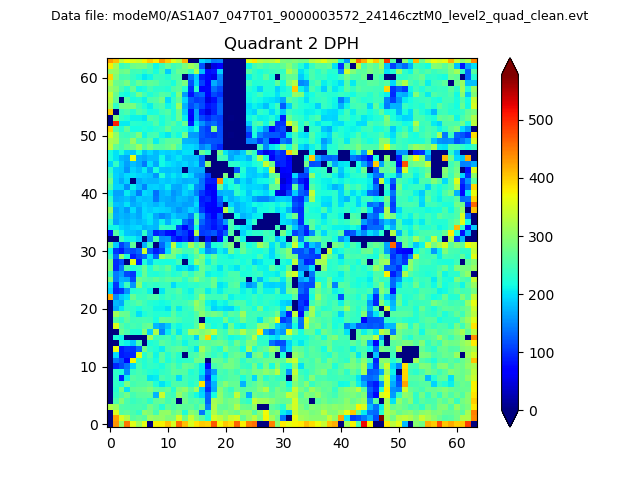
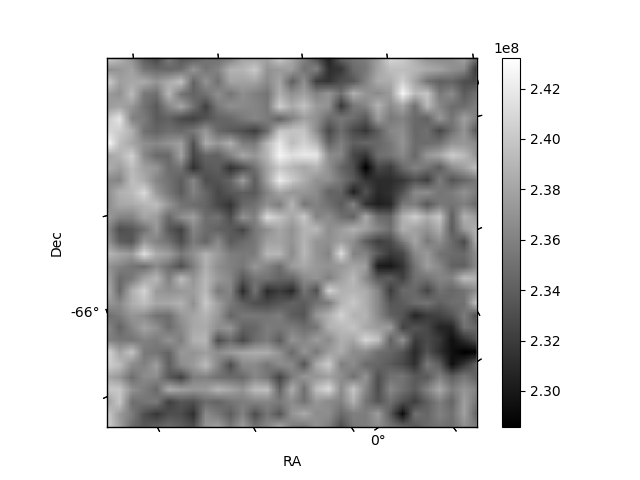
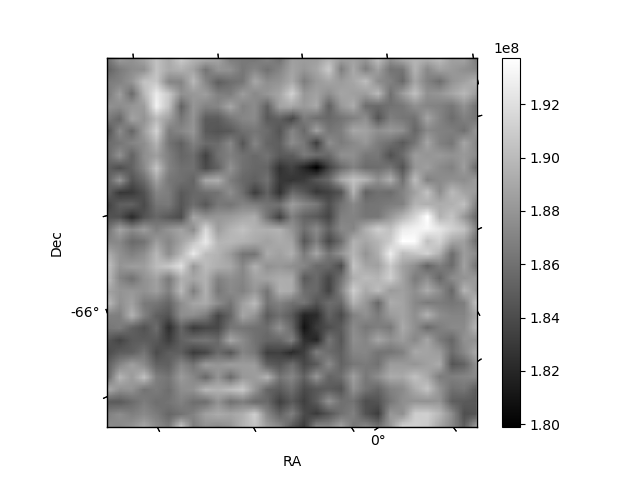
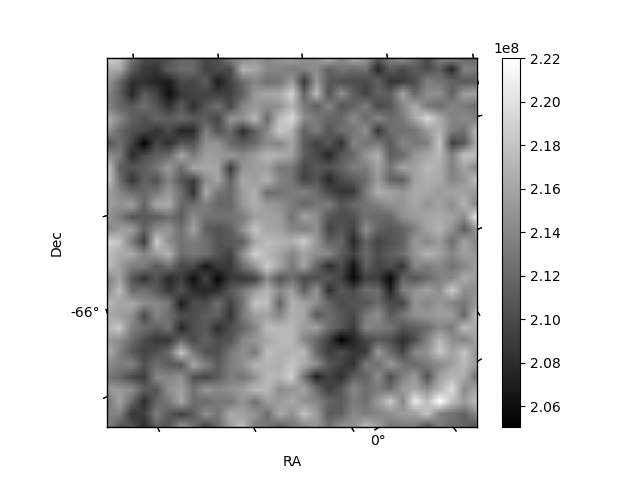
Histogram calculated using DETX and DETY for each event in the final _common_clean file
| Quadrant A | 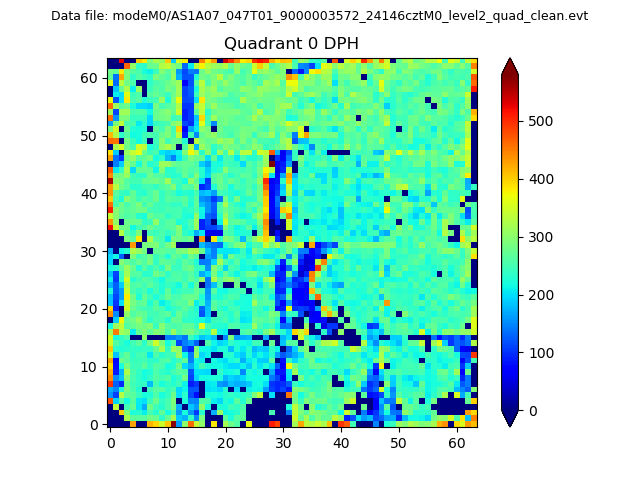 |
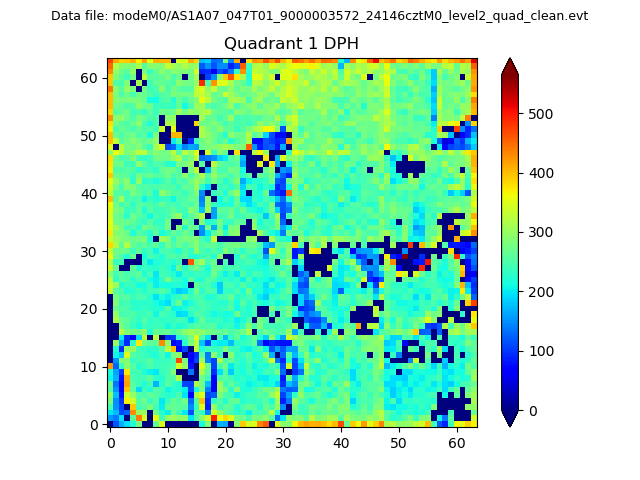 |
Quadrant B |
|---|---|---|---|
| Quadrant D | 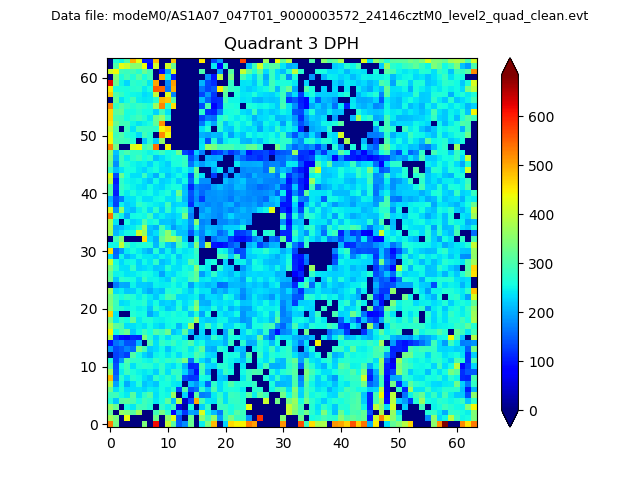 |
 |
Quadrant C |
| Plot type | Count rate plots | Images |
|---|---|---|
| Comparison with Poisson distribution Blue bars denote a histogram of data divided into 1 sec bins. Red curve is a Poisson curve with rate = median count rate of data. |
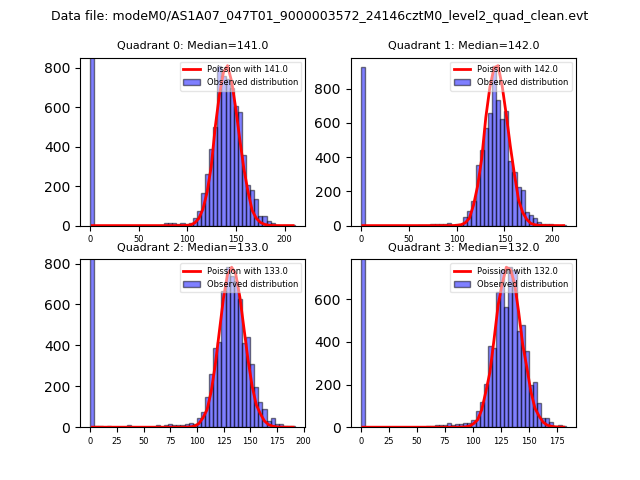 |
 |
| Quadrant-wise count rates Data is divided into 100 sec bins |
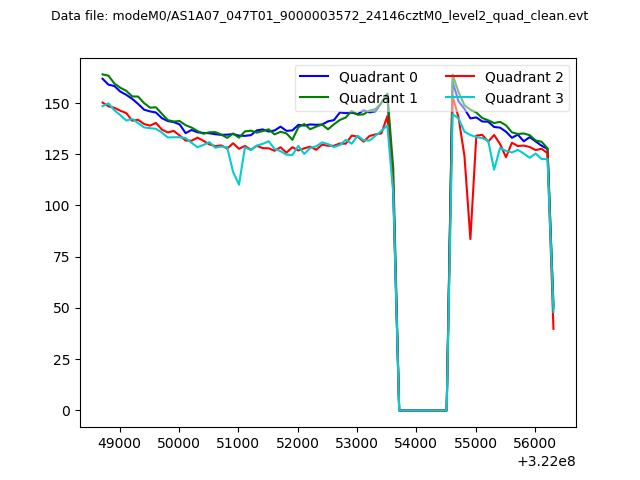 |
|
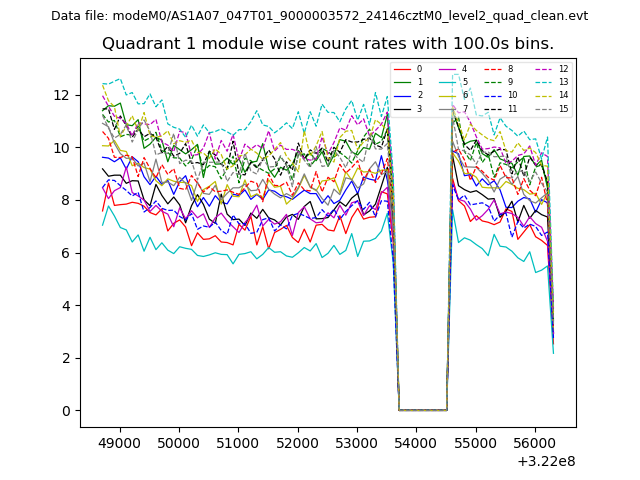
| Module-wise count rates for Quadrant A Data is divided into 100 sec bins |
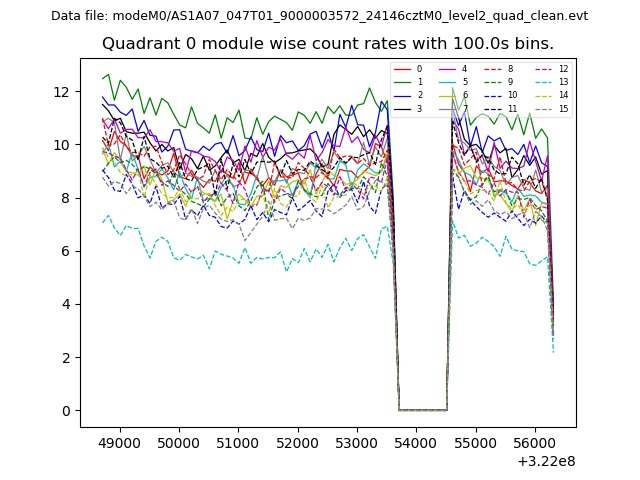 |
 |
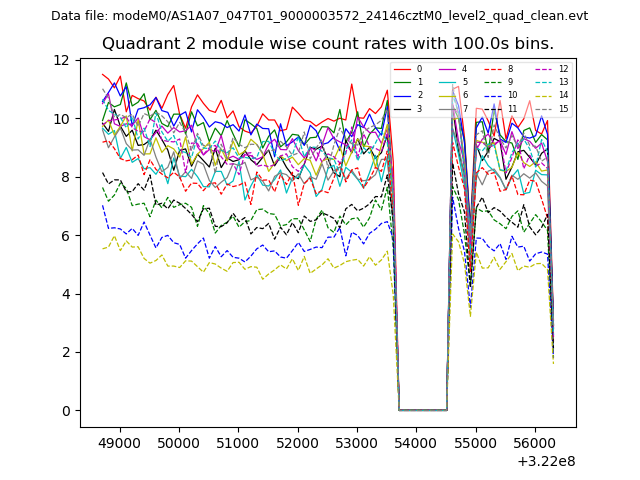
| Module-wise count rates for Quadrant B Data is divided into 100 sec bins |
 |
 |
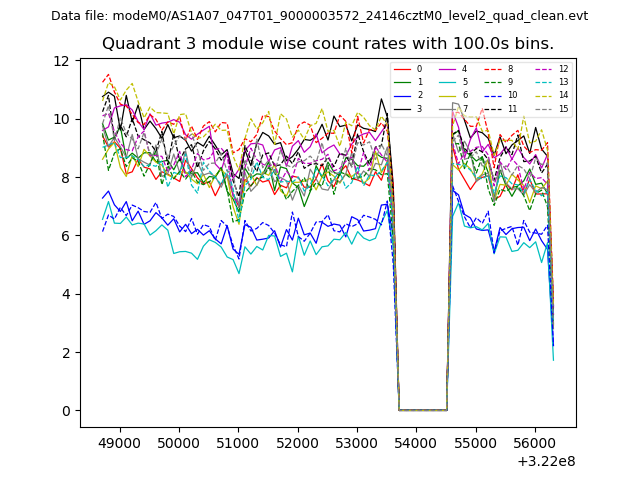
| Module-wise count rates for Quadrant C Data is divided into 100 sec bins |
 |
 |
| Module-wise count rates for Quadrant D Data is divided into 100 sec bins |
 |
 |
| Parameter | Plot |
|---|---|
| CZT HV Monitor | 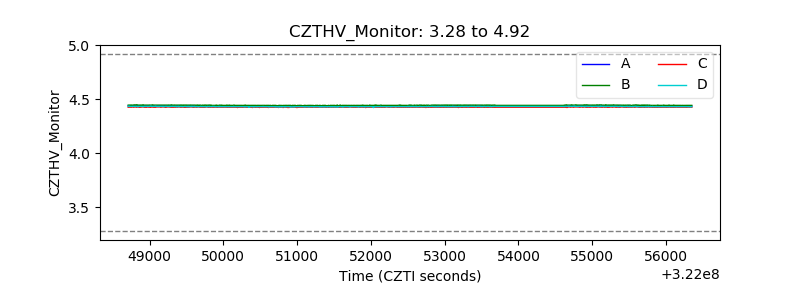 |
| D_VDD | 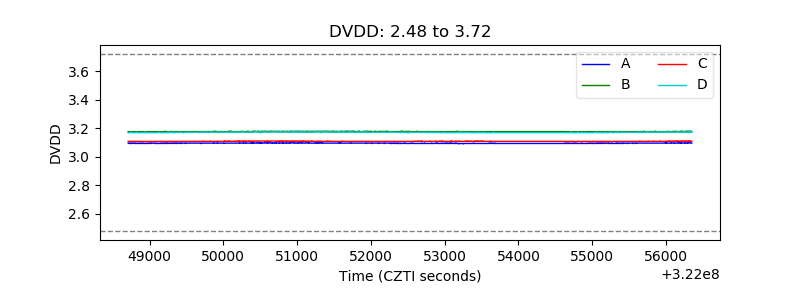 |
| Temperature 1 | 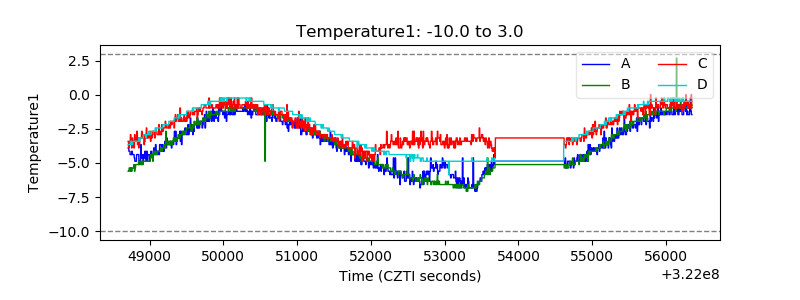 |
| Veto HV Monitor | 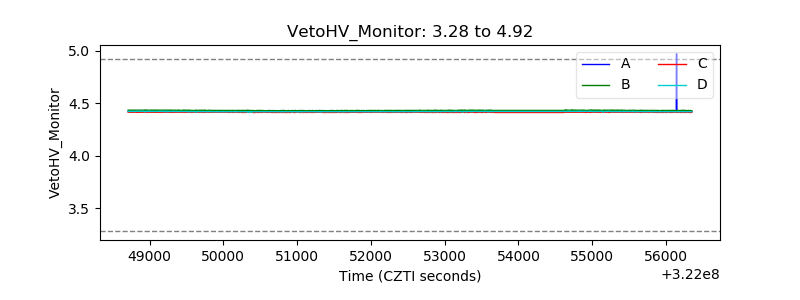 |
| Veto LLD | 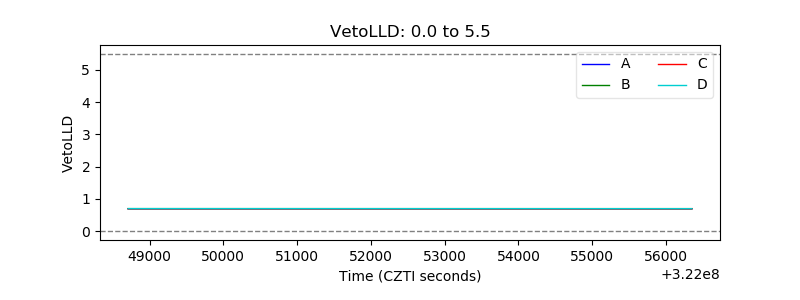 |
| Alpha Counter | 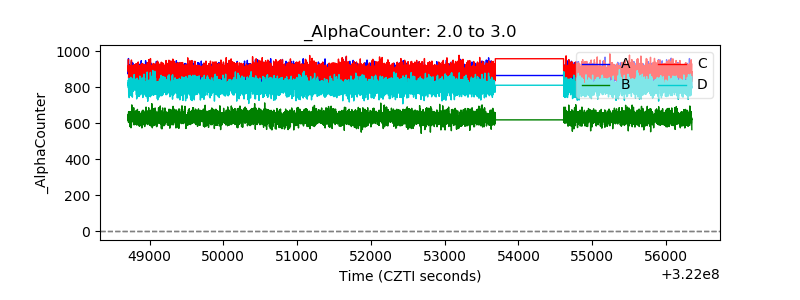 |
| _CPM_Rate | 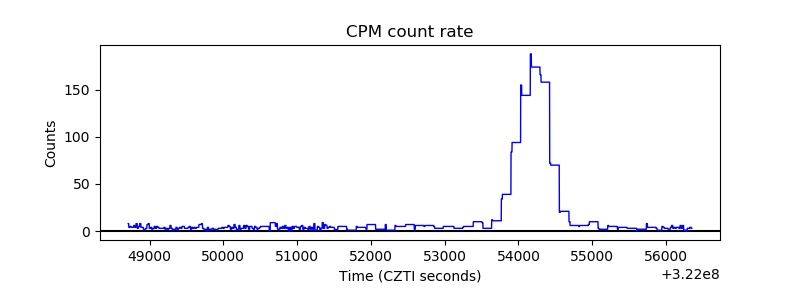 |
| CZT Counter | 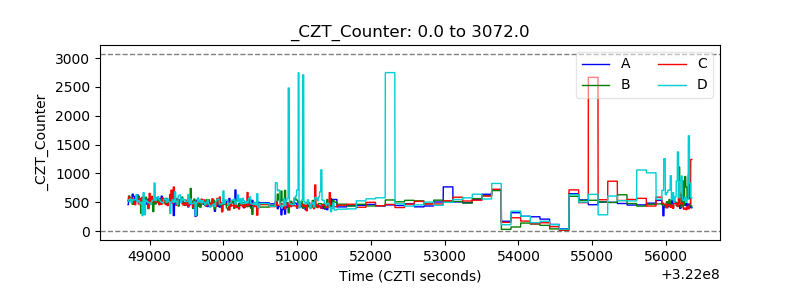 |
| +2.5 Volts monitor |  |
| +5 Volts monitor |  |
| _ROLL_ROT | 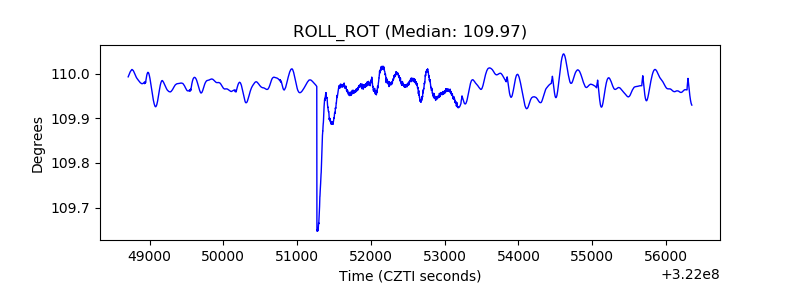 |
| _Roll_DEC | 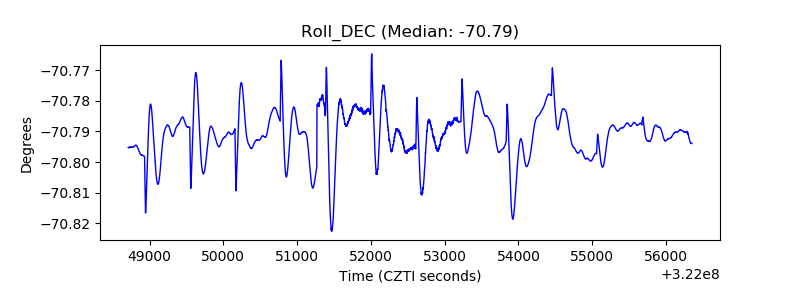 |
| _Roll_RA | 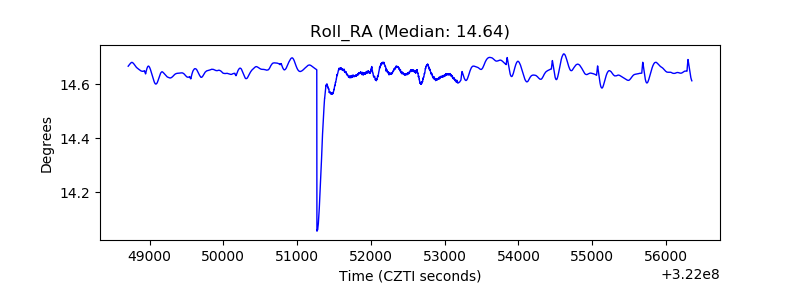 |
| Veto Counter | 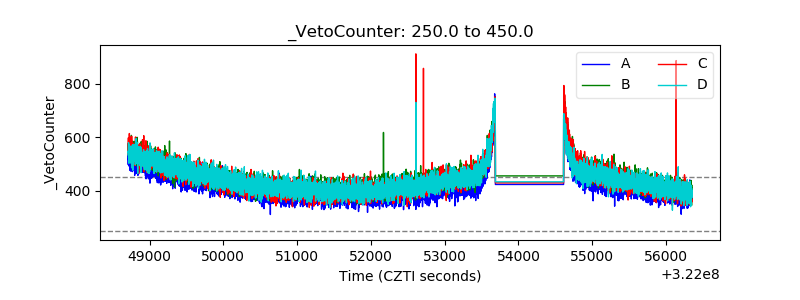 |