| Param | Original file | Final file |
|---|---|---|
| Filename | modeM0/AS1A07_047T01_9000003572_24147cztM0_level2.evt | modeM0/AS1A07_047T01_9000003572_24147cztM0_level2_quad_clean.evt |
| Size (bytes) | 451,728,000 | 127,491,840 |
| Size | 430.8 MB | 121.6 MB |
| Events in quadrant A | 3,077,218 | 875,915 |
| Events in quadrant B | 3,175,137 | 878,412 |
| Events in quadrant C | 3,285,549 | 827,023 |
| Events in quadrant D | 3,695,277 | 820,992 |
| Mode SS | |||
|---|---|---|---|
| Quadrant | BADHDUFLAG | Total packets | Discarded packets |
| A | 0 | 134 | 0 |
| B | 0 | 134 | 0 |
| C | 0 | 134 | 0 |
| D | 0 | 134 | 0 |
| Mode M9 | |||
|---|---|---|---|
| Quadrant | BADHDUFLAG | Total packets | Discarded packets |
| A | 0 | 5 | 0 |
| B | 0 | 5 | 0 |
| C | 0 | 5 | 0 |
| D | 0 | 5 | 0 |
| Mode M0 | |||
|---|---|---|---|
| Quadrant | BADHDUFLAG | Total packets | Discarded packets |
| A | 0 | 13407 | 1 |
| B | 0 | 13613 | 1 |
| C | 0 | 14097 | 1 |
| D | 0 | 15265 | 1 |
| Quadrant | Total seconds | Saturated seconds | Saturation percentage |
|---|---|---|---|
| A | 6580 | 62 | 0.942249% |
| B | 6581 | 74 | 1.124449% |
| C | 6581 | 152 | 2.309679% |
| D | 6581 | 154 | 2.340070% |
Noise dominated data is calculated using 1-second bins in cleaned event files. If a bin has >2000 counts, and if more than 50% of those come from <1% of pixels, then it is considered to be noise-dominated and hence unusable.
| Quadrant | # 1 sec bins | Bins with >0 counts | Bins with >2000 counts | High rate bins dominated by noise | Noise dominated (total time) | Noise dominated (detector-on time) | Marked lightcurve |
|---|---|---|---|---|---|---|---|
| A | 7115 | 6581 | 0 | 0 | 0.00% | 0.00% | 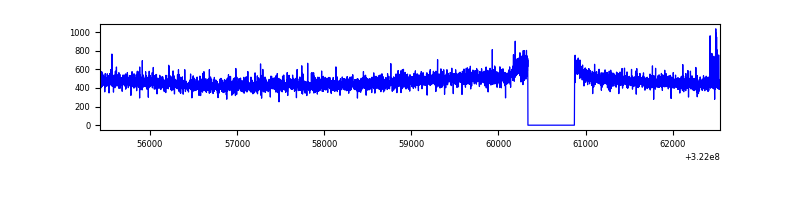 |
| B | 7116 | 6582 | 1 | 1 | 0.01% | 0.02% |  |
| C | 7116 | 6582 | 36 | 36 | 0.51% | 0.55% | 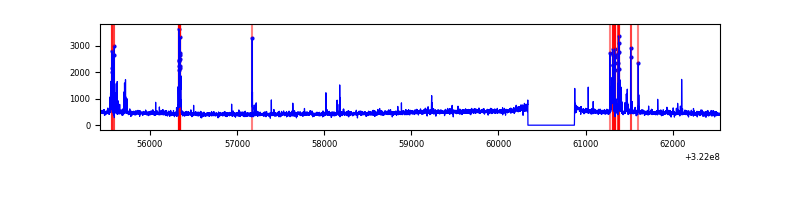 |
| D | 7116 | 6582 | 72 | 72 | 1.01% | 1.09% | 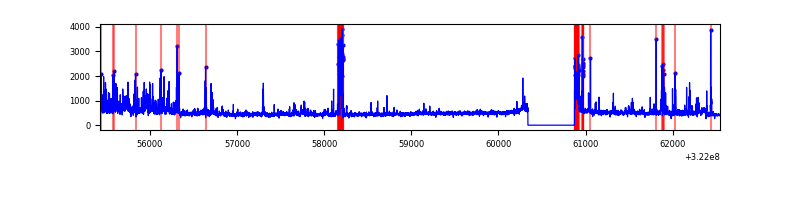 |
Top three noisy pixels from each quadrant. If the there are fewer than three noisy pixels in the level2.evt file, extra rows are filled as -1
| Pixel properties | Quadrant properties | ||||||
|---|---|---|---|---|---|---|---|
| Quadrant | DetID | PixID | Counts | Sigma | Mean | Median | Sigma |
| A | 3 | 1 | 14722 | 88.38 | 792 | 776 | 157.8 |
| A | 13 | 254 | 10345 | 60.64 | 792 | 776 | 157.8 |
| A | 2 | 79 | 8345 | 47.97 | 792 | 776 | 157.8 |
| B | 0 | 189 | 66438 | 448.29 | 782 | 765 | 146.5 |
| B | 12 | 111 | 17355 | 113.25 | 782 | 765 | 146.5 |
| B | 11 | 111 | 15771 | 102.43 | 782 | 765 | 146.5 |
| C | 2 | 16 | 174805 | 1017.88 | 743 | 745 | 171.0 |
| C | 14 | 238 | 120703 | 701.5 | 743 | 745 | 171.0 |
| C | 0 | 207 | 68123 | 394.02 | 743 | 745 | 171.0 |
| D | 7 | 238 | 235757 | 1285.94 | 759 | 734 | 182.8 |
| D | 1 | 52 | 224206 | 1222.74 | 759 | 734 | 182.8 |
| D | 8 | 195 | 223309 | 1217.83 | 759 | 734 | 182.8 |
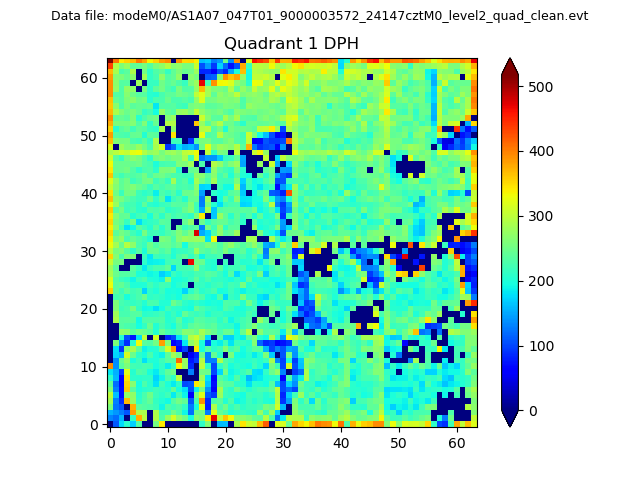
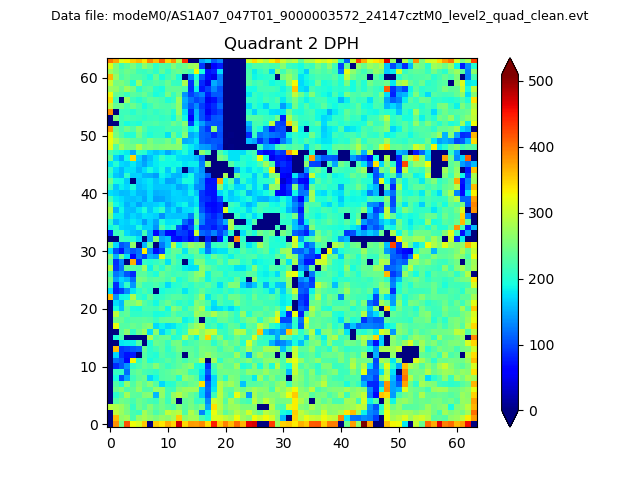
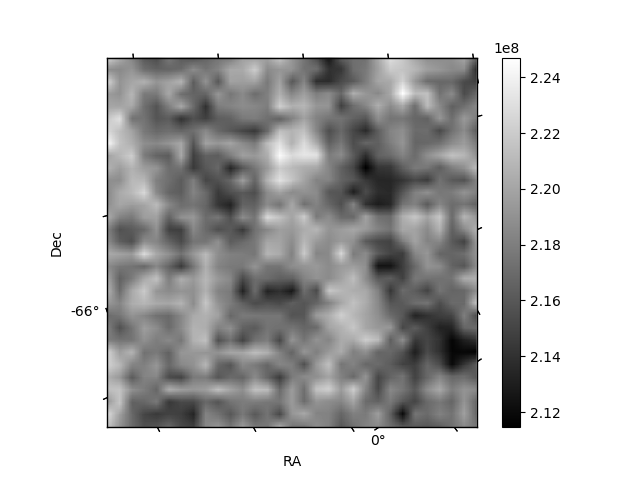
Histogram calculated using DETX and DETY for each event in the final _common_clean file
| Quadrant A | 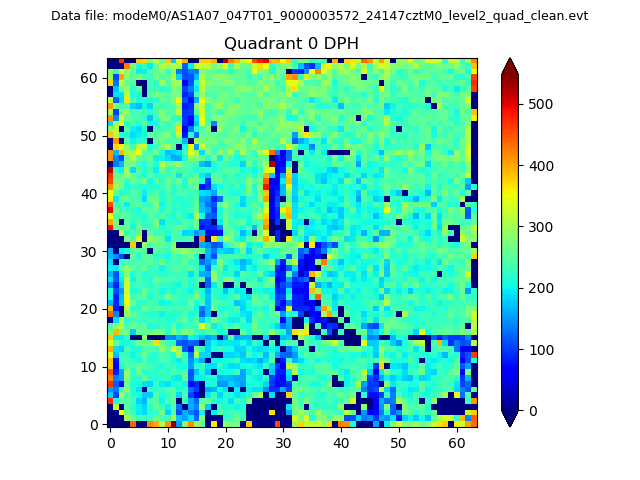 |
 |
Quadrant B |
|---|---|---|---|
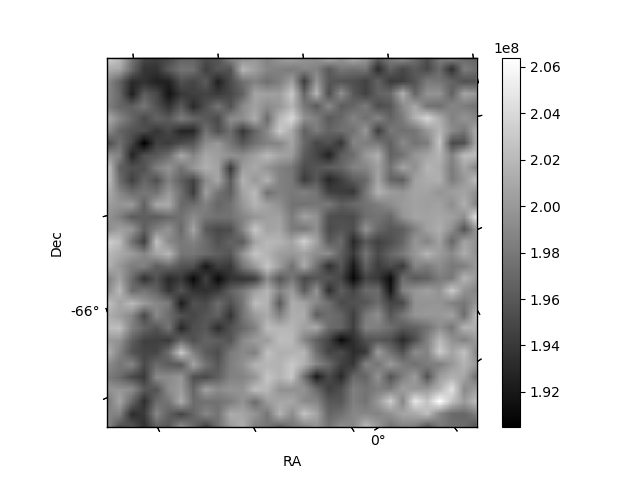
| Quadrant D | 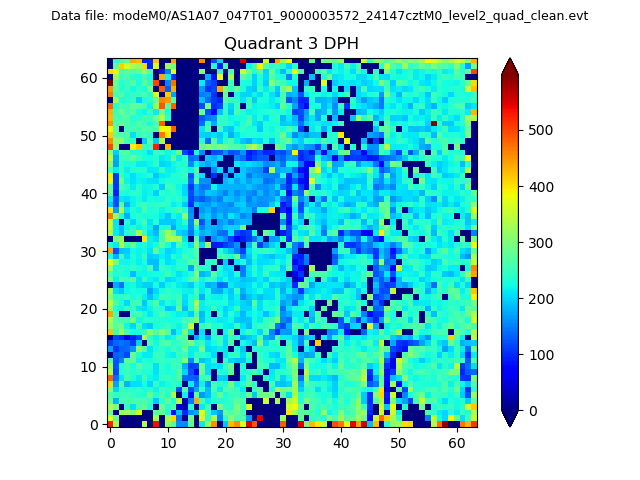 |
 |
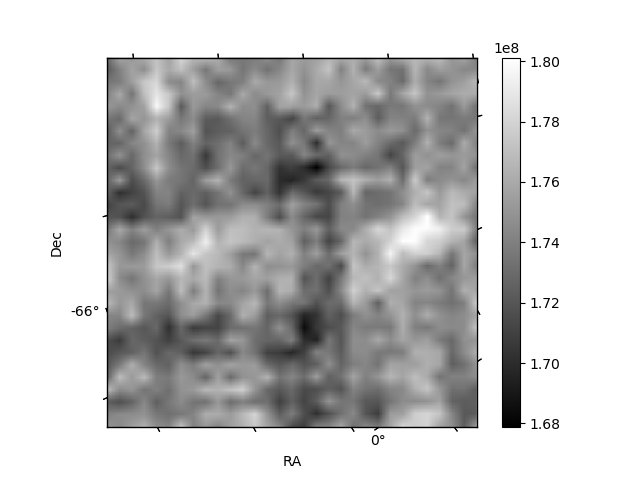
Quadrant C |
| Plot type | Count rate plots | Images |
|---|---|---|
| Comparison with Poisson distribution Blue bars denote a histogram of data divided into 1 sec bins. Red curve is a Poisson curve with rate = median count rate of data. |
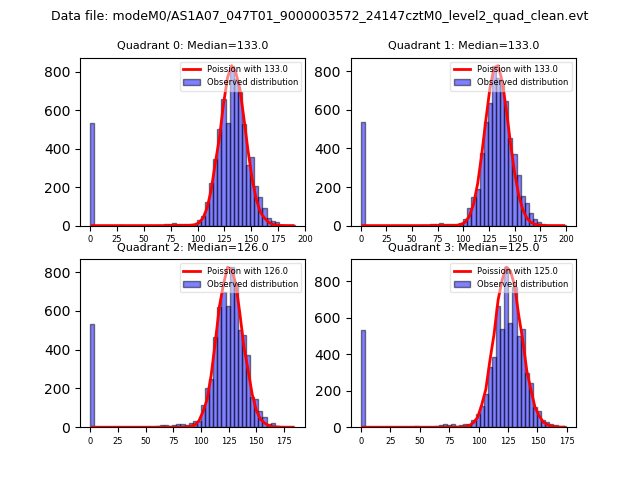 |
 |
| Quadrant-wise count rates Data is divided into 100 sec bins |
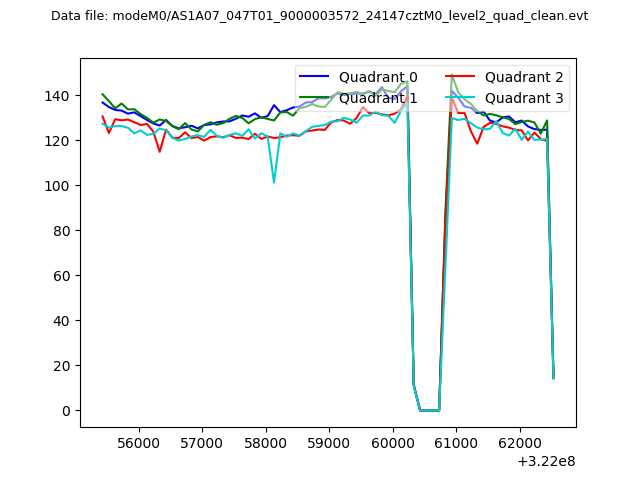 |
|
| Module-wise count rates for Quadrant A Data is divided into 100 sec bins |
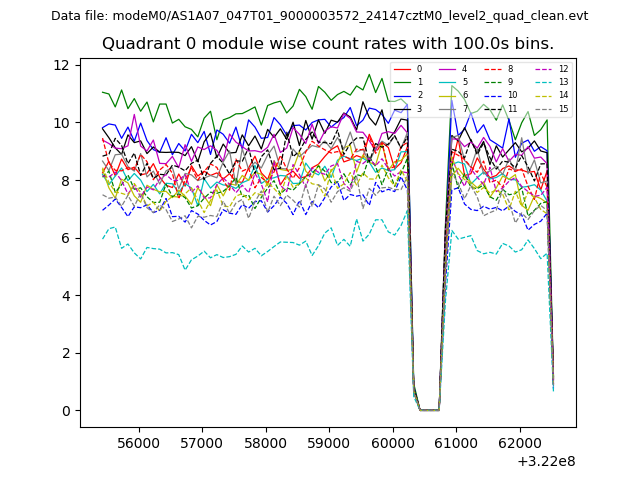 |
 |
| Module-wise count rates for Quadrant B Data is divided into 100 sec bins |
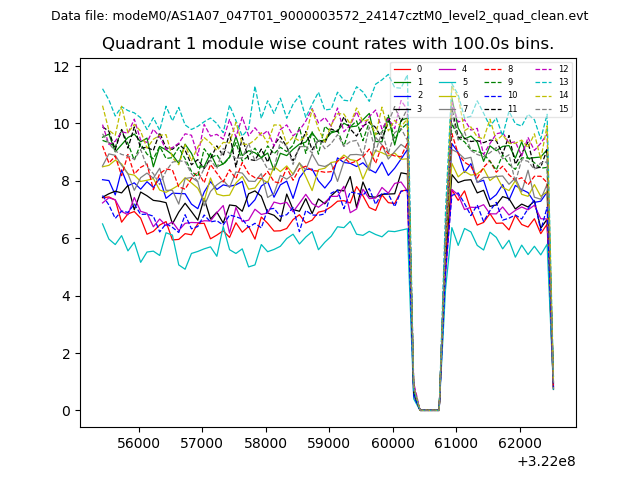 |
 |
| Module-wise count rates for Quadrant C Data is divided into 100 sec bins |
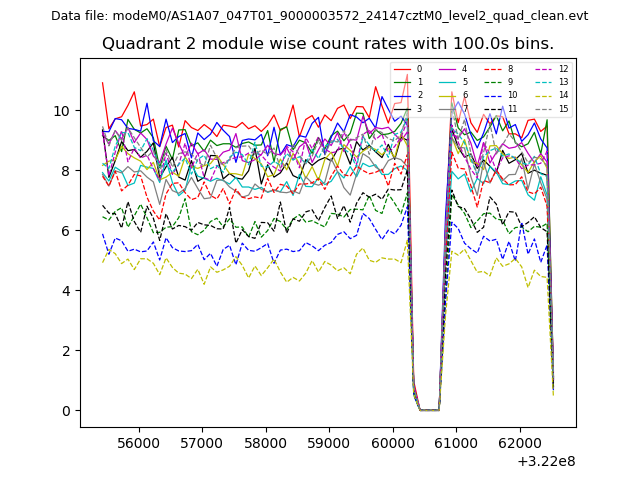 |
 |
| Module-wise count rates for Quadrant D Data is divided into 100 sec bins |
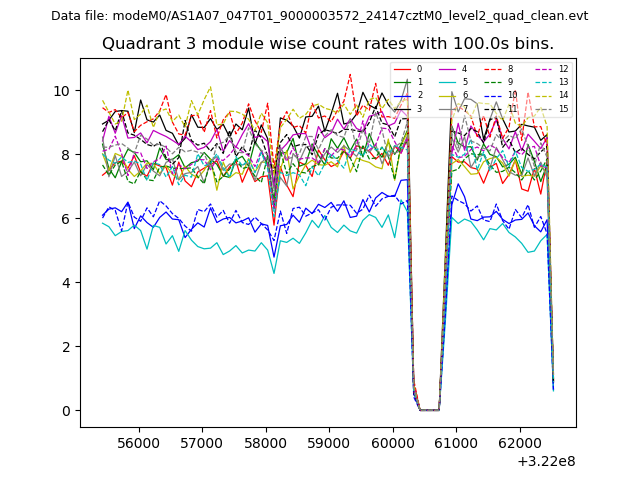 |
 |
| Parameter | Plot |
|---|---|
| CZT HV Monitor | 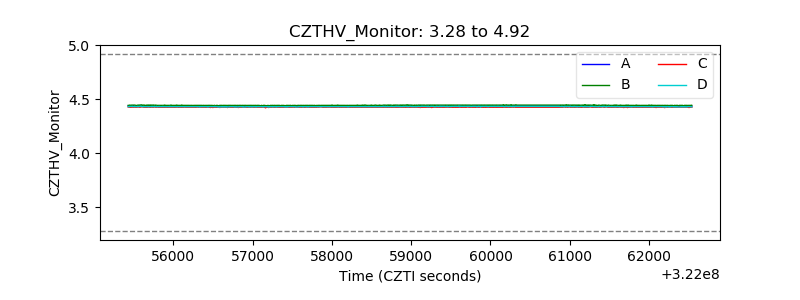 |
| D_VDD | 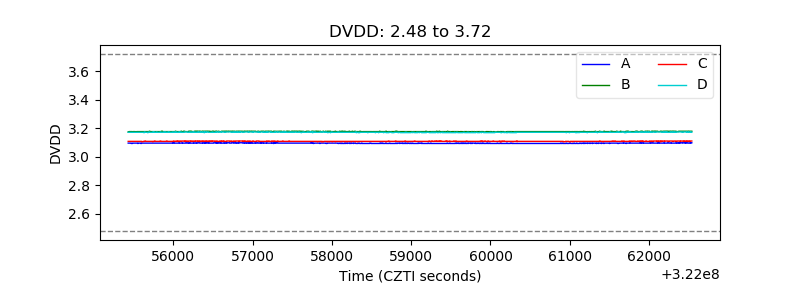 |
| Temperature 1 | 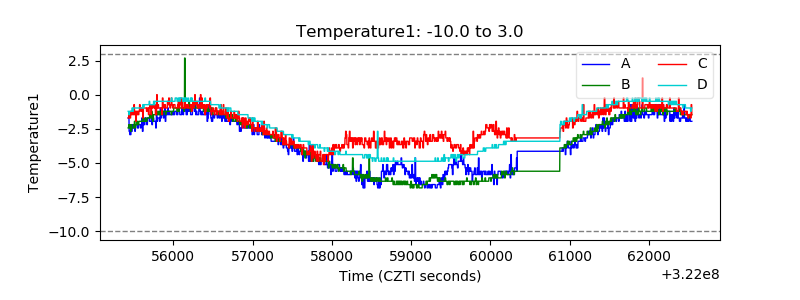 |
| Veto HV Monitor |  |
| Veto LLD | 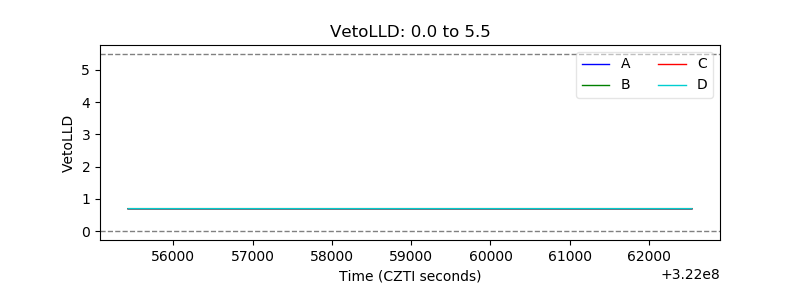 |
| Alpha Counter | 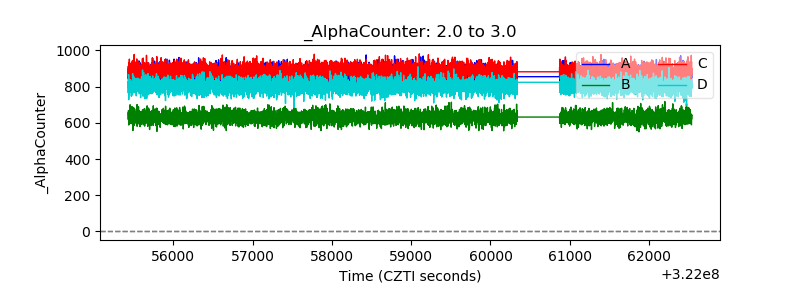 |
| _CPM_Rate | 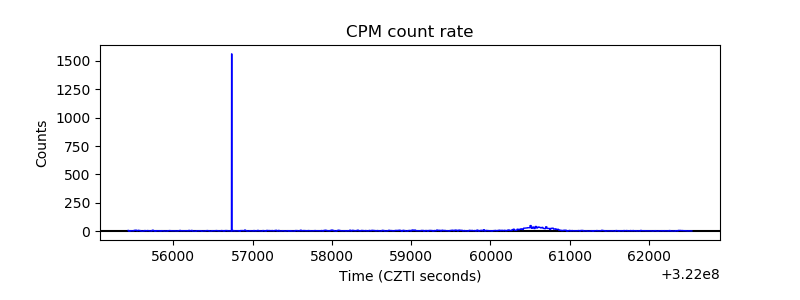 |
| CZT Counter |  |
| +2.5 Volts monitor |  |
| +5 Volts monitor | 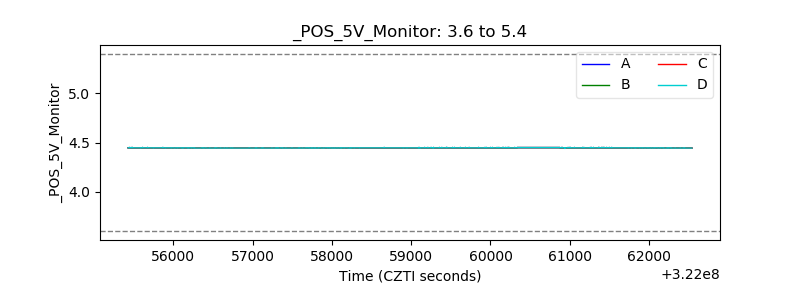 |
| _ROLL_ROT | 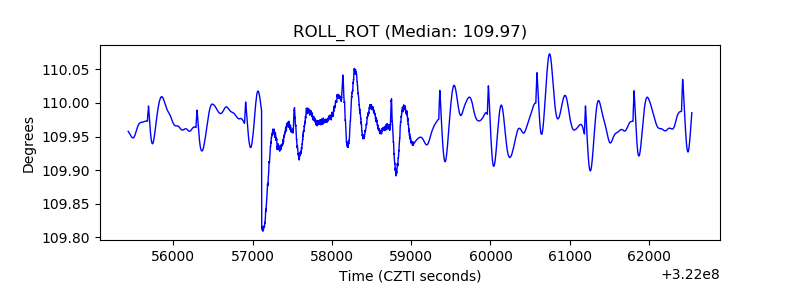 |
| _Roll_DEC | 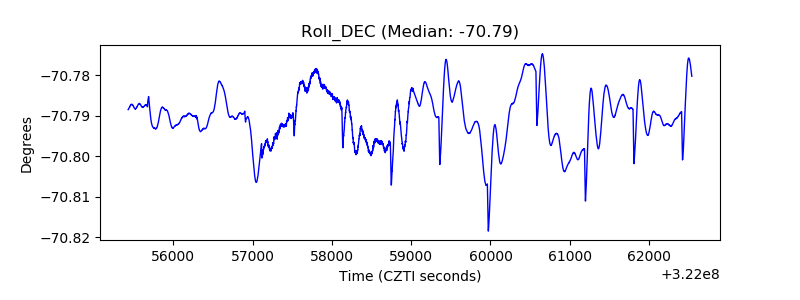 |
| _Roll_RA |  |
| Veto Counter | 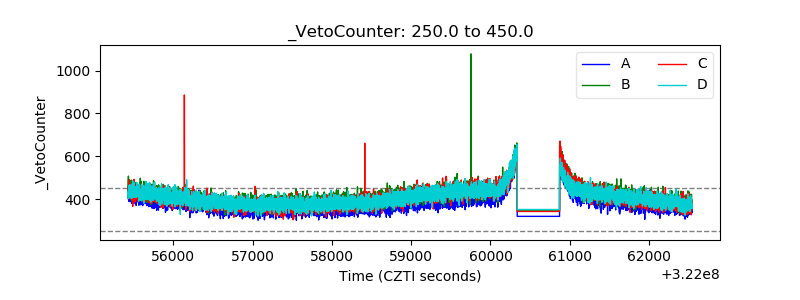 |