| Param | Original file | Final file |
|---|---|---|
| Filename | modeM0/AS1A07_047T01_9000003572_24148cztM0_level2.evt | modeM0/AS1A07_047T01_9000003572_24148cztM0_level2_quad_clean.evt |
| Size (bytes) | 161,481,600 | 45,048,960 |
| Size | 154.0 MB | 43.0 MB |
| Events in quadrant A | 1,104,061 | 304,624 |
| Events in quadrant B | 1,140,839 | 302,977 |
| Events in quadrant C | 1,157,072 | 291,435 |
| Events in quadrant D | 1,321,964 | 291,299 |
| Mode SS | |||
|---|---|---|---|
| Quadrant | BADHDUFLAG | Total packets | Discarded packets |
| A | 0 | 48 | 0 |
| B | 0 | 48 | 0 |
| C | 0 | 48 | 0 |
| D | 0 | 48 | 0 |
| Mode M0 | |||
|---|---|---|---|
| Quadrant | BADHDUFLAG | Total packets | Discarded packets |
| A | 0 | 4937 | 0 |
| B | 0 | 5081 | 0 |
| C | 0 | 5192 | 0 |
| D | 0 | 5532 | 0 |
| Quadrant | Total seconds | Saturated seconds | Saturation percentage |
|---|---|---|---|
| A | 2414 | 1 | 0.041425% |
| B | 2414 | 28 | 1.159901% |
| C | 2414 | 35 | 1.449876% |
| D | 2415 | 20 | 0.828157% |
Noise dominated data is calculated using 1-second bins in cleaned event files. If a bin has >2000 counts, and if more than 50% of those come from <1% of pixels, then it is considered to be noise-dominated and hence unusable.
| Quadrant | # 1 sec bins | Bins with >0 counts | Bins with >2000 counts | High rate bins dominated by noise | Noise dominated (total time) | Noise dominated (detector-on time) | Marked lightcurve |
|---|---|---|---|---|---|---|---|
| A | 2414 | 2414 | 0 | 0 | 0.00% | 0.00% | 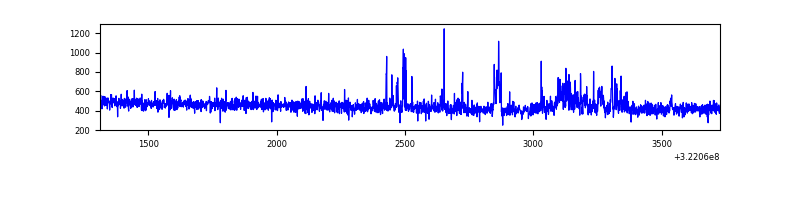 |
| B | 2414 | 2414 | 24 | 24 | 0.99% | 0.99% | 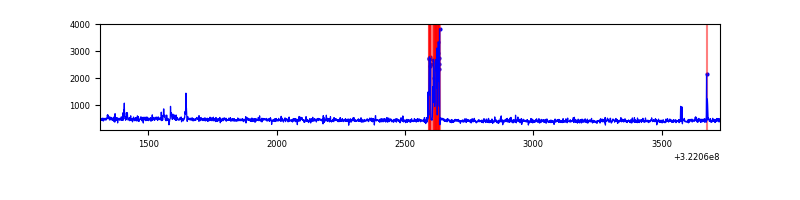 |
| C | 2414 | 2414 | 23 | 23 | 0.95% | 0.95% | 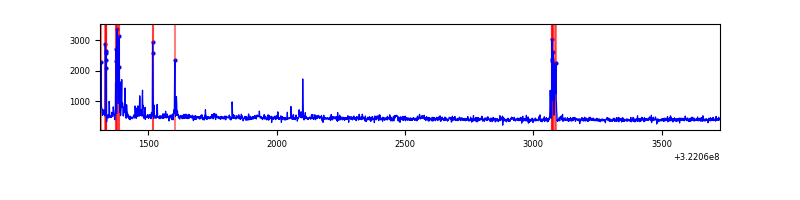 |
| D | 2415 | 2415 | 29 | 29 | 1.20% | 1.20% | 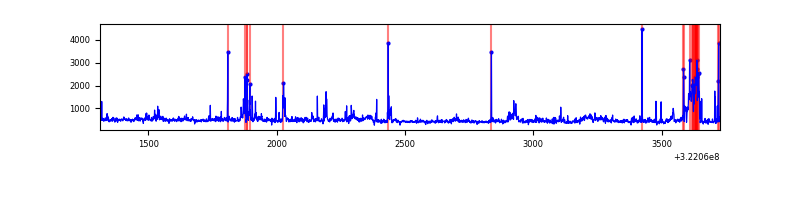 |
Top three noisy pixels from each quadrant. If the there are fewer than three noisy pixels in the level2.evt file, extra rows are filled as -1
| Pixel properties | Quadrant properties | ||||||
|---|---|---|---|---|---|---|---|
| Quadrant | DetID | PixID | Counts | Sigma | Mean | Median | Sigma |
| A | 3 | 1 | 49496 | 876.98 | 273 | 267 | 56.1 |
| A | 13 | 254 | 4012 | 66.71 | 273 | 267 | 56.1 |
| A | 0 | 226 | 2468 | 39.21 | 273 | 267 | 56.1 |
| B | 0 | 245 | 69599 | 1302.74 | 267 | 262 | 53.2 |
| B | 4 | 52 | 8767 | 159.8 | 267 | 262 | 53.2 |
| B | 0 | 190 | 8448 | 153.8 | 267 | 262 | 53.2 |
| C | 2 | 16 | 80867 | 1355.32 | 251 | 251 | 59.5 |
| C | 0 | 207 | 41163 | 687.82 | 251 | 251 | 59.5 |
| C | 14 | 238 | 40482 | 676.37 | 251 | 251 | 59.5 |
| D | 1 | 52 | 149240 | 2312.37 | 260 | 252 | 64.4 |
| D | 8 | 195 | 61437 | 949.62 | 260 | 252 | 64.4 |
| D | 7 | 238 | 59409 | 918.15 | 260 | 252 | 64.4 |
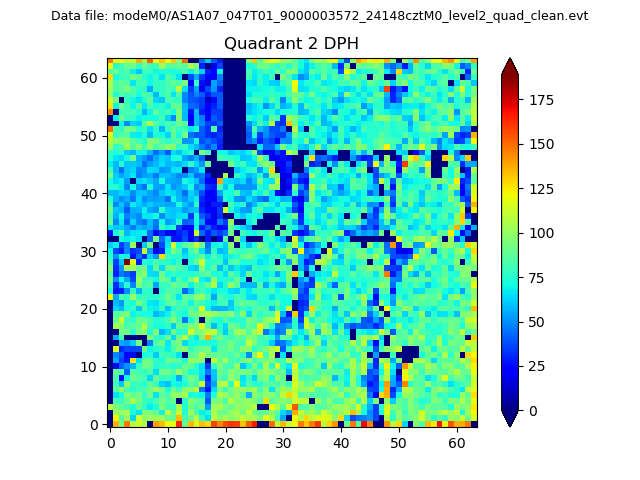
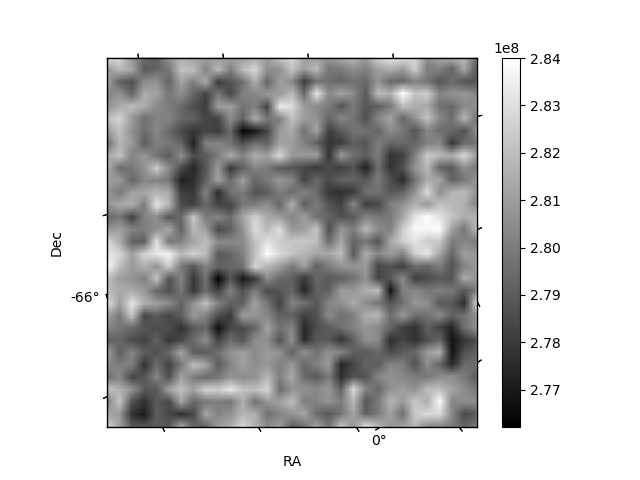
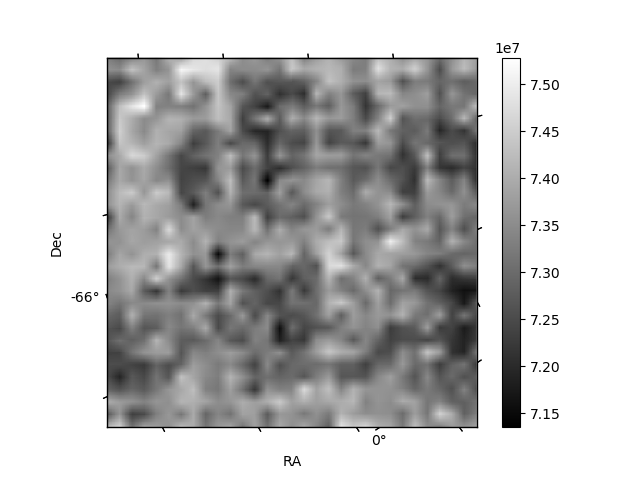
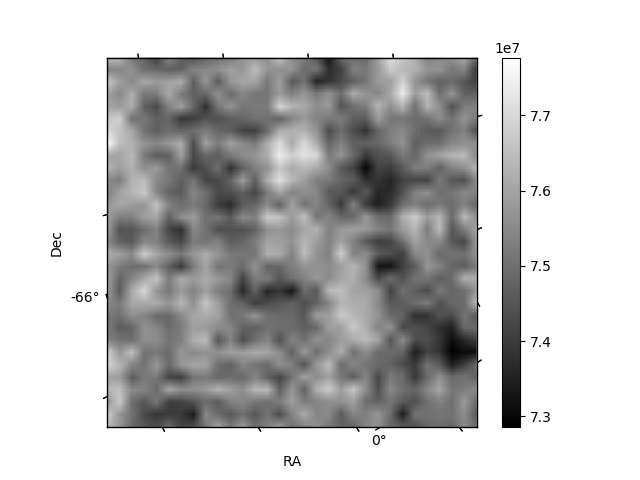
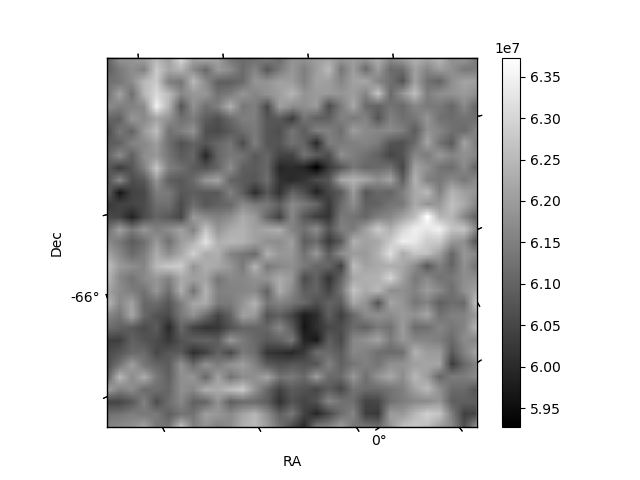
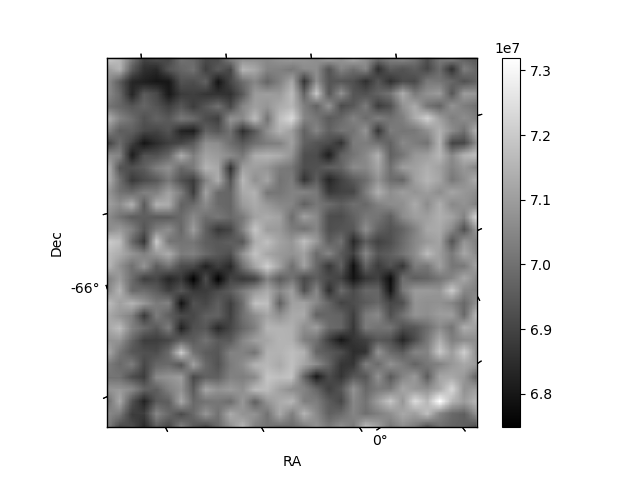
Histogram calculated using DETX and DETY for each event in the final _common_clean file
| Quadrant A | 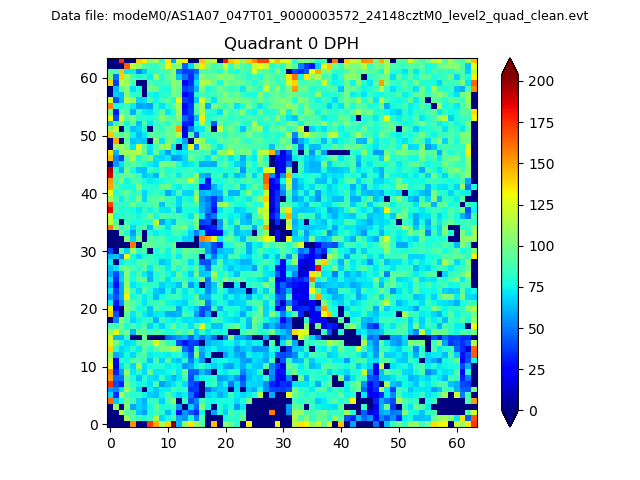 |
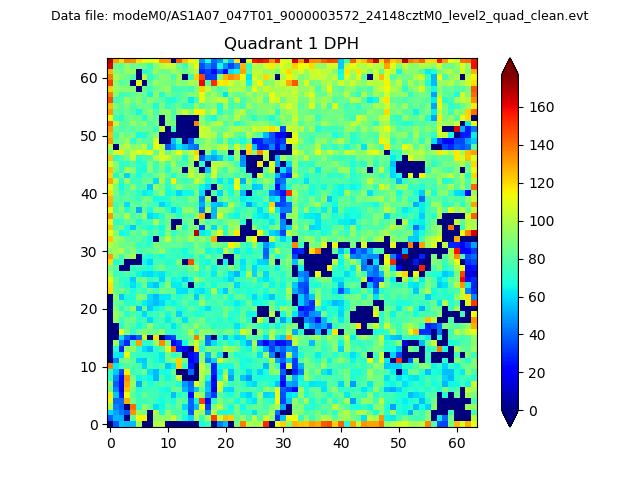 |
Quadrant B |
|---|---|---|---|
| Quadrant D | 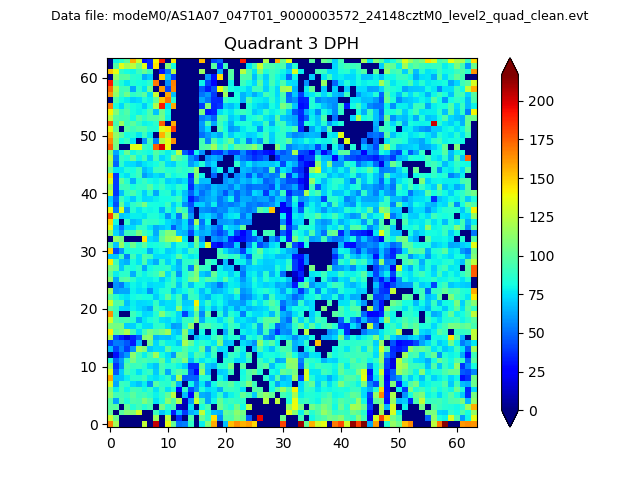 |
 |
Quadrant C |
| Plot type | Count rate plots | Images |
|---|---|---|
| Comparison with Poisson distribution Blue bars denote a histogram of data divided into 1 sec bins. Red curve is a Poisson curve with rate = median count rate of data. |
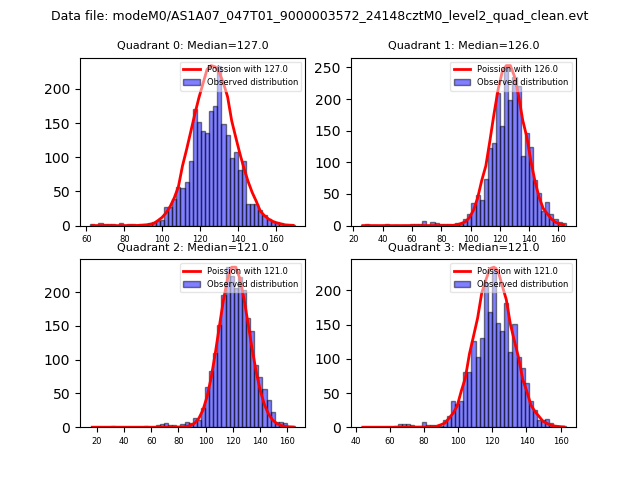 |
 |
| Quadrant-wise count rates Data is divided into 100 sec bins |
 |
|
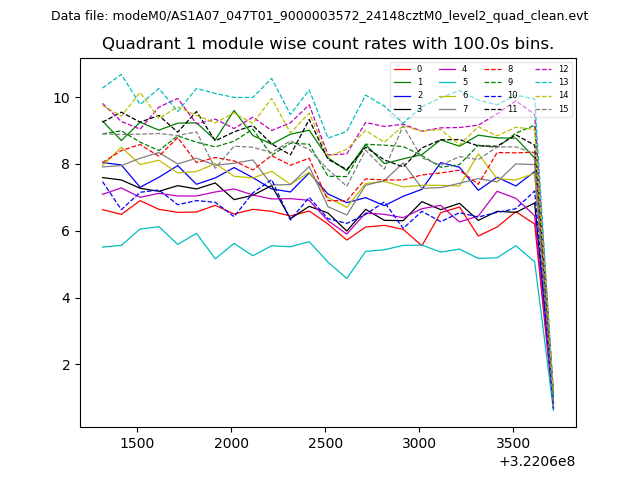
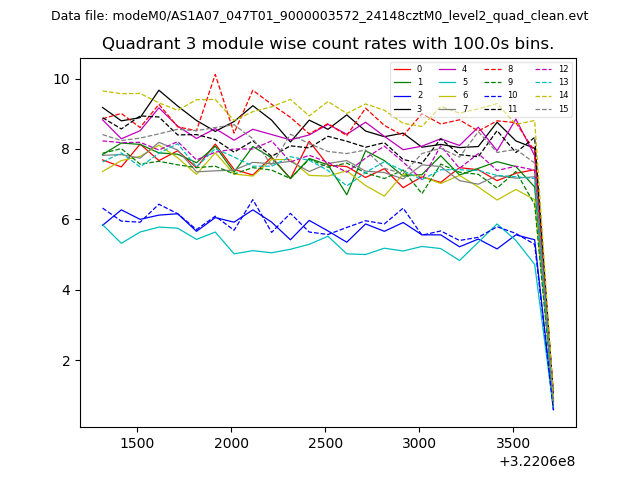
| Module-wise count rates for Quadrant A Data is divided into 100 sec bins |
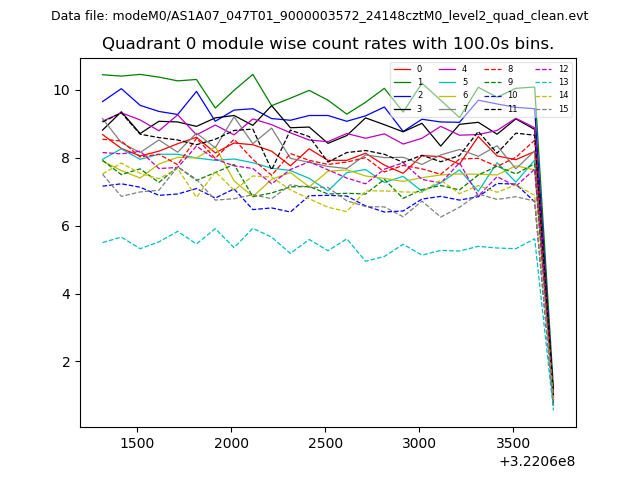 |
 |
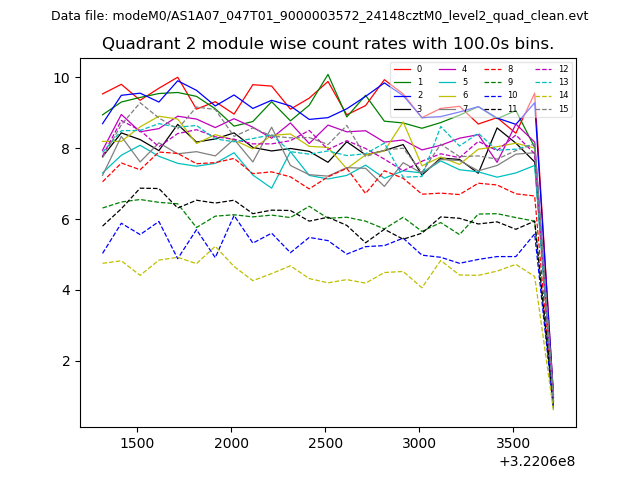
| Module-wise count rates for Quadrant B Data is divided into 100 sec bins |
 |
 |
| Module-wise count rates for Quadrant C Data is divided into 100 sec bins |
 |
 |
| Module-wise count rates for Quadrant D Data is divided into 100 sec bins |
 |
 |
| Parameter | Plot |
|---|---|
| CZT HV Monitor | 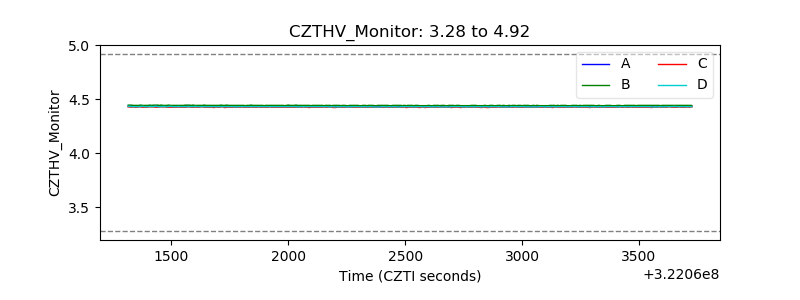 |
| D_VDD | 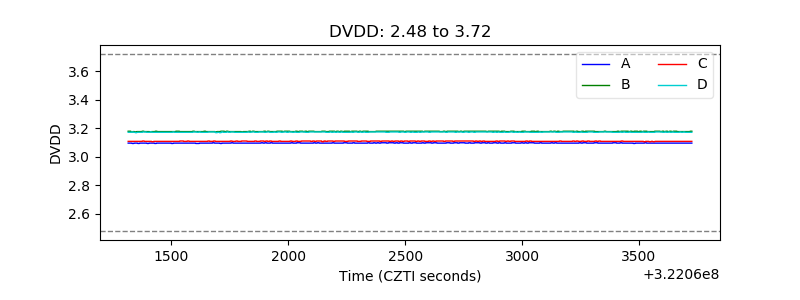 |
| Temperature 1 | 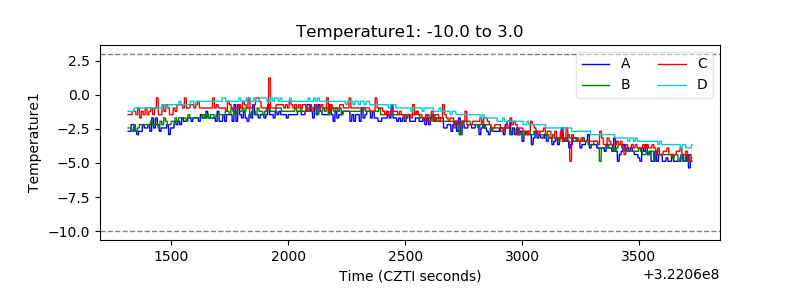 |
| Veto HV Monitor | 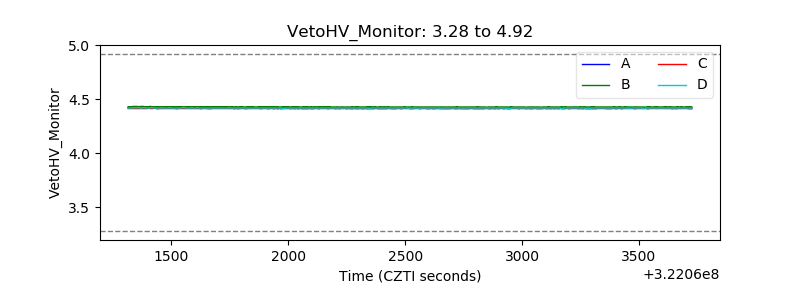 |
| Veto LLD | 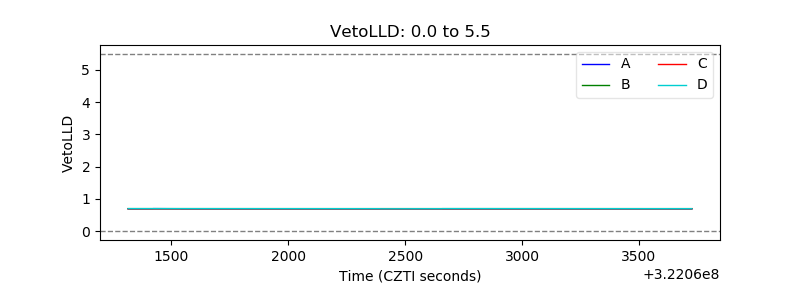 |
| Alpha Counter |  |
| _CPM_Rate | 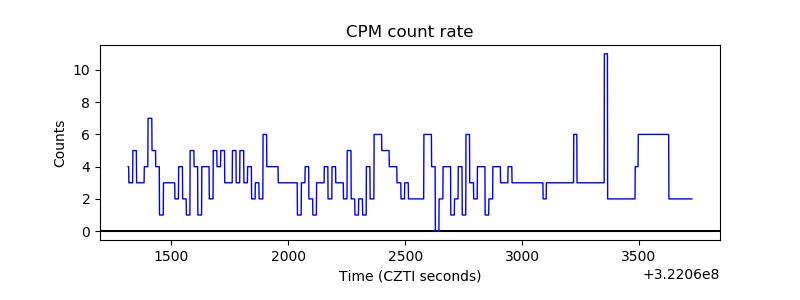 |
| CZT Counter | 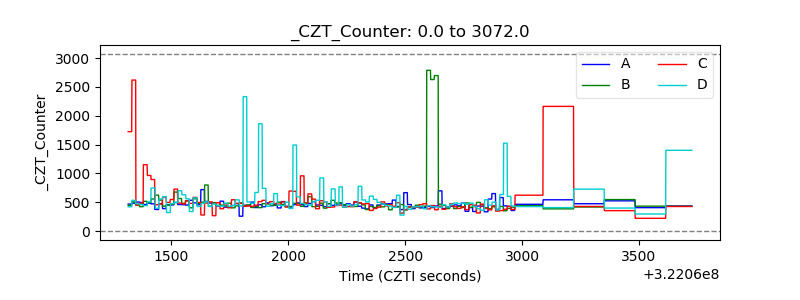 |
| +2.5 Volts monitor |  |
| +5 Volts monitor |  |
| _ROLL_ROT | 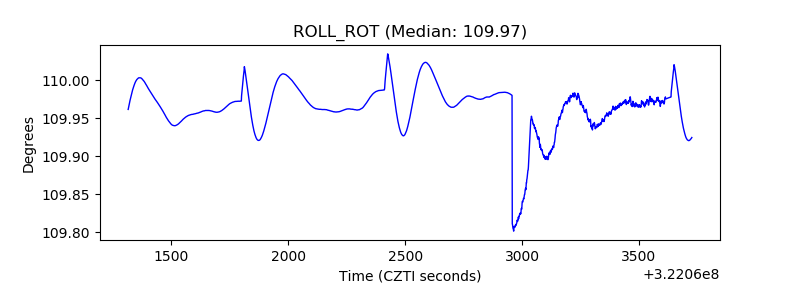 |
| _Roll_DEC | 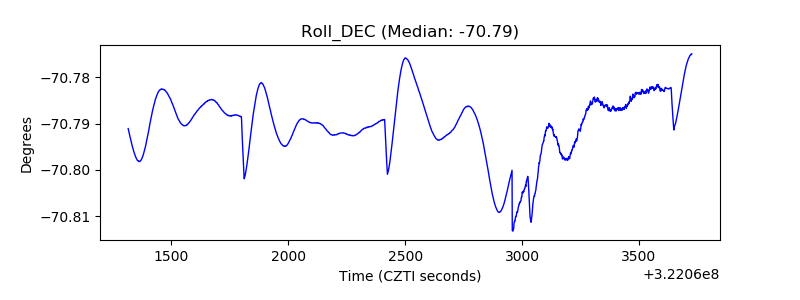 |
| _Roll_RA | 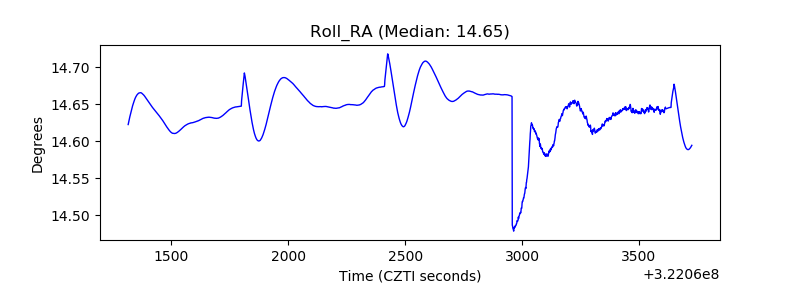 |
| Veto Counter | 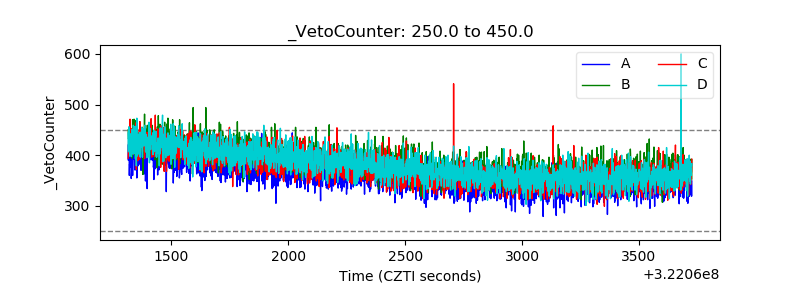 |