| Param | Original file | Final file |
|---|---|---|
| Filename | modeM0/AS1A07_047T02_9000003574cztM0_level2.fits | modeM0/AS1A07_047T02_9000003574cztM0_level2_quad_clean.evt |
| Size (bytes) | 151,214,400 | 202,501,440 |
| Size | 144.2 MB | 193.1 MB |
| Events in quadrant A | 928,002 | 1,342,184 |
| Events in quadrant B | 886,608 | 1,330,159 |
| Events in quadrant C | 889,478 | 1,242,811 |
| Events in quadrant D | 778,770 | 1,121,183 |
| Mode M9 | |||
|---|---|---|---|
| Quadrant | BADHDUFLAG | Total packets | Discarded packets |
| A | 0 | 9 | 0 |
| B | 0 | 9 | 0 |
| C | 0 | 9 | 0 |
| D | 0 | 9 | 0 |
| Mode SS | |||
|---|---|---|---|
| Quadrant | BADHDUFLAG | Total packets | Discarded packets |
| A | 0 | 324 | 0 |
| B | 0 | 324 | 0 |
| C | 0 | 324 | 0 |
| D | 0 | 324 | 0 |
| Mode M0 | |||
|---|---|---|---|
| Quadrant | BADHDUFLAG | Total packets | Discarded packets |
| A | 0 | 32609 | 0 |
| B | 0 | 33342 | 0 |
| C | 0 | 33606 | 0 |
| D | 0 | 42440 | 0 |
| Quadrant | Total seconds | Saturated seconds | Saturation percentage |
|---|---|---|---|
| A | 15895 | 205 | 1.289714% |
| B | 15895 | 310 | 1.950299% |
| C | 15895 | 307 | 1.931425% |
| D | 15895 | 746 | 4.693300% |
Noise dominated data is calculated using 1-second bins in cleaned event files. If a bin has >2000 counts, and if more than 50% of those come from <1% of pixels, then it is considered to be noise-dominated and hence unusable.
| Quadrant | # 1 sec bins | Bins with >0 counts | Bins with >2000 counts | High rate bins dominated by noise | Noise dominated (total time) | Noise dominated (detector-on time) | Marked lightcurve |
|---|---|---|---|---|---|---|---|
| A | 16810 | 15895 | 0 | 0 | 0.00% | 0.00% |  |
| B | 16810 | 15869 | 0 | 0 | 0.00% | 0.00% |  |
| C | 16810 | 15895 | 0 | 0 | 0.00% | 0.00% |  |
| D | 16810 | 15893 | 0 | 0 | 0.00% | 0.00% |  |
Top three noisy pixels from each quadrant. If the there are fewer than three noisy pixels in the level2.evt file, extra rows are filled as -1
| Pixel properties | Quadrant properties | ||||||
|---|---|---|---|---|---|---|---|
| Quadrant | DetID | PixID | Counts | Sigma | Mean | Median | Sigma |
| A | 0 | 29 | 899 | 11.03 | 241 | 227 | 61.0 |
| A | 7 | 110 | 733 | 8.3 | 241 | 227 | 61.0 |
| A | 9 | 19 | 724 | 8.15 | 241 | 227 | 61.0 |
| B | 2 | 9 | 714 | 10.11 | 234 | 223 | 48.6 |
| B | 3 | 17 | 608 | 7.93 | 234 | 223 | 48.6 |
| B | 2 | 8 | 599 | 7.74 | 234 | 223 | 48.6 |
| C | 1 | 81 | 702 | 7.89 | 234 | 218 | 61.3 |
| C | 1 | 80 | 683 | 7.58 | 234 | 218 | 61.3 |
| C | 12 | 241 | 668 | 7.34 | 234 | 218 | 61.3 |
| D | 7 | 3 | 574 | 6.13 | 221 | 201 | 60.9 |
| D | 3 | 14 | 563 | 5.95 | 221 | 201 | 60.9 |
| D | 6 | 231 | 556 | 5.83 | 221 | 201 | 60.9 |
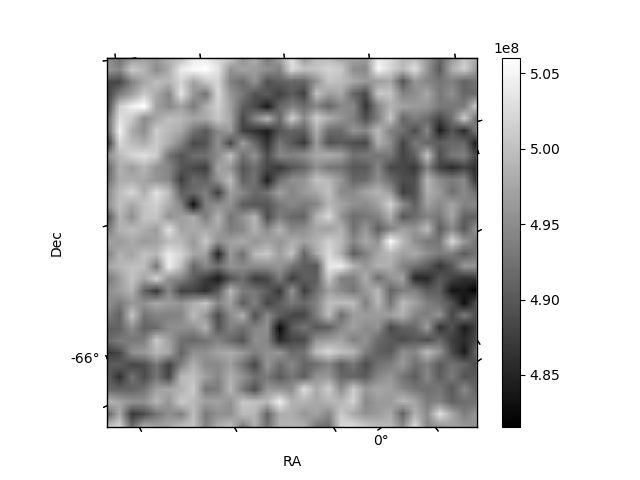
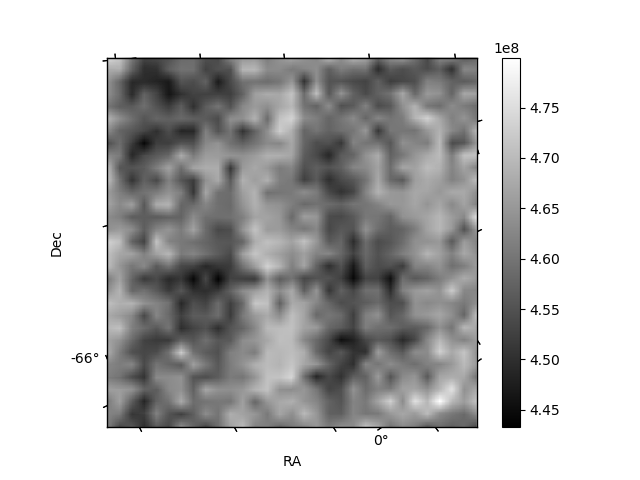
Histogram calculated using DETX and DETY for each event in the final _common_clean file
| Quadrant A |  |
 |
Quadrant B |
|---|---|---|---|
| Quadrant D |  |
 |
Quadrant C |
| Plot type | Count rate plots | Images |
|---|---|---|
| Comparison with Poisson distribution Blue bars denote a histogram of data divided into 1 sec bins. Red curve is a Poisson curve with rate = median count rate of data. |
 |
 |
| Quadrant-wise count rates Data is divided into 100 sec bins |
 |
|
| Module-wise count rates for Quadrant A Data is divided into 100 sec bins |
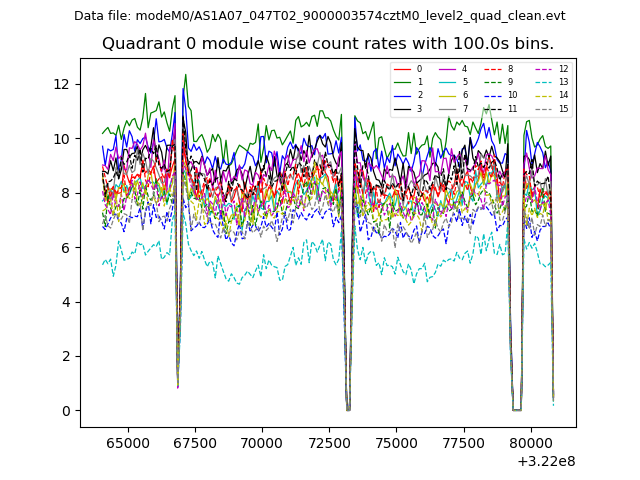 |
 |
| Module-wise count rates for Quadrant B Data is divided into 100 sec bins |
 |
 |
| Module-wise count rates for Quadrant C Data is divided into 100 sec bins |
 |
 |
| Module-wise count rates for Quadrant D Data is divided into 100 sec bins |
 |
 |
| Parameter | Plot |
|---|---|
| CZT HV Monitor |  |
| D_VDD |  |
| Temperature 1 |  |
| Veto HV Monitor |  |
| Veto LLD |  |
| Alpha Counter |  |
| _CPM_Rate | 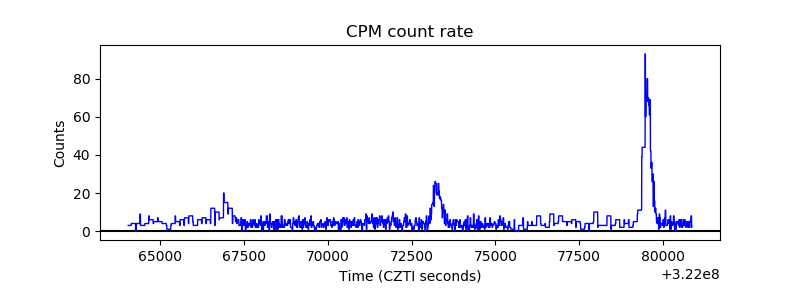 |
| CZT Counter |  |
| +2.5 Volts monitor |  |
| +5 Volts monitor |  |
| _ROLL_ROT | 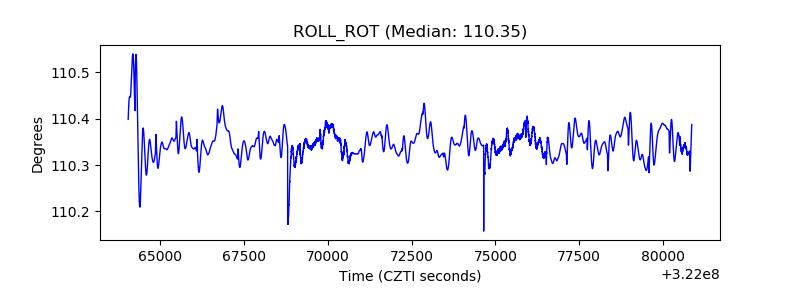 |
| _Roll_DEC |  |
| _Roll_RA |  |
| Veto Counter |  |