| Param | Original file | Final file |
|---|---|---|
| Filename | modeM0/AS1A07_047T02_9000003574_24152cztM0_level2.evt | modeM0/AS1A07_047T02_9000003574_24152cztM0_level2_quad_clean.evt |
| Size (bytes) | 482,541,120 | 129,055,680 |
| Size | 460.2 MB | 123.1 MB |
| Events in quadrant A | 3,198,894 | 884,222 |
| Events in quadrant B | 3,390,392 | 882,445 |
| Events in quadrant C | 3,255,514 | 837,958 |
| Events in quadrant D | 4,301,237 | 824,497 |
| Mode M9 | |||
|---|---|---|---|
| Quadrant | BADHDUFLAG | Total packets | Discarded packets |
| A | 0 | 4 | 0 |
| B | 0 | 4 | 0 |
| C | 0 | 4 | 0 |
| D | 0 | 4 | 0 |
| Mode SS | |||
|---|---|---|---|
| Quadrant | BADHDUFLAG | Total packets | Discarded packets |
| A | 0 | 140 | 0 |
| B | 0 | 140 | 0 |
| C | 0 | 140 | 0 |
| D | 0 | 140 | 0 |
| Mode M0 | |||
|---|---|---|---|
| Quadrant | BADHDUFLAG | Total packets | Discarded packets |
| A | 0 | 14005 | 1 |
| B | 0 | 14490 | 1 |
| C | 0 | 14216 | 1 |
| D | 0 | 17419 | 1 |
| Quadrant | Total seconds | Saturated seconds | Saturation percentage |
|---|---|---|---|
| A | 6883 | 53 | 0.770013% |
| B | 6884 | 118 | 1.714120% |
| C | 6884 | 78 | 1.133062% |
| D | 6884 | 240 | 3.486345% |
Noise dominated data is calculated using 1-second bins in cleaned event files. If a bin has >2000 counts, and if more than 50% of those come from <1% of pixels, then it is considered to be noise-dominated and hence unusable.
| Quadrant | # 1 sec bins | Bins with >0 counts | Bins with >2000 counts | High rate bins dominated by noise | Noise dominated (total time) | Noise dominated (detector-on time) | Marked lightcurve |
|---|---|---|---|---|---|---|---|
| A | 7358 | 6884 | 0 | 0 | 0.00% | 0.00% | 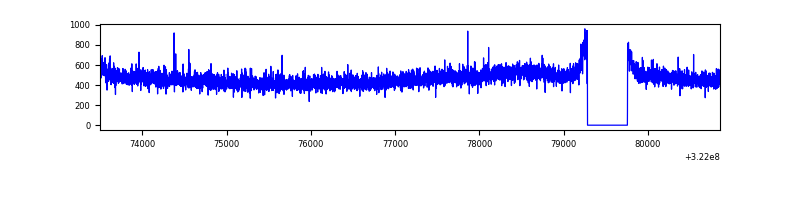 |
| B | 7359 | 6885 | 46 | 46 | 0.63% | 0.67% | 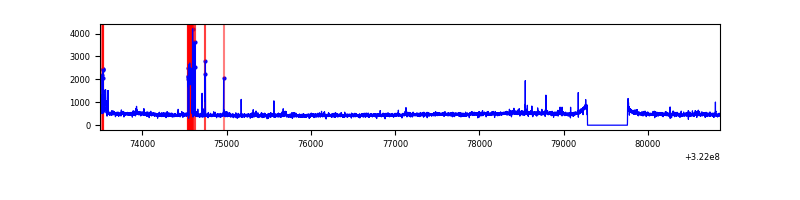 |
| C | 7359 | 6885 | 5 | 5 | 0.07% | 0.07% | 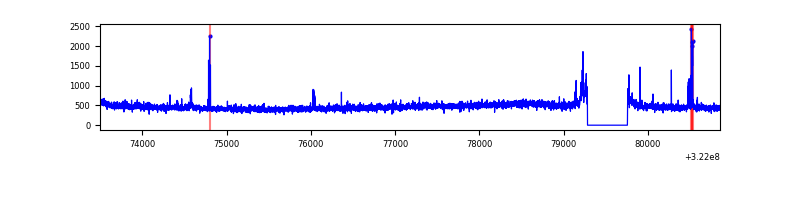 |
| D | 7359 | 6885 | 207 | 207 | 2.81% | 3.01% | 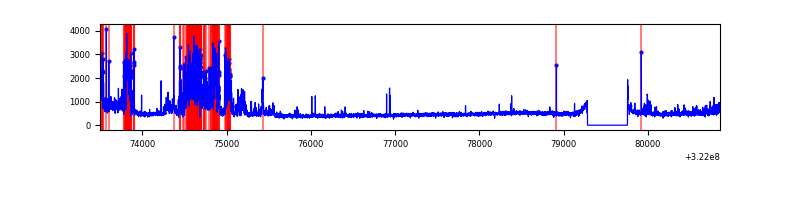 |
Top three noisy pixels from each quadrant. If the there are fewer than three noisy pixels in the level2.evt file, extra rows are filled as -1
| Pixel properties | Quadrant properties | ||||||
|---|---|---|---|---|---|---|---|
| Quadrant | DetID | PixID | Counts | Sigma | Mean | Median | Sigma |
| A | 13 | 254 | 12011 | 67.41 | 826 | 808 | 166.2 |
| A | 3 | 1 | 11408 | 63.78 | 826 | 808 | 166.2 |
| A | 3 | 137 | 7392 | 39.62 | 826 | 808 | 166.2 |
| B | 0 | 245 | 123900 | 795.63 | 813 | 793 | 154.7 |
| B | 5 | 172 | 30741 | 193.55 | 813 | 793 | 154.7 |
| B | 12 | 111 | 18151 | 112.18 | 813 | 793 | 154.7 |
| C | 14 | 238 | 124119 | 680.44 | 777 | 780 | 181.3 |
| C | 0 | 207 | 69607 | 379.71 | 777 | 780 | 181.3 |
| C | 0 | 239 | 17076 | 89.9 | 777 | 780 | 181.3 |
| D | 7 | 238 | 1113612 | 5779.46 | 789 | 765 | 192.6 |
| D | 8 | 195 | 131392 | 678.4 | 789 | 765 | 192.6 |
| D | 2 | 234 | 33901 | 172.09 | 789 | 765 | 192.6 |
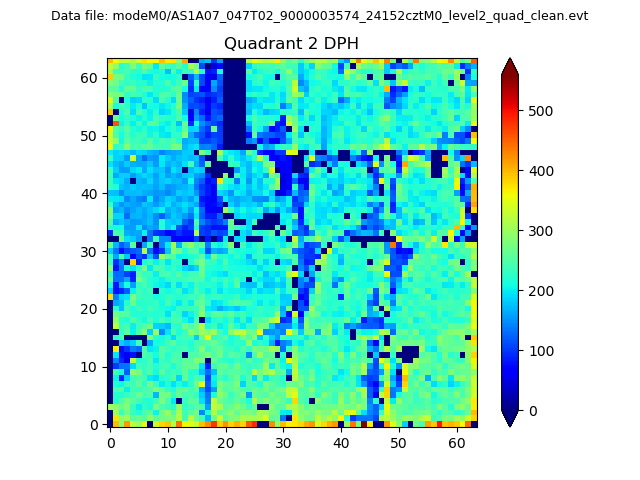
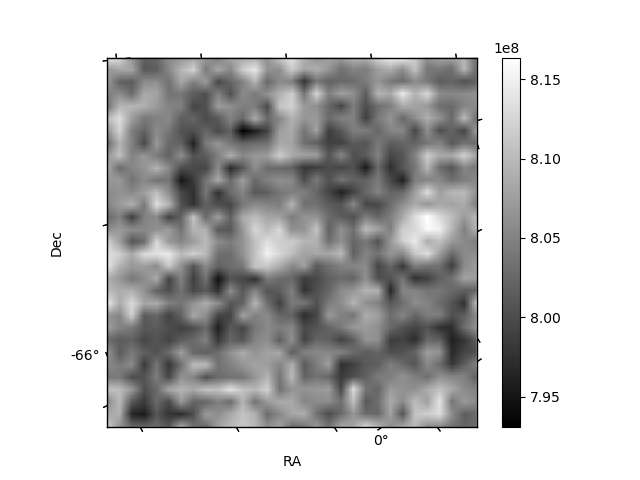
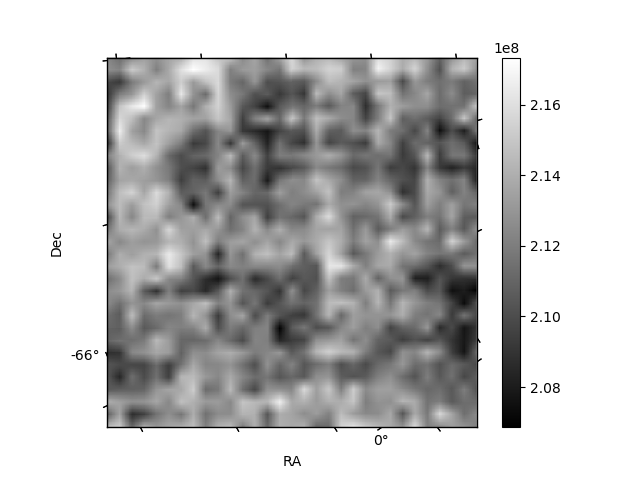
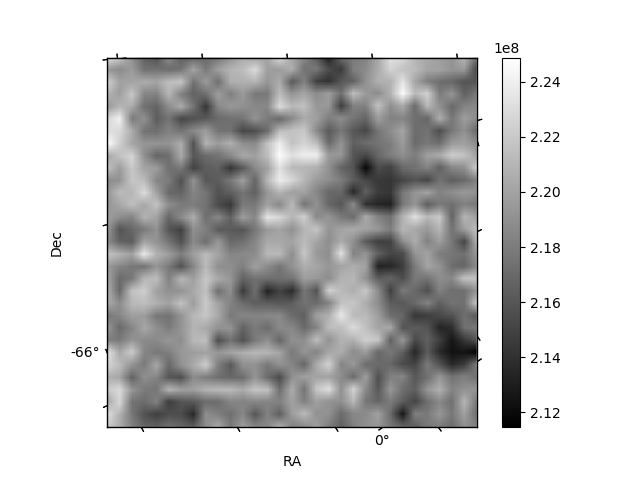
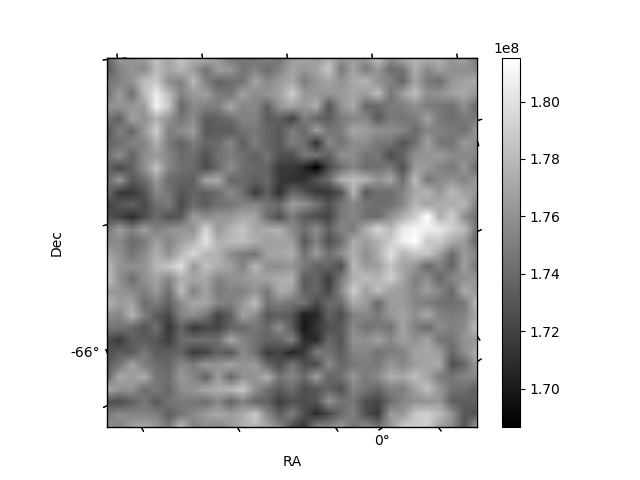
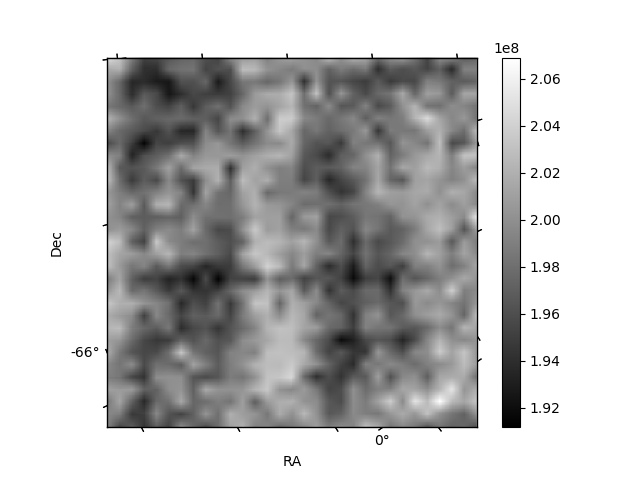
Histogram calculated using DETX and DETY for each event in the final _common_clean file
| Quadrant A | 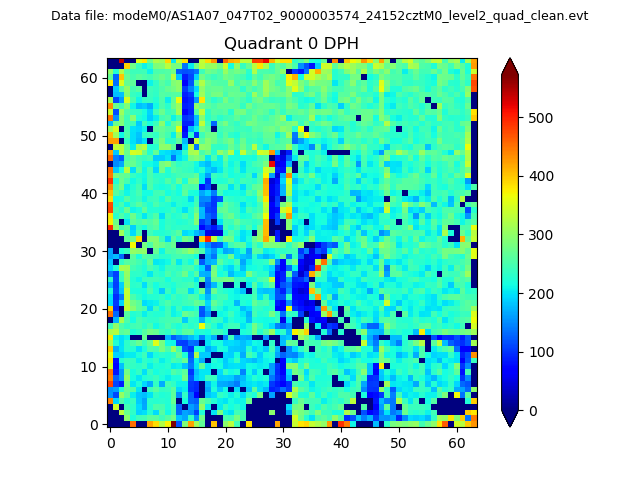 |
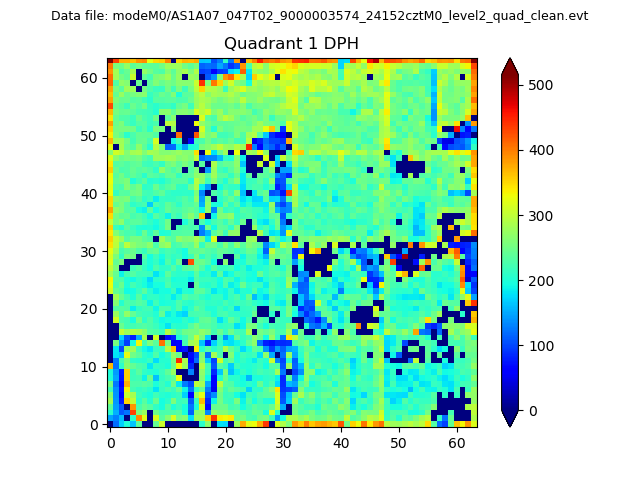 |
Quadrant B |
|---|---|---|---|
| Quadrant D | 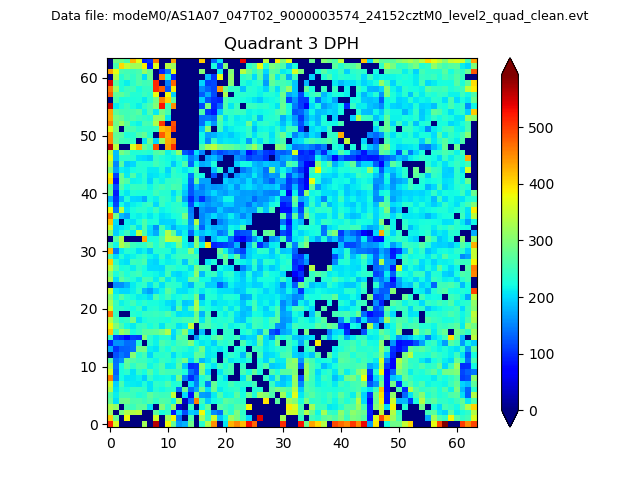 |
 |
Quadrant C |
| Plot type | Count rate plots | Images |
|---|---|---|
| Comparison with Poisson distribution Blue bars denote a histogram of data divided into 1 sec bins. Red curve is a Poisson curve with rate = median count rate of data. |
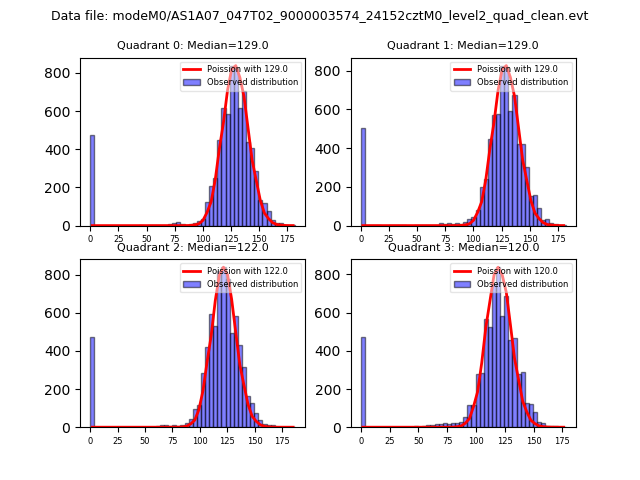 |
 |
| Quadrant-wise count rates Data is divided into 100 sec bins |
 |
|
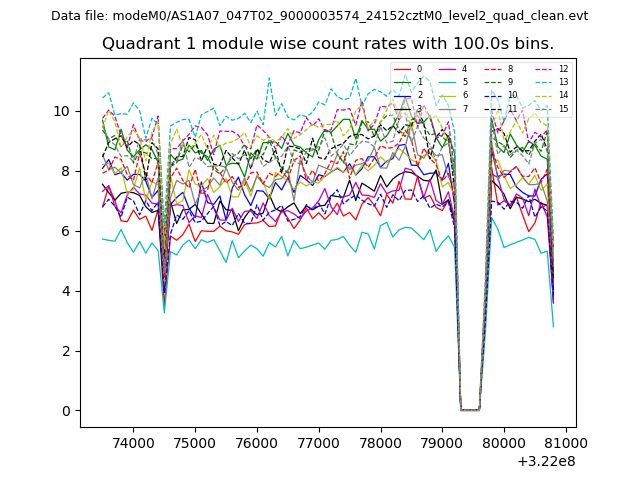
| Module-wise count rates for Quadrant A Data is divided into 100 sec bins |
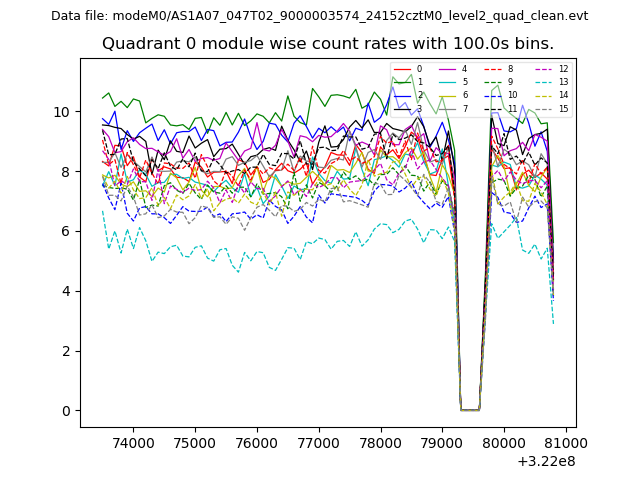 |
 |
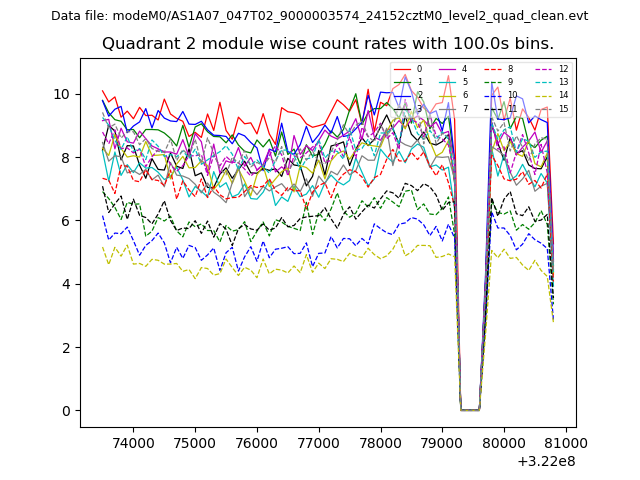
| Module-wise count rates for Quadrant B Data is divided into 100 sec bins |
 |
 |
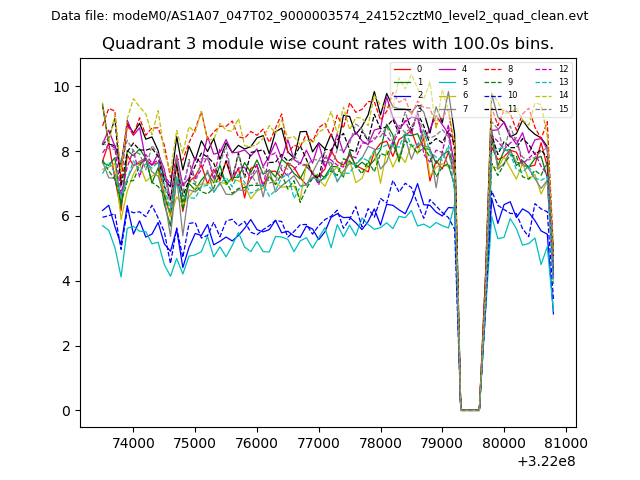
| Module-wise count rates for Quadrant C Data is divided into 100 sec bins |
 |
 |
| Module-wise count rates for Quadrant D Data is divided into 100 sec bins |
 |
 |
| Parameter | Plot |
|---|---|
| CZT HV Monitor | 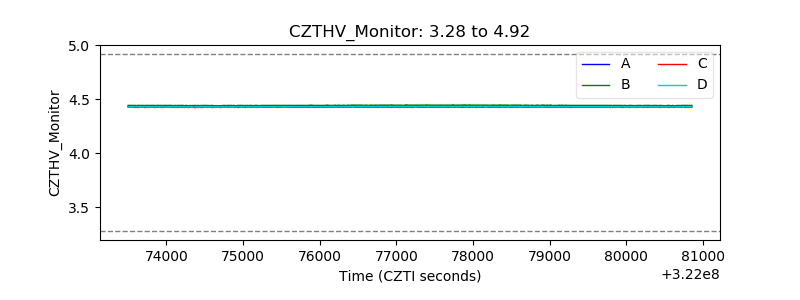 |
| D_VDD | 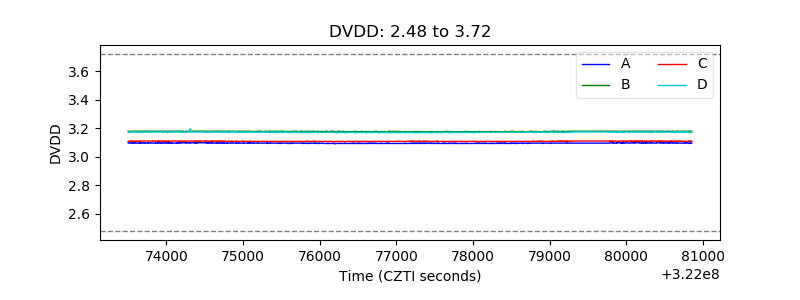 |
| Temperature 1 | 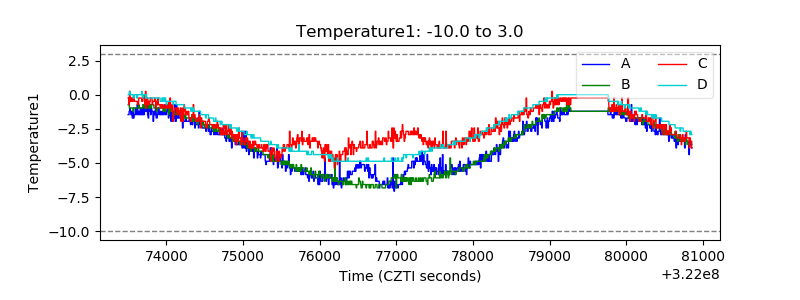 |
| Veto HV Monitor | 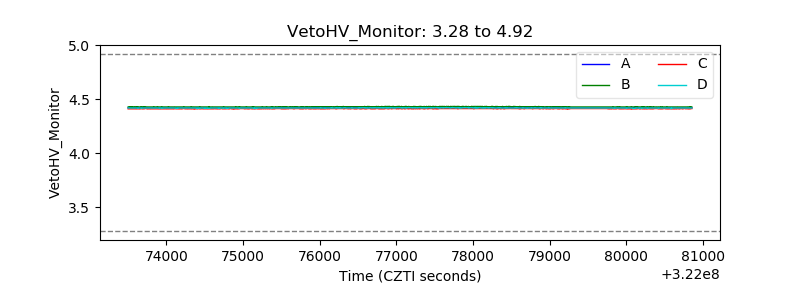 |
| Veto LLD | 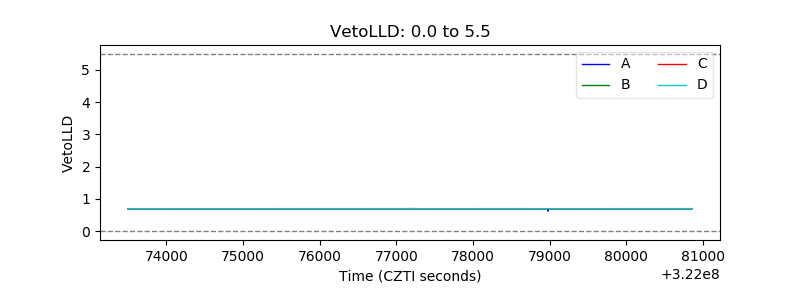 |
| Alpha Counter | 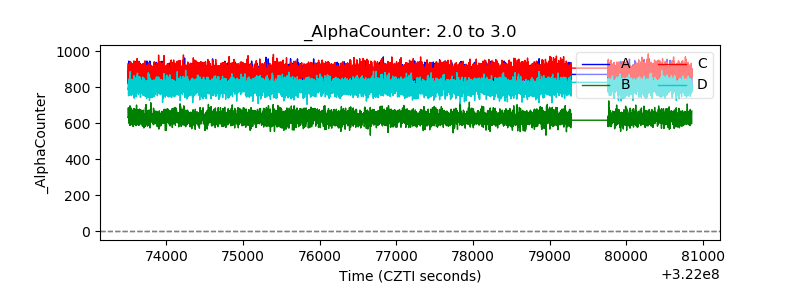 |
| _CPM_Rate | 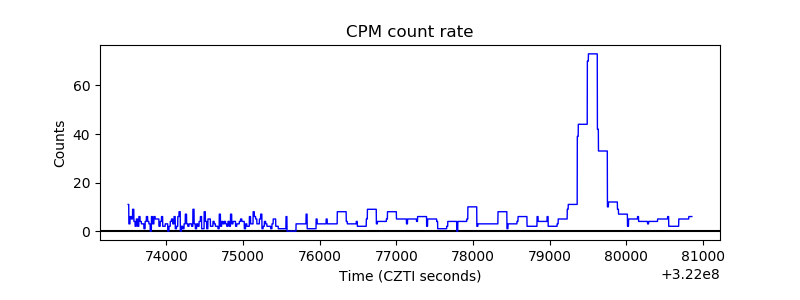 |
| CZT Counter | 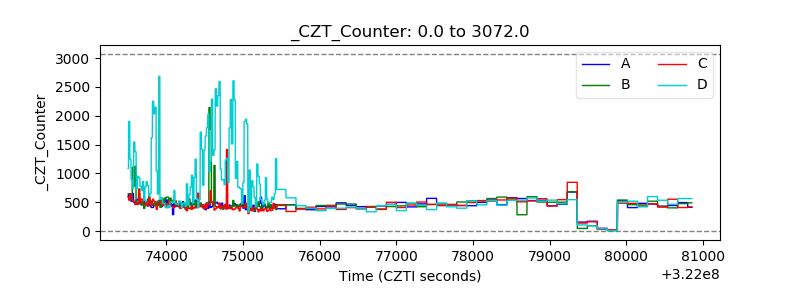 |
| +2.5 Volts monitor |  |
| +5 Volts monitor |  |
| _ROLL_ROT | 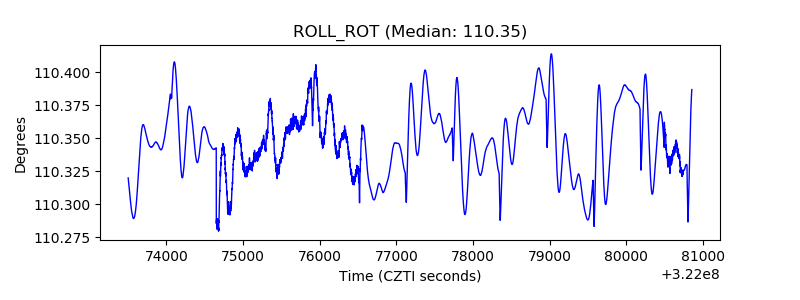 |
| _Roll_DEC | 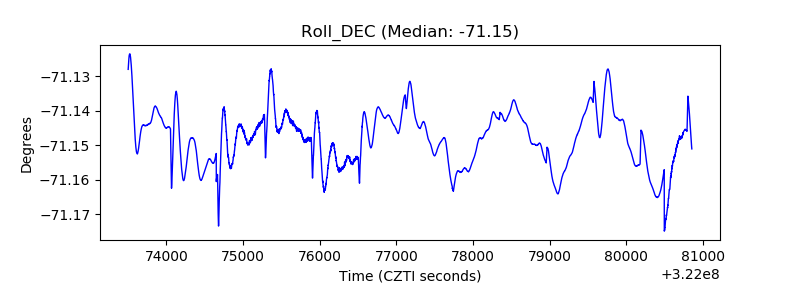 |
| _Roll_RA | 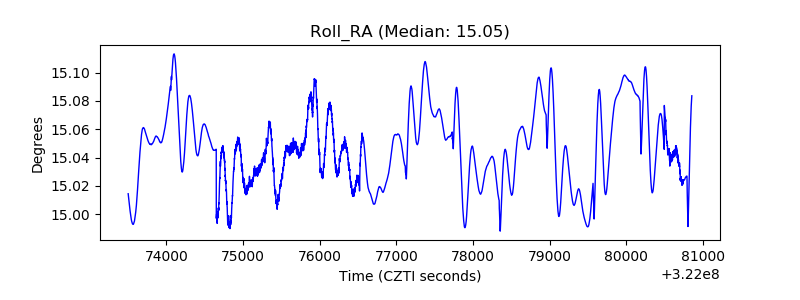 |
| Veto Counter | 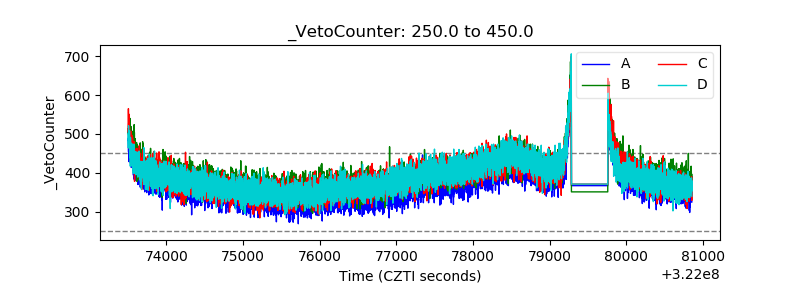 |