| Param | Original file | Final file |
|---|---|---|
| Filename | modeM0/AS1A07_047T02_9000003574_24157cztM0_level2.evt | modeM0/AS1A07_047T02_9000003574_24157cztM0_level2_quad_clean.evt |
| Size (bytes) | 52,652,160 | 15,091,200 |
| Size | 50.2 MB | 14.4 MB |
| Events in quadrant A | 364,346 | 100,105 |
| Events in quadrant B | 371,714 | 101,329 |
| Events in quadrant C | 382,580 | 95,754 |
| Events in quadrant D | 418,529 | 96,207 |
| Mode SS | |||
|---|---|---|---|
| Quadrant | BADHDUFLAG | Total packets | Discarded packets |
| A | 0 | 16 | 0 |
| B | 0 | 16 | 0 |
| C | 0 | 16 | 0 |
| D | 0 | 16 | 0 |
| Mode M0 | |||
|---|---|---|---|
| Quadrant | BADHDUFLAG | Total packets | Discarded packets |
| A | 0 | 1593 | 0 |
| B | 0 | 1603 | 0 |
| C | 0 | 1680 | 0 |
| D | 0 | 1749 | 0 |
| Quadrant | Total seconds | Saturated seconds | Saturation percentage |
|---|---|---|---|
| A | 794 | 1 | 0.125945% |
| B | 795 | 2 | 0.251572% |
| C | 795 | 6 | 0.754717% |
| D | 795 | 0 | 0.000000% |
Noise dominated data is calculated using 1-second bins in cleaned event files. If a bin has >2000 counts, and if more than 50% of those come from <1% of pixels, then it is considered to be noise-dominated and hence unusable.
| Quadrant | # 1 sec bins | Bins with >0 counts | Bins with >2000 counts | High rate bins dominated by noise | Noise dominated (total time) | Noise dominated (detector-on time) | Marked lightcurve |
|---|---|---|---|---|---|---|---|
| A | 794 | 794 | 0 | 0 | 0.00% | 0.00% | 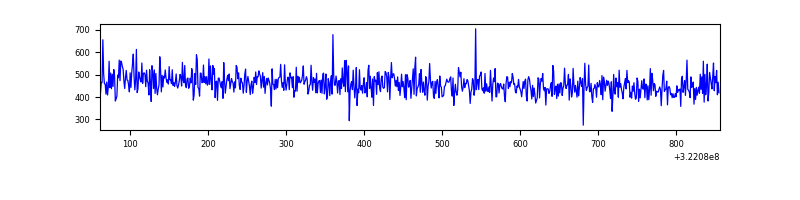 |
| B | 795 | 795 | 0 | 0 | 0.00% | 0.00% | 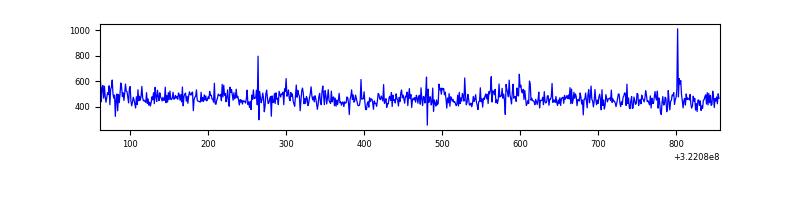 |
| C | 795 | 795 | 4 | 4 | 0.50% | 0.50% | 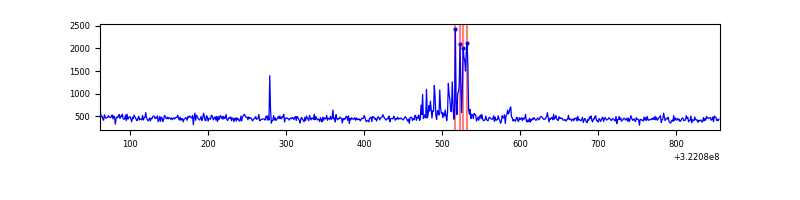 |
| D | 795 | 795 | 0 | 0 | 0.00% | 0.00% | 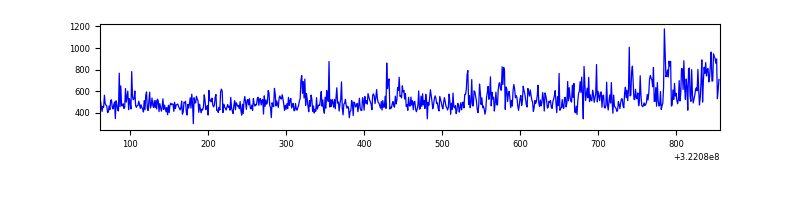 |
Top three noisy pixels from each quadrant. If the there are fewer than three noisy pixels in the level2.evt file, extra rows are filled as -1
| Pixel properties | Quadrant properties | ||||||
|---|---|---|---|---|---|---|---|
| Quadrant | DetID | PixID | Counts | Sigma | Mean | Median | Sigma |
| A | 13 | 254 | 1548 | 67.87 | 94 | 91 | 21.5 |
| A | 0 | 226 | 832 | 34.52 | 94 | 91 | 21.5 |
| A | 3 | 137 | 828 | 34.33 | 94 | 91 | 21.5 |
| B | 4 | 171 | 2672 | 126.29 | 93 | 91 | 20.4 |
| B | 12 | 111 | 2062 | 96.44 | 93 | 91 | 20.4 |
| B | 11 | 111 | 1680 | 77.75 | 93 | 91 | 20.4 |
| C | 0 | 207 | 32197 | 1480.43 | 85 | 86 | 21.7 |
| C | 14 | 238 | 13848 | 634.48 | 85 | 86 | 21.7 |
| C | 2 | 16 | 963 | 40.43 | 85 | 86 | 21.7 |
| D | 8 | 195 | 51394 | 2120.55 | 88 | 84 | 24.2 |
| D | 7 | 238 | 30155 | 1242.78 | 88 | 84 | 24.2 |
| D | 2 | 234 | 3715 | 150.06 | 88 | 84 | 24.2 |
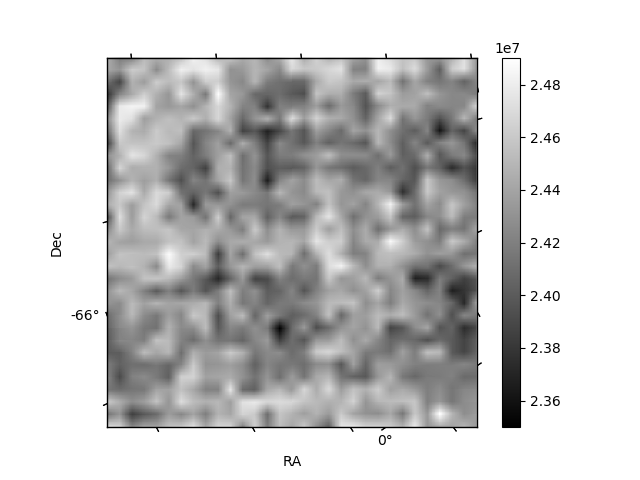
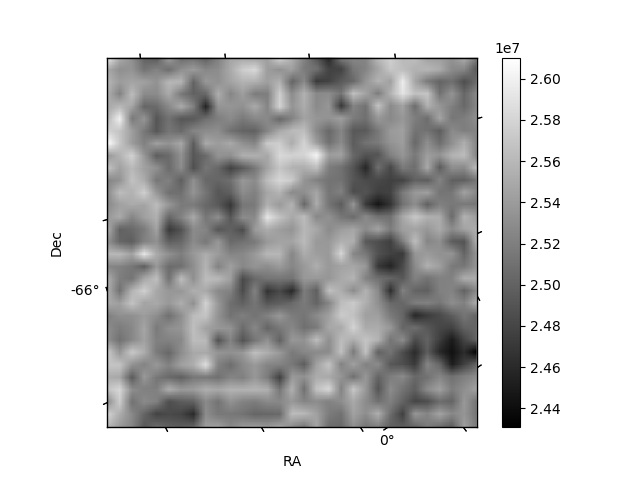
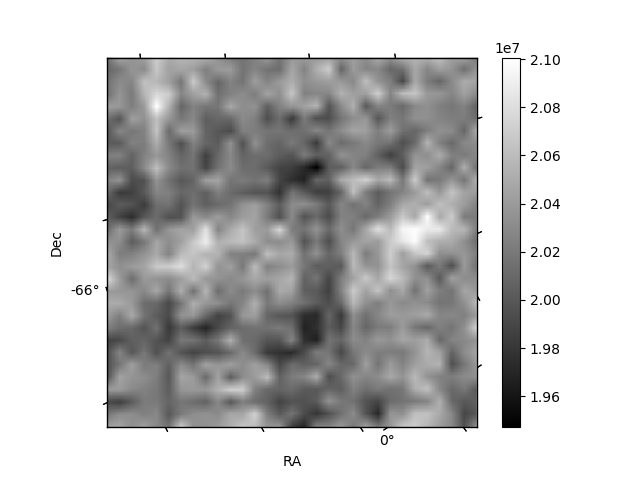
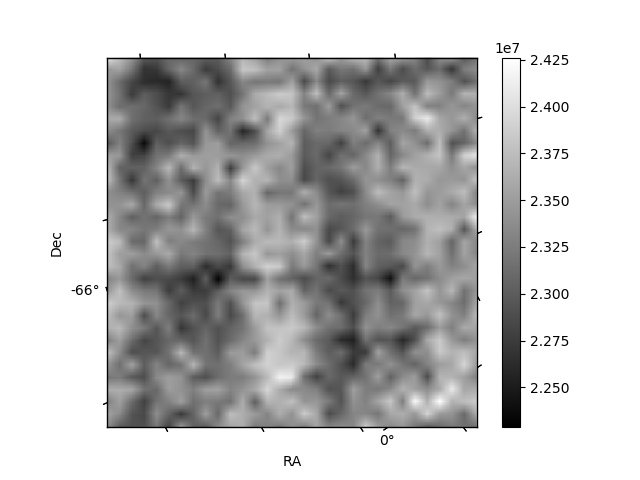
Histogram calculated using DETX and DETY for each event in the final _common_clean file
| Quadrant A | 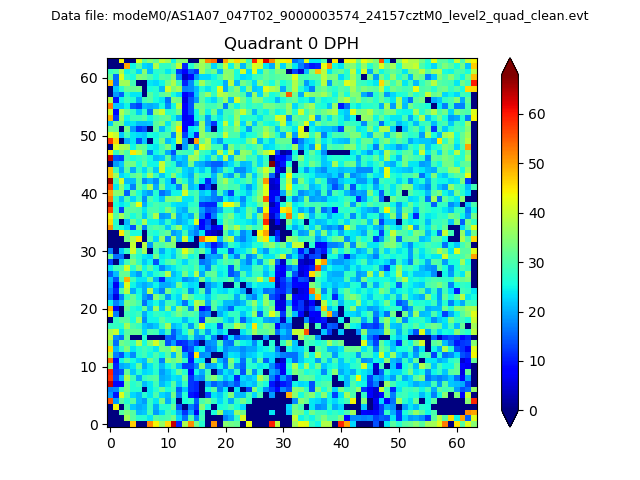 |
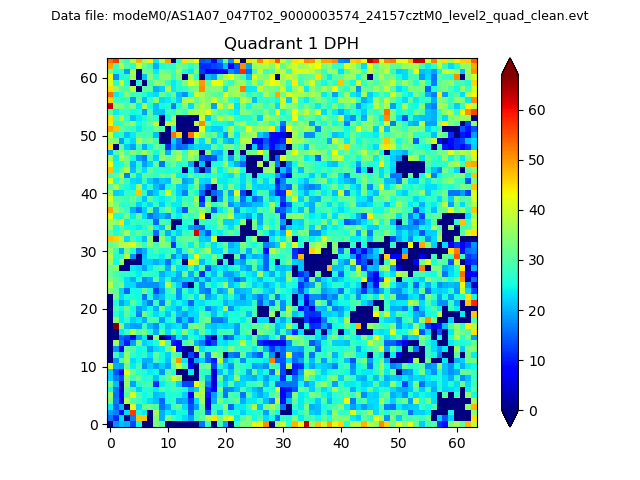 |
Quadrant B |
|---|---|---|---|
| Quadrant D | 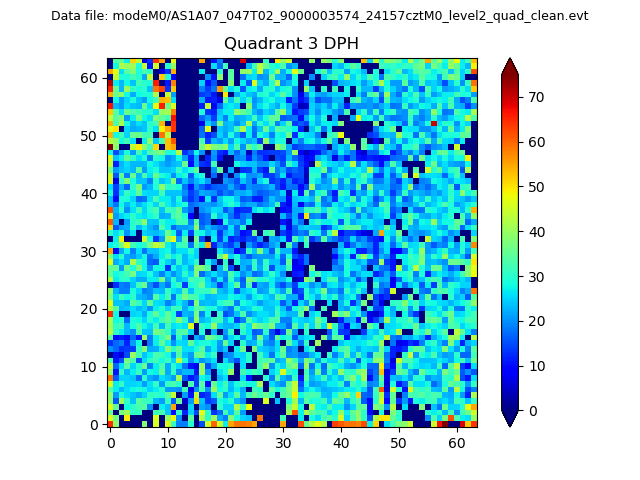 |
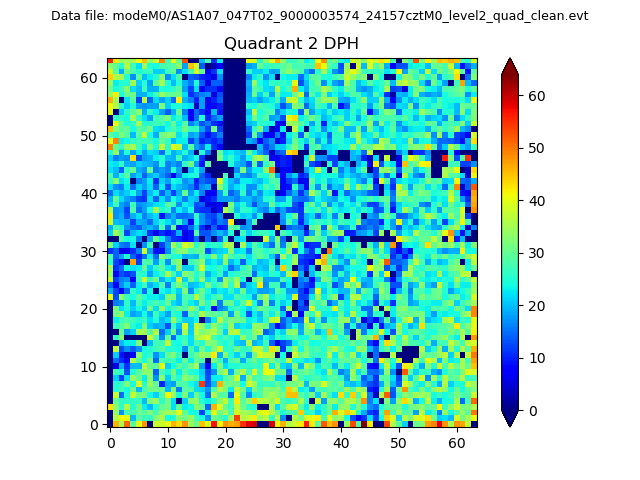 |
Quadrant C |
| Plot type | Count rate plots | Images |
|---|---|---|
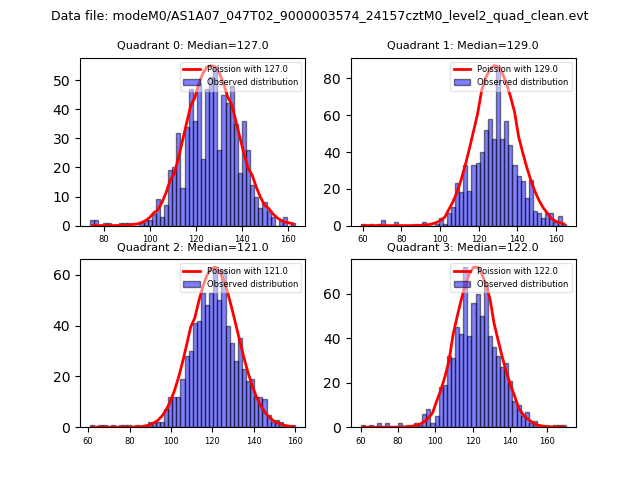
| Comparison with Poisson distribution Blue bars denote a histogram of data divided into 1 sec bins. Red curve is a Poisson curve with rate = median count rate of data. |
 |
 |
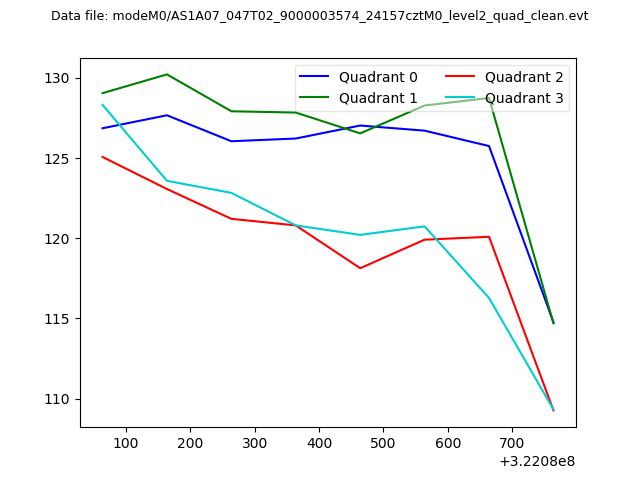
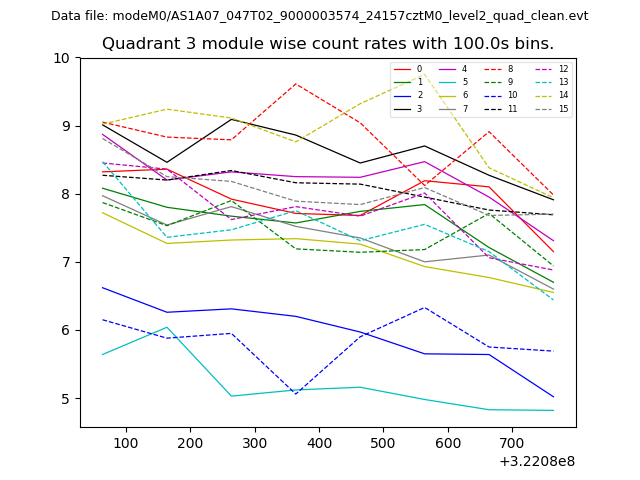
| Quadrant-wise count rates Data is divided into 100 sec bins |
 |
|
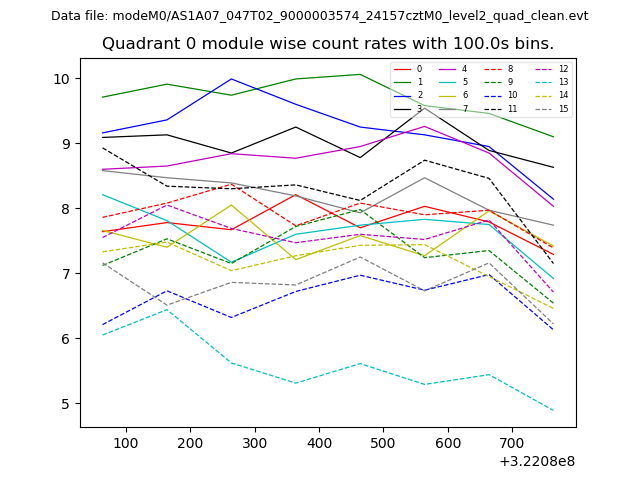
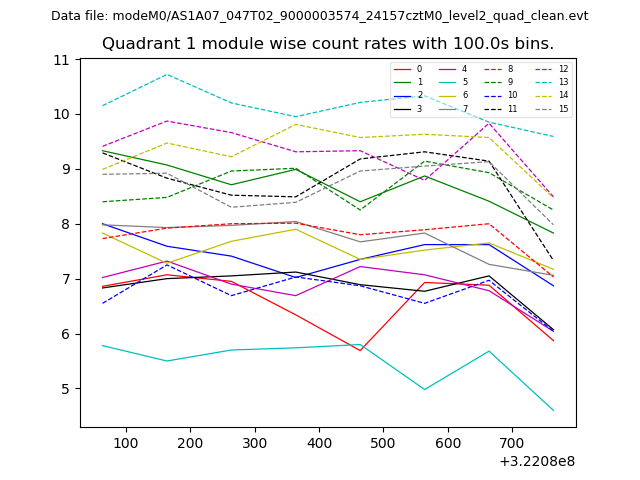
| Module-wise count rates for Quadrant A Data is divided into 100 sec bins |
 |
 |
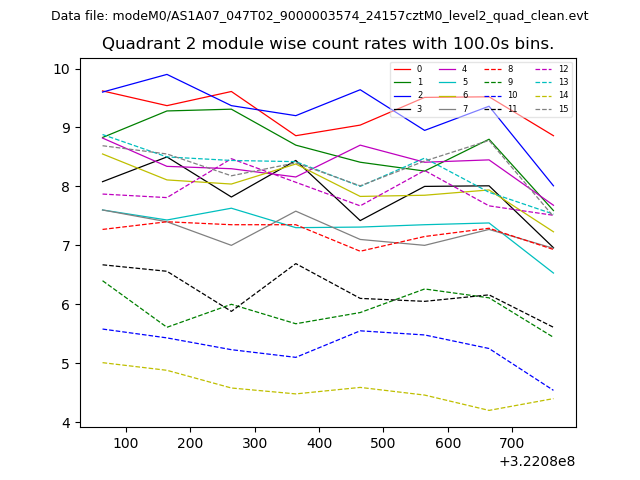
| Module-wise count rates for Quadrant B Data is divided into 100 sec bins |
 |
 |
| Module-wise count rates for Quadrant C Data is divided into 100 sec bins |
 |
 |
| Module-wise count rates for Quadrant D Data is divided into 100 sec bins |
 |
 |
| Parameter | Plot |
|---|---|
| CZT HV Monitor | 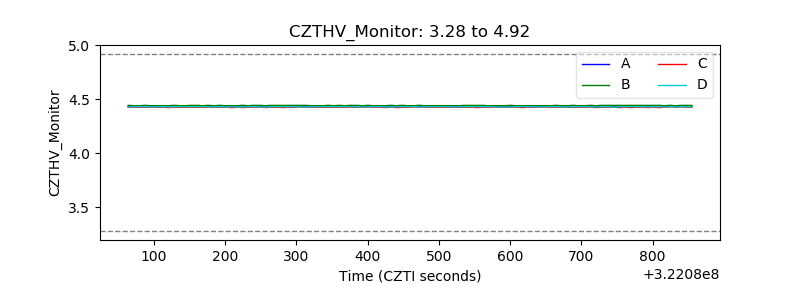 |
| D_VDD | 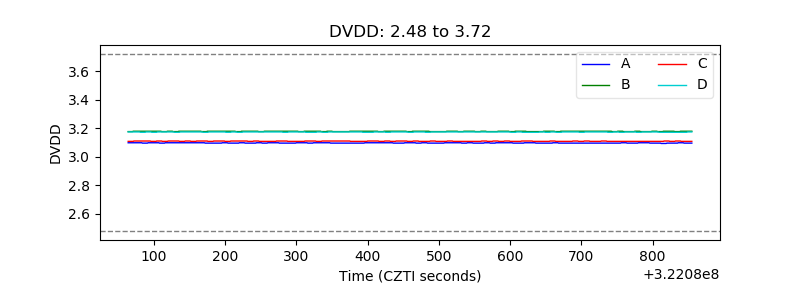 |
| Temperature 1 | 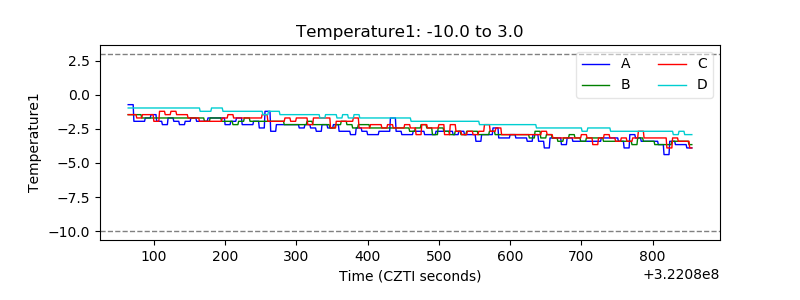 |
| Veto HV Monitor | 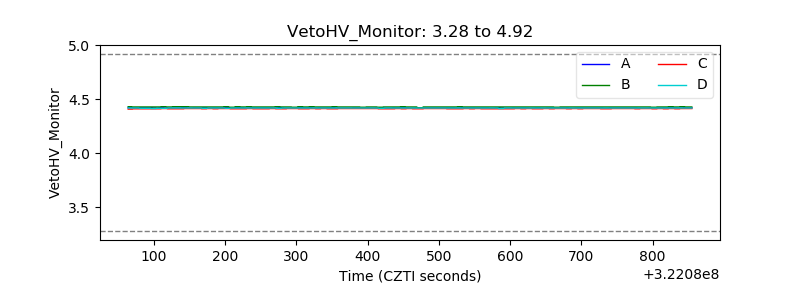 |
| Veto LLD | 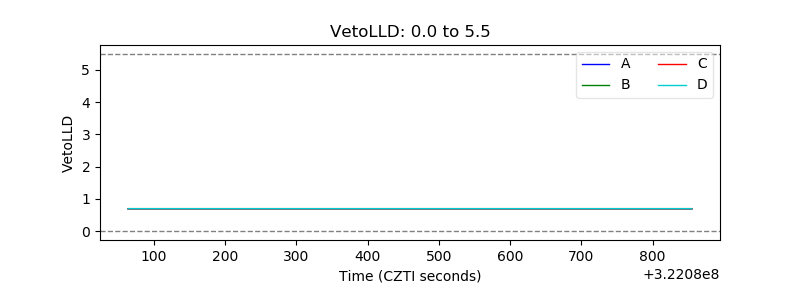 |
| Alpha Counter | 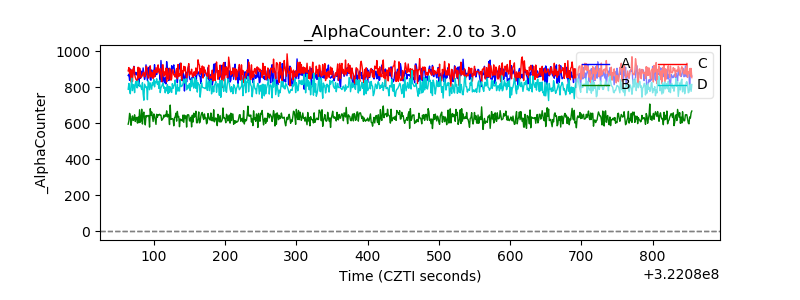 |
| _CPM_Rate | 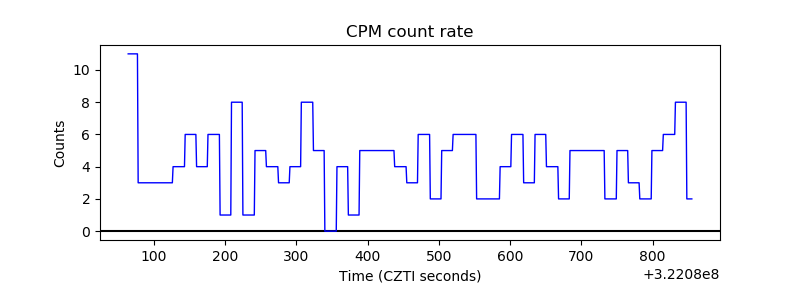 |
| CZT Counter | 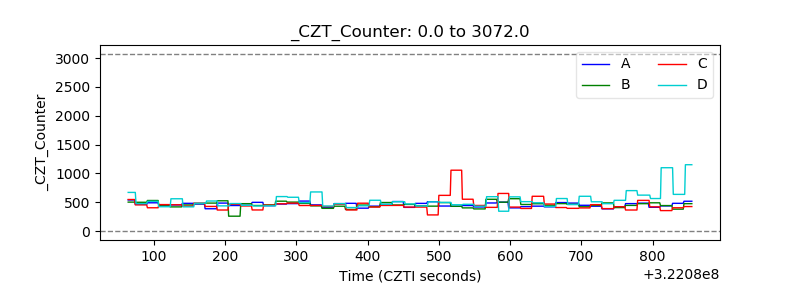 |
| +2.5 Volts monitor |  |
| +5 Volts monitor | 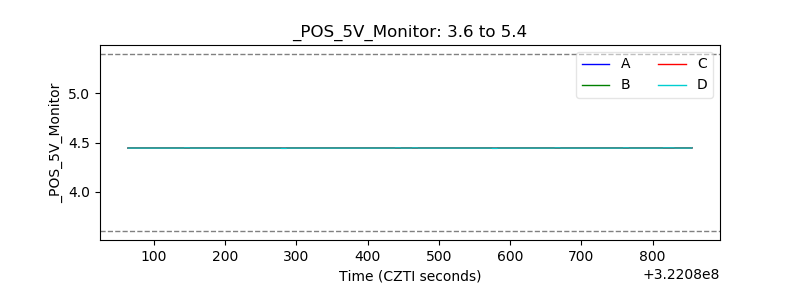 |
| _ROLL_ROT | 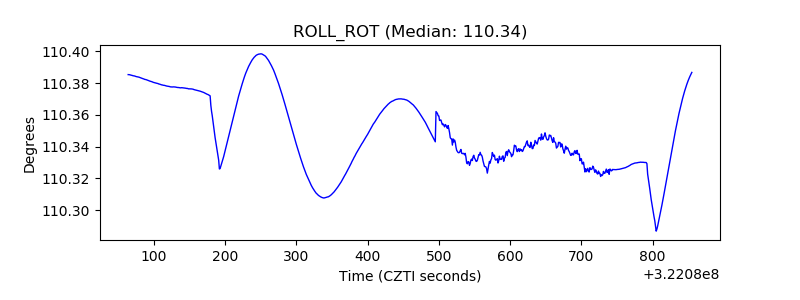 |
| _Roll_DEC | 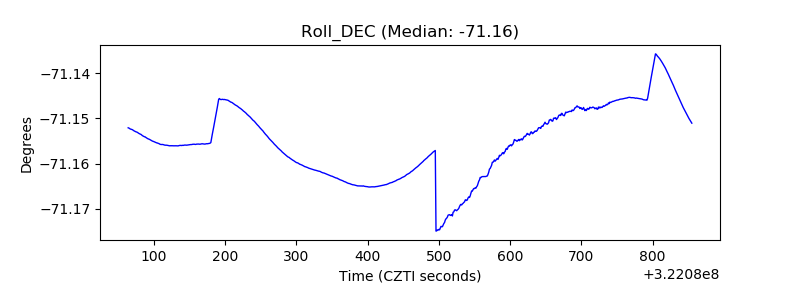 |
| _Roll_RA | 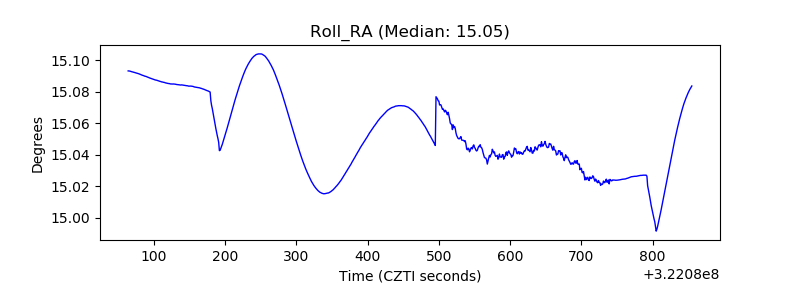 |
| Veto Counter | 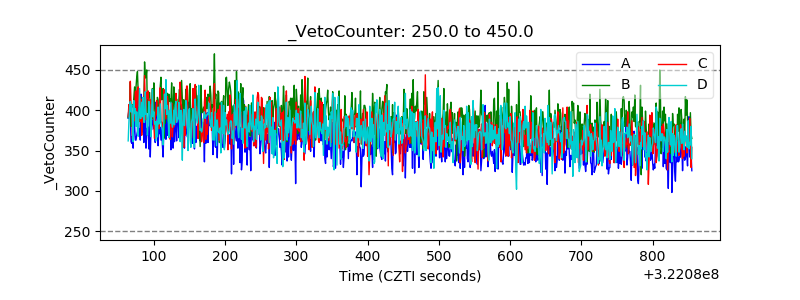 |