| Param | Original file | Final file |
|---|---|---|
| Filename | modeM0/AS1A07_047T06_9000003576cztM0_level2.fits | modeM0/AS1A07_047T06_9000003576cztM0_level2_quad_clean.evt |
| Size (bytes) | 370,843,200 | 345,597,120 |
| Size | 353.7 MB | 329.6 MB |
| Events in quadrant A | 2,334,334 | 2,115,342 |
| Events in quadrant B | 2,214,682 | 2,101,831 |
| Events in quadrant C | 2,250,520 | 1,974,588 |
| Events in quadrant D | 1,989,456 | 1,831,259 |
| Mode M9 | |||
|---|---|---|---|
| Quadrant | BADHDUFLAG | Total packets | Discarded packets |
| A | 0 | 65 | 0 |
| B | 0 | 65 | 0 |
| C | 0 | 65 | 0 |
| D | 0 | 65 | 0 |
| Mode SS | |||
|---|---|---|---|
| Quadrant | BADHDUFLAG | Total packets | Discarded packets |
| A | 0 | 726 | 0 |
| B | 0 | 726 | 0 |
| C | 0 | 726 | 0 |
| D | 0 | 726 | 0 |
| Mode M0 | |||
|---|---|---|---|
| Quadrant | BADHDUFLAG | Total packets | Discarded packets |
| A | 0 | 74273 | 0 |
| B | 0 | 76870 | 0 |
| C | 0 | 79436 | 0 |
| D | 0 | 91826 | 0 |
| Quadrant | Total seconds | Saturated seconds | Saturation percentage |
|---|---|---|---|
| A | 35548 | 233 | 0.655452% |
| B | 35548 | 483 | 1.358726% |
| C | 35548 | 712 | 2.002926% |
| D | 35548 | 918 | 2.582424% |
Noise dominated data is calculated using 1-second bins in cleaned event files. If a bin has >2000 counts, and if more than 50% of those come from <1% of pixels, then it is considered to be noise-dominated and hence unusable.
| Quadrant | # 1 sec bins | Bins with >0 counts | Bins with >2000 counts | High rate bins dominated by noise | Noise dominated (total time) | Noise dominated (detector-on time) | Marked lightcurve |
|---|---|---|---|---|---|---|---|
| A | 46538 | 35543 | 0 | 0 | 0.00% | 0.00% |  |
| B | 46538 | 35534 | 0 | 0 | 0.00% | 0.00% |  |
| C | 46538 | 35545 | 0 | 0 | 0.00% | 0.00% | 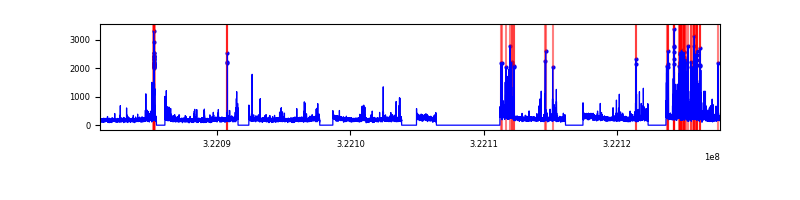 |
| D | 46538 | 35542 | 0 | 0 | 0.00% | 0.00% |  |
Top three noisy pixels from each quadrant. If the there are fewer than three noisy pixels in the level2.evt file, extra rows are filled as -1
| Pixel properties | Quadrant properties | ||||||
|---|---|---|---|---|---|---|---|
| Quadrant | DetID | PixID | Counts | Sigma | Mean | Median | Sigma |
| A | 0 | 29 | 2167 | 10.64 | 608 | 575 | 149.6 |
| A | 7 | 110 | 1852 | 8.54 | 608 | 575 | 149.6 |
| A | 9 | 19 | 1758 | 7.91 | 608 | 575 | 149.6 |
| B | 2 | 9 | 1760 | 10.39 | 586 | 562 | 115.3 |
| B | 2 | 8 | 1482 | 7.98 | 586 | 562 | 115.3 |
| B | 3 | 80 | 1478 | 7.94 | 586 | 562 | 115.3 |
| C | 1 | 80 | 1793 | 8.24 | 595 | 563 | 149.2 |
| C | 1 | 81 | 1791 | 8.23 | 595 | 563 | 149.2 |
| C | 12 | 241 | 1534 | 6.51 | 595 | 563 | 149.2 |
| D | 4 | 246 | 1438 | 6.17 | 566 | 520 | 148.8 |
| D | 6 | 67 | 1435 | 6.15 | 566 | 520 | 148.8 |
| D | 7 | 3 | 1392 | 5.86 | 566 | 520 | 148.8 |
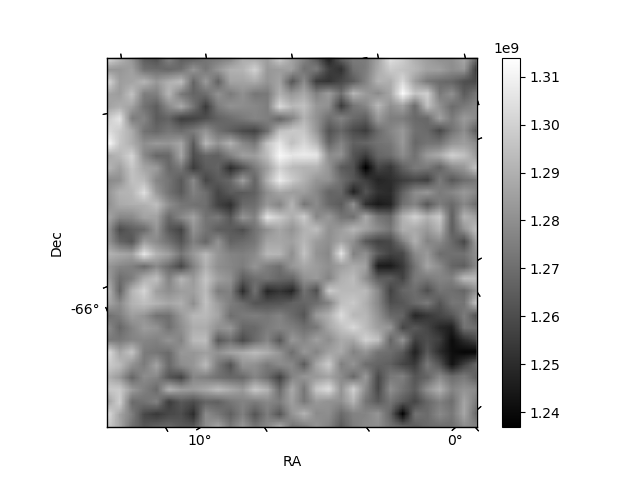
Histogram calculated using DETX and DETY for each event in the final _common_clean file
| Quadrant A | 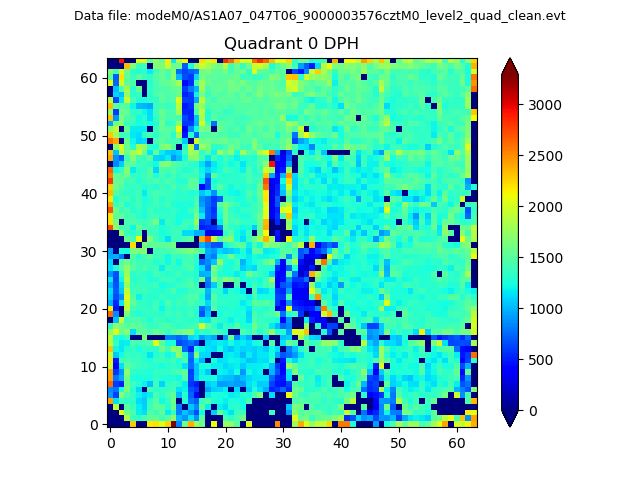 |
 |
Quadrant B |
|---|---|---|---|
| Quadrant D |  |
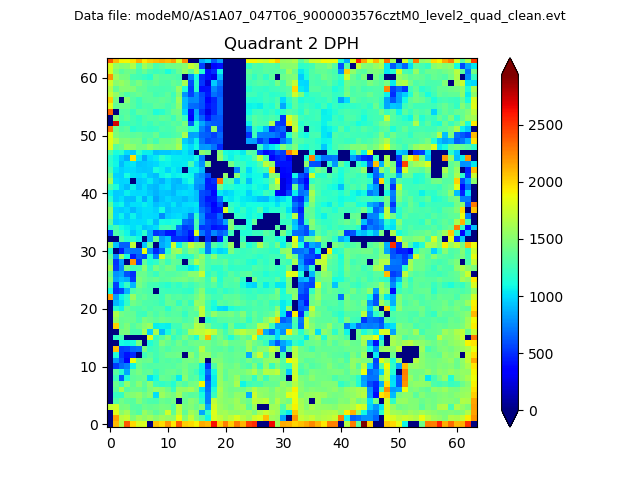 |
Quadrant C |
| Plot type | Count rate plots | Images |
|---|---|---|
| Comparison with Poisson distribution Blue bars denote a histogram of data divided into 1 sec bins. Red curve is a Poisson curve with rate = median count rate of data. |
 |
 |
| Quadrant-wise count rates Data is divided into 100 sec bins |
 |
|
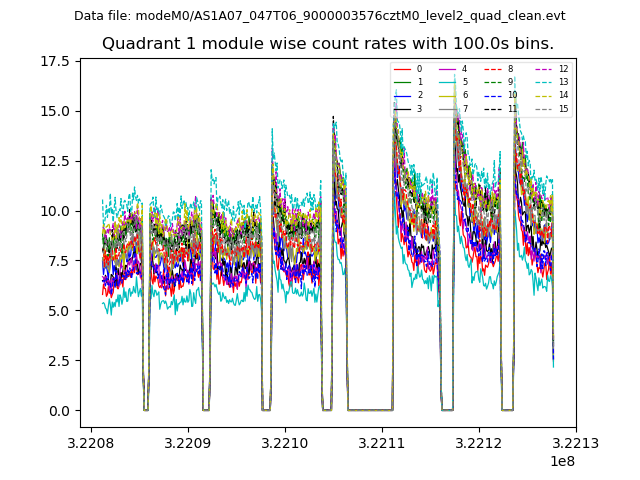
| Module-wise count rates for Quadrant A Data is divided into 100 sec bins |
 |
 |
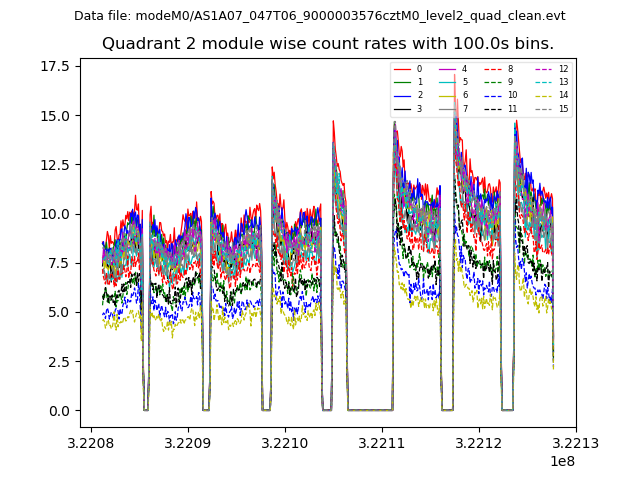
| Module-wise count rates for Quadrant B Data is divided into 100 sec bins |
 |
 |
| Module-wise count rates for Quadrant C Data is divided into 100 sec bins |
 |
 |
| Module-wise count rates for Quadrant D Data is divided into 100 sec bins |
 |
 |
| Parameter | Plot |
|---|---|
| CZT HV Monitor |  |
| D_VDD |  |
| Temperature 1 | 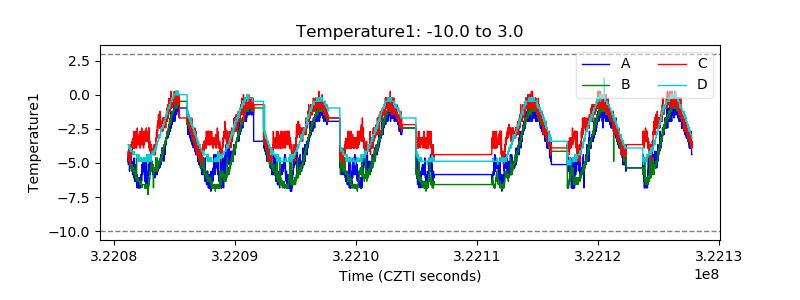 |
| Veto HV Monitor | 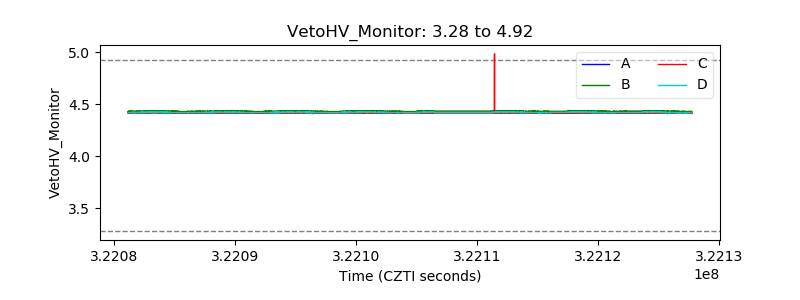 |
| Veto LLD |  |
| Alpha Counter | 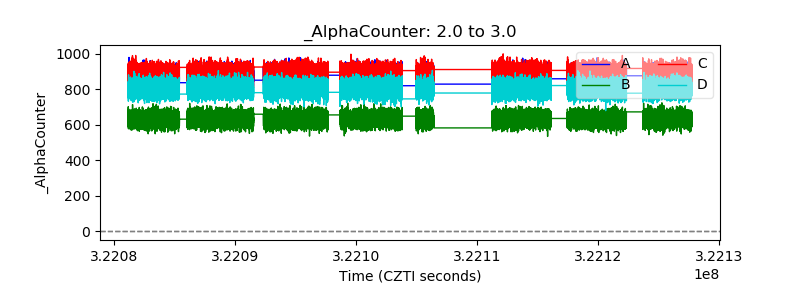 |
| _CPM_Rate |  |
| CZT Counter | 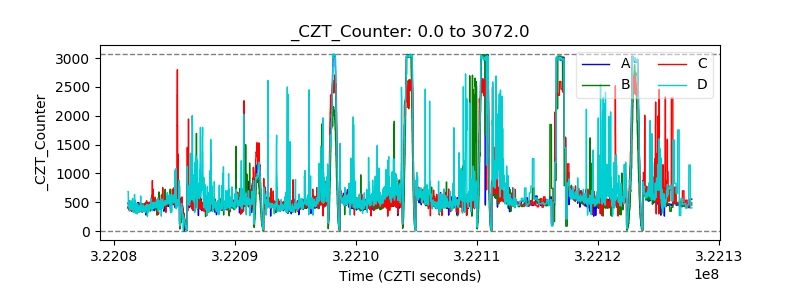 |
| +2.5 Volts monitor |  |
| +5 Volts monitor |  |
| _ROLL_ROT |  |
| _Roll_DEC | 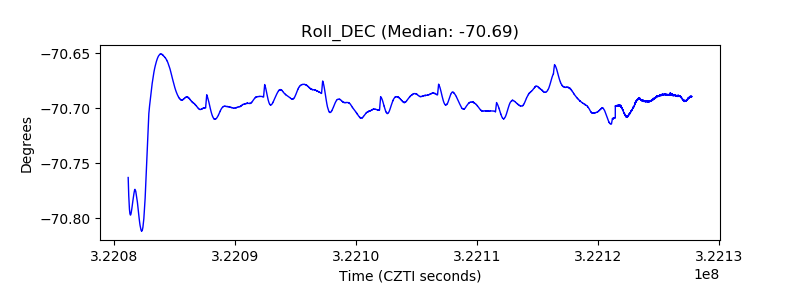 |
| _Roll_RA |  |
| Veto Counter |  |