| Param | Original file | Final file |
|---|---|---|
| Filename | modeM0/AS1A07_047T06_9000003576_24152cztM0_level2.evt | modeM0/AS1A07_047T06_9000003576_24152cztM0_level2_quad_clean.evt |
| Size (bytes) | 757,048,320 | 209,698,560 |
| Size | 722.0 MB | 200.0 MB |
| Events in quadrant A | 5,152,214 | 1,437,862 |
| Events in quadrant B | 5,370,345 | 1,443,350 |
| Events in quadrant C | 5,435,035 | 1,351,981 |
| Events in quadrant D | 6,211,988 | 1,344,816 |
| Mode M9 | |||
|---|---|---|---|
| Quadrant | BADHDUFLAG | Total packets | Discarded packets |
| A | 0 | 14 | 0 |
| B | 0 | 14 | 0 |
| C | 0 | 14 | 0 |
| D | 0 | 14 | 0 |
| Mode SS | |||
|---|---|---|---|
| Quadrant | BADHDUFLAG | Total packets | Discarded packets |
| A | 0 | 228 | 0 |
| B | 0 | 228 | 0 |
| C | 0 | 228 | 0 |
| D | 0 | 228 | 0 |
| Mode M0 | |||
|---|---|---|---|
| Quadrant | BADHDUFLAG | Total packets | Discarded packets |
| A | 0 | 22745 | 3 |
| B | 0 | 23147 | 2 |
| C | 0 | 23414 | 2 |
| D | 0 | 25962 | 2 |
| Quadrant | Total seconds | Saturated seconds | Saturation percentage |
|---|---|---|---|
| A | 11179 | 84 | 0.751409% |
| B | 11179 | 97 | 0.867698% |
| C | 11179 | 156 | 1.395474% |
| D | 11179 | 138 | 1.234457% |
Noise dominated data is calculated using 1-second bins in cleaned event files. If a bin has >2000 counts, and if more than 50% of those come from <1% of pixels, then it is considered to be noise-dominated and hence unusable.
| Quadrant | # 1 sec bins | Bins with >0 counts | Bins with >2000 counts | High rate bins dominated by noise | Noise dominated (total time) | Noise dominated (detector-on time) | Marked lightcurve |
|---|---|---|---|---|---|---|---|
| A | 12634 | 11179 | 0 | 0 | 0.00% | 0.00% | 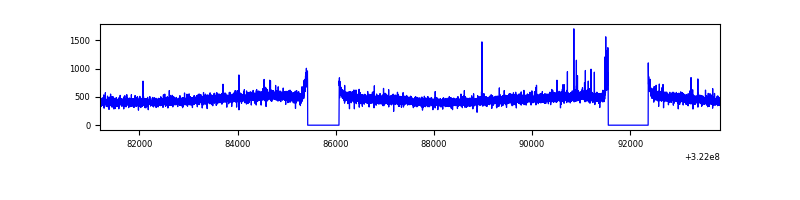 |
| B | 12634 | 11179 | 4 | 4 | 0.03% | 0.04% | 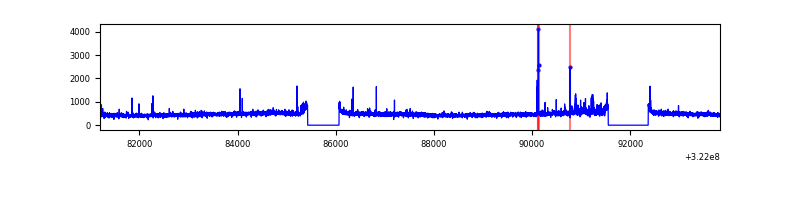 |
| C | 12634 | 11180 | 41 | 41 | 0.32% | 0.37% | 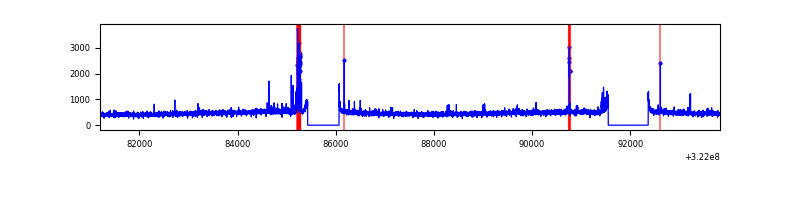 |
| D | 12634 | 11180 | 75 | 75 | 0.59% | 0.67% | 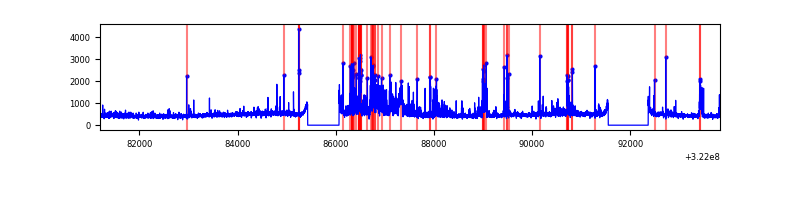 |
Top three noisy pixels from each quadrant. If the there are fewer than three noisy pixels in the level2.evt file, extra rows are filled as -1
| Pixel properties | Quadrant properties | ||||||
|---|---|---|---|---|---|---|---|
| Quadrant | DetID | PixID | Counts | Sigma | Mean | Median | Sigma |
| A | 13 | 254 | 20609 | 71.95 | 1330 | 1301 | 268.4 |
| A | 6 | 16 | 17635 | 60.86 | 1330 | 1301 | 268.4 |
| A | 3 | 137 | 11960 | 39.72 | 1330 | 1301 | 268.4 |
| B | 0 | 189 | 66783 | 259.89 | 1323 | 1289 | 252.0 |
| B | 4 | 216 | 33192 | 126.59 | 1323 | 1289 | 252.0 |
| B | 12 | 111 | 30368 | 115.39 | 1323 | 1289 | 252.0 |
| C | 14 | 238 | 202732 | 688.4 | 1262 | 1270 | 292.7 |
| C | 0 | 207 | 136876 | 463.37 | 1262 | 1270 | 292.7 |
| C | 7 | 247 | 79140 | 266.08 | 1262 | 1270 | 292.7 |
| D | 7 | 238 | 1095878 | 3533.26 | 1287 | 1248 | 309.8 |
| D | 8 | 195 | 134535 | 430.23 | 1287 | 1248 | 309.8 |
| D | 2 | 234 | 51578 | 162.46 | 1287 | 1248 | 309.8 |
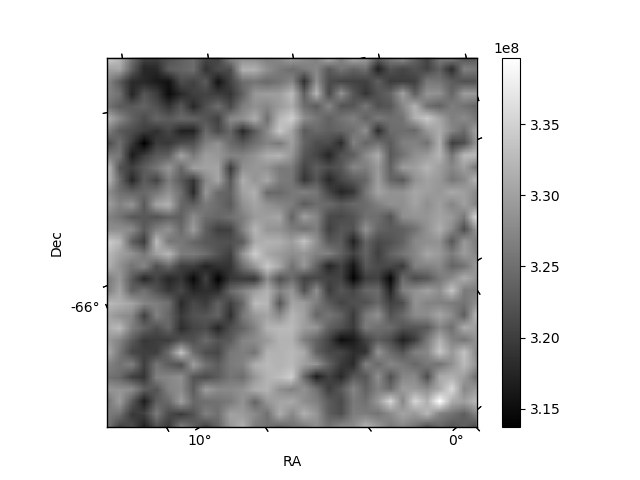
Histogram calculated using DETX and DETY for each event in the final _common_clean file
| Quadrant A |  |
 |
Quadrant B |
|---|---|---|---|
| Quadrant D |  |
 |
Quadrant C |
| Plot type | Count rate plots | Images |
|---|---|---|
| Comparison with Poisson distribution Blue bars denote a histogram of data divided into 1 sec bins. Red curve is a Poisson curve with rate = median count rate of data. |
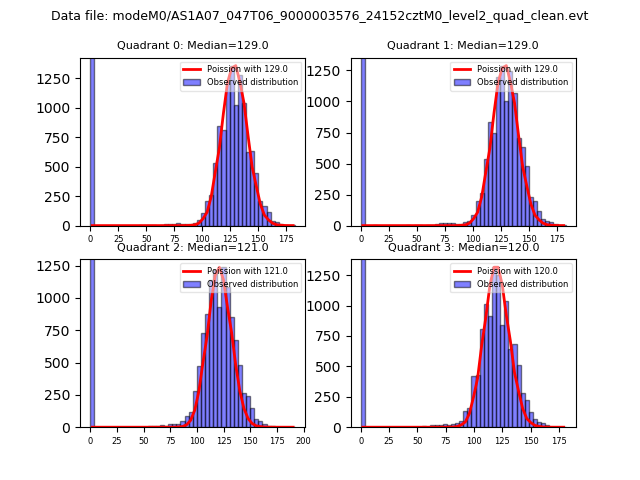 |
 |
| Quadrant-wise count rates Data is divided into 100 sec bins |
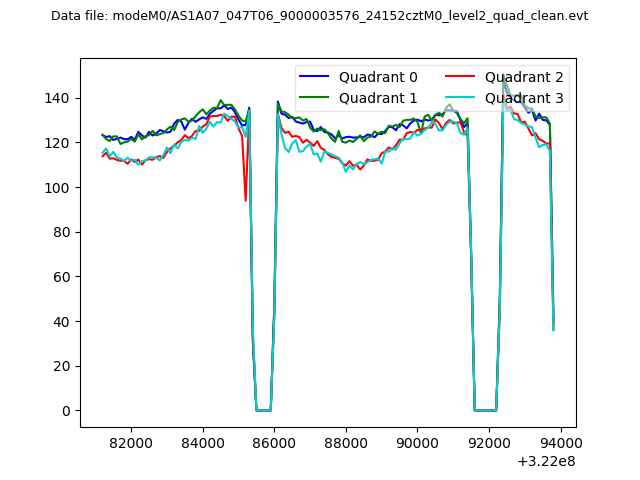 |
|
| Module-wise count rates for Quadrant A Data is divided into 100 sec bins |
 |
 |
| Module-wise count rates for Quadrant B Data is divided into 100 sec bins |
 |
 |
| Module-wise count rates for Quadrant C Data is divided into 100 sec bins |
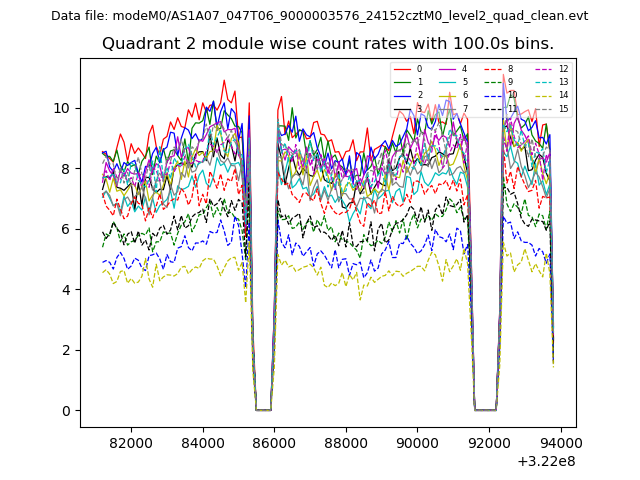 |
 |
| Module-wise count rates for Quadrant D Data is divided into 100 sec bins |
 |
 |
| Parameter | Plot |
|---|---|
| CZT HV Monitor | 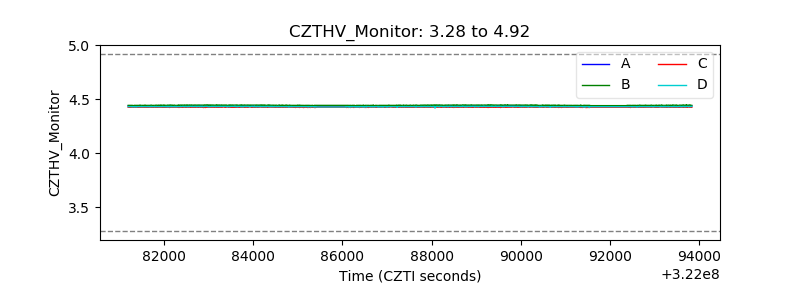 |
| D_VDD |  |
| Temperature 1 |  |
| Veto HV Monitor |  |
| Veto LLD |  |
| Alpha Counter | 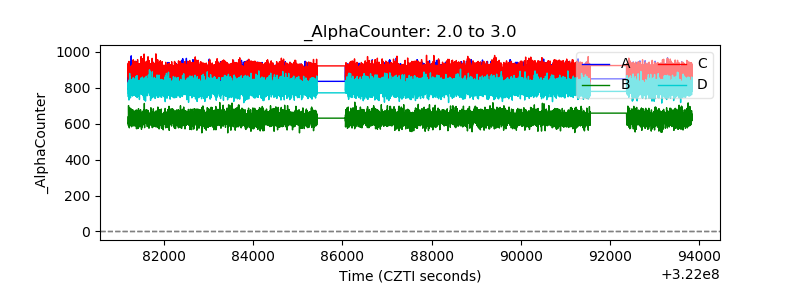 |
| _CPM_Rate | 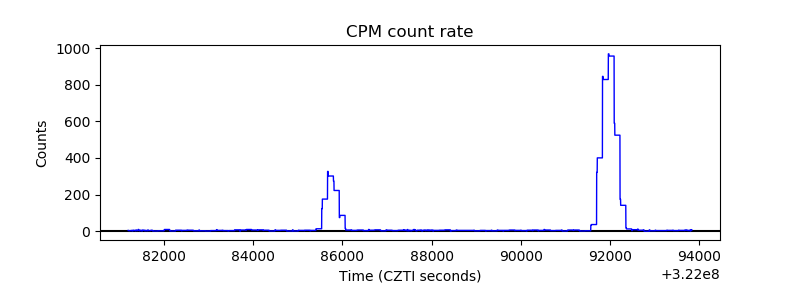 |
| CZT Counter |  |
| +2.5 Volts monitor |  |
| +5 Volts monitor |  |
| _ROLL_ROT |  |
| _Roll_DEC |  |
| _Roll_RA |  |
| Veto Counter |  |