| Param | Original file | Final file |
|---|---|---|
| Filename | modeM0/AS1A07_047T06_9000003576_24155cztM0_level2.evt | modeM0/AS1A07_047T06_9000003576_24155cztM0_level2_quad_clean.evt |
| Size (bytes) | 491,607,360 | 136,831,680 |
| Size | 468.8 MB | 130.5 MB |
| Events in quadrant A | 3,249,010 | 940,920 |
| Events in quadrant B | 3,372,399 | 957,854 |
| Events in quadrant C | 3,407,761 | 903,500 |
| Events in quadrant D | 4,409,679 | 880,545 |
| Mode M9 | |||
|---|---|---|---|
| Quadrant | BADHDUFLAG | Total packets | Discarded packets |
| A | 0 | 20 | 0 |
| B | 0 | 20 | 0 |
| C | 0 | 20 | 0 |
| D | 0 | 20 | 0 |
| Mode SS | |||
|---|---|---|---|
| Quadrant | BADHDUFLAG | Total packets | Discarded packets |
| A | 0 | 138 | 0 |
| B | 0 | 138 | 0 |
| C | 0 | 138 | 0 |
| D | 0 | 138 | 0 |
| Mode M0 | |||
|---|---|---|---|
| Quadrant | BADHDUFLAG | Total packets | Discarded packets |
| A | 0 | 13821 | 2 |
| B | 0 | 14219 | 2 |
| C | 0 | 14263 | 2 |
| D | 0 | 17530 | 2 |
| Quadrant | Total seconds | Saturated seconds | Saturation percentage |
|---|---|---|---|
| A | 6616 | 63 | 0.952237% |
| B | 6617 | 98 | 1.481034% |
| C | 6617 | 109 | 1.647272% |
| D | 6617 | 170 | 2.569140% |
Noise dominated data is calculated using 1-second bins in cleaned event files. If a bin has >2000 counts, and if more than 50% of those come from <1% of pixels, then it is considered to be noise-dominated and hence unusable.
| Quadrant | # 1 sec bins | Bins with >0 counts | Bins with >2000 counts | High rate bins dominated by noise | Noise dominated (total time) | Noise dominated (detector-on time) | Marked lightcurve |
|---|---|---|---|---|---|---|---|
| A | 8721 | 6616 | 0 | 0 | 0.00% | 0.00% | 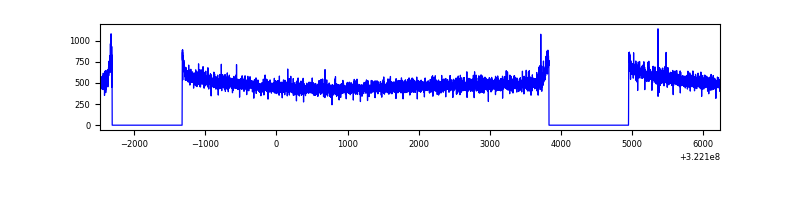 |
| B | 8722 | 6618 | 14 | 14 | 0.16% | 0.21% | 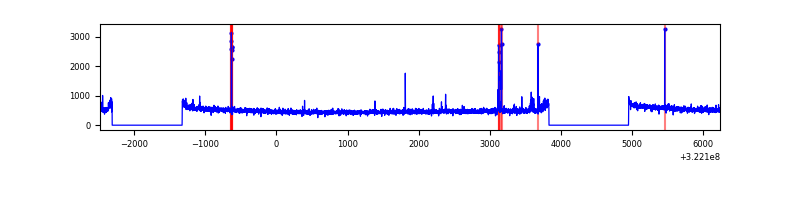 |
| C | 8722 | 6617 | 3 | 3 | 0.03% | 0.05% | 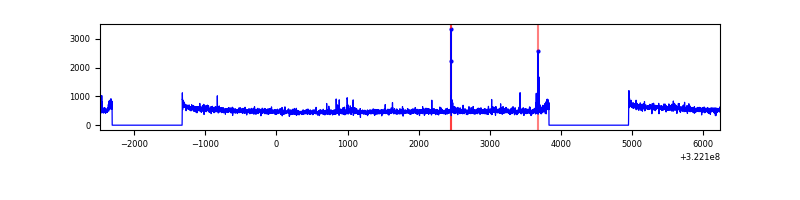 |
| D | 8722 | 6617 | 79 | 79 | 0.91% | 1.19% | 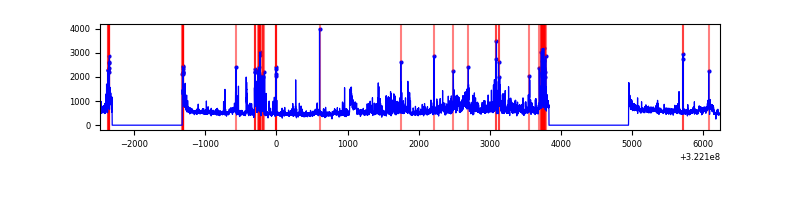 |
Top three noisy pixels from each quadrant. If the there are fewer than three noisy pixels in the level2.evt file, extra rows are filled as -1
| Pixel properties | Quadrant properties | ||||||
|---|---|---|---|---|---|---|---|
| Quadrant | DetID | PixID | Counts | Sigma | Mean | Median | Sigma |
| A | 13 | 254 | 11149 | 61.44 | 843 | 825 | 168.0 |
| A | 0 | 226 | 7140 | 37.58 | 843 | 825 | 168.0 |
| A | 3 | 137 | 7084 | 37.25 | 843 | 825 | 168.0 |
| B | 5 | 172 | 51132 | 321.5 | 841 | 820 | 156.5 |
| B | 0 | 189 | 23886 | 147.39 | 841 | 820 | 156.5 |
| B | 12 | 111 | 18311 | 111.77 | 841 | 820 | 156.5 |
| C | 14 | 238 | 131544 | 700.85 | 810 | 815 | 186.5 |
| C | 3 | 233 | 44108 | 232.1 | 810 | 815 | 186.5 |
| C | 0 | 207 | 22703 | 117.34 | 810 | 815 | 186.5 |
| D | 7 | 238 | 721636 | 3648.11 | 816 | 792 | 197.6 |
| D | 8 | 195 | 354901 | 1792.1 | 816 | 792 | 197.6 |
| D | 1 | 52 | 190002 | 957.57 | 816 | 792 | 197.6 |
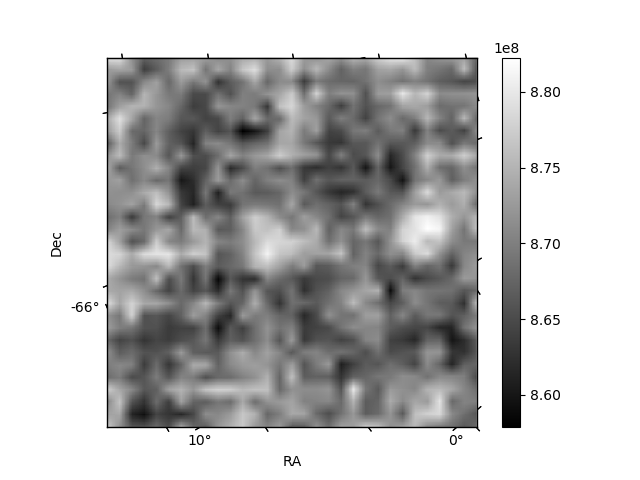
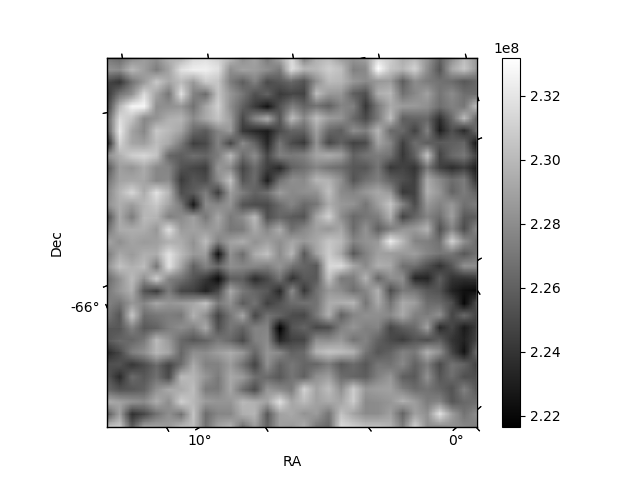
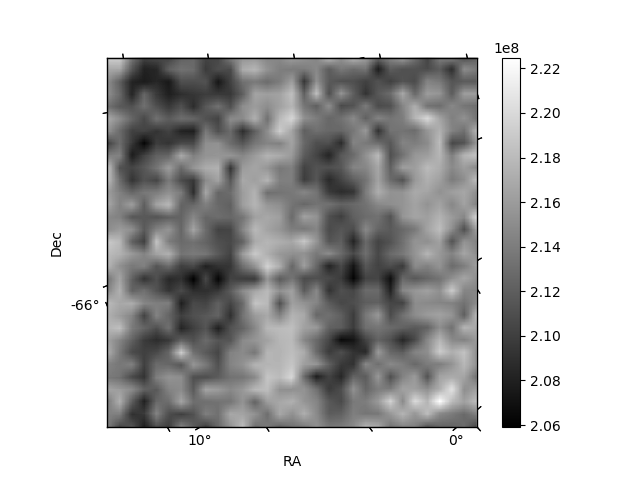
Histogram calculated using DETX and DETY for each event in the final _common_clean file
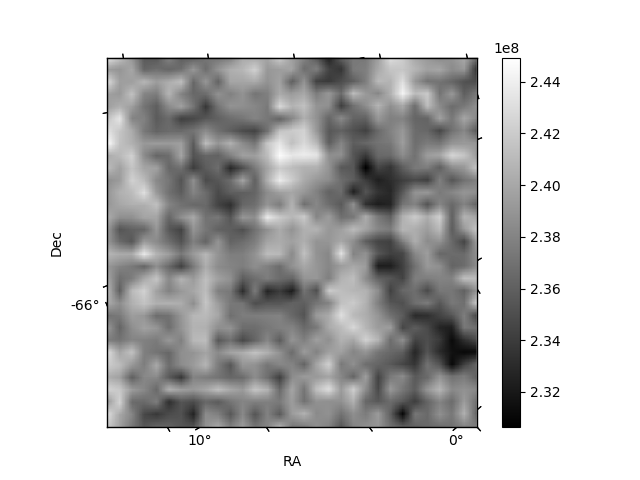
| Quadrant A | 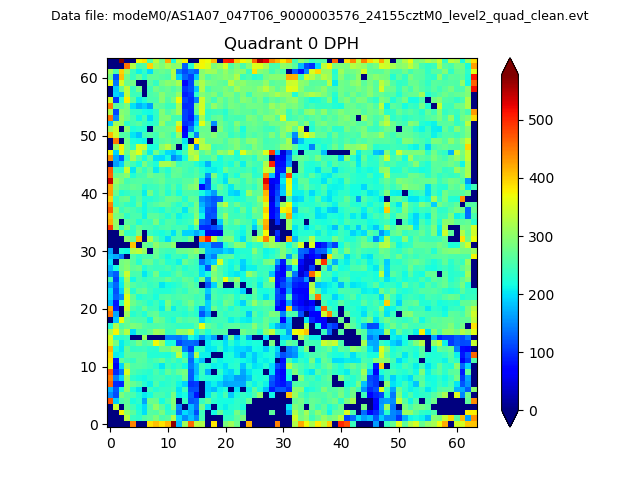 |
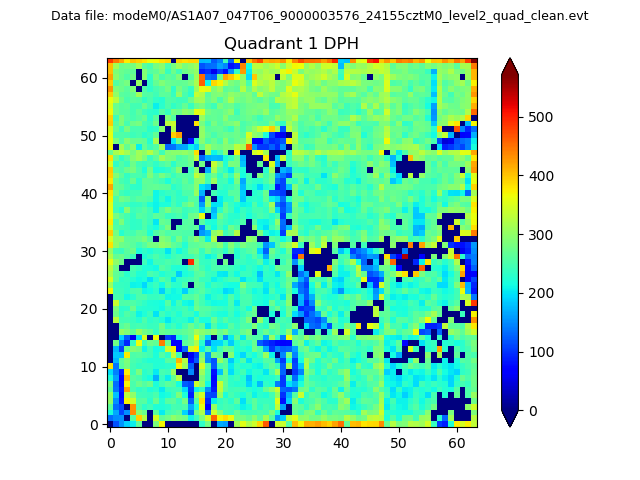 |
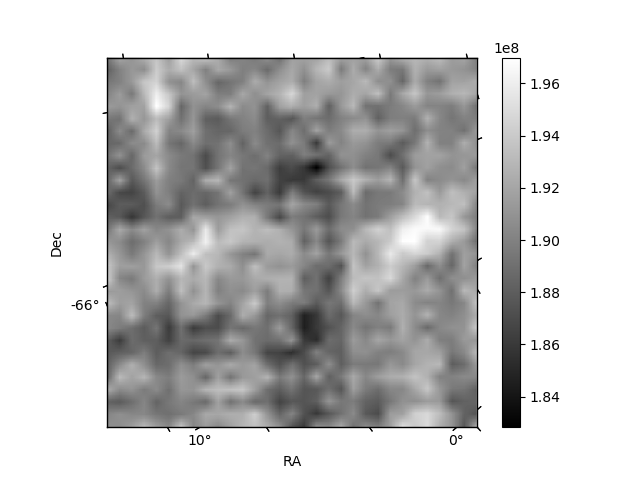
Quadrant B |
|---|---|---|---|
| Quadrant D | 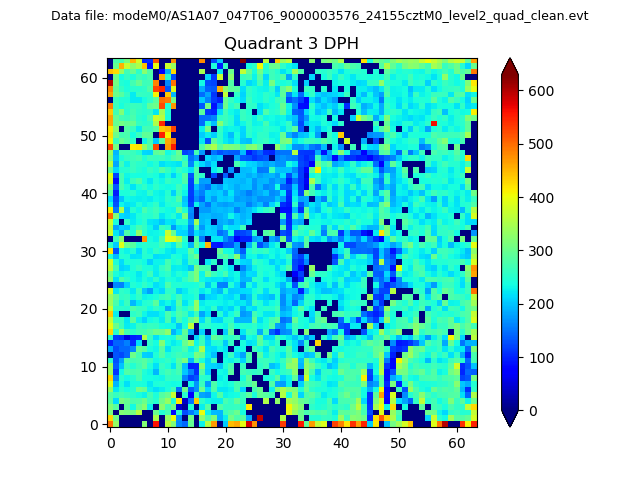 |
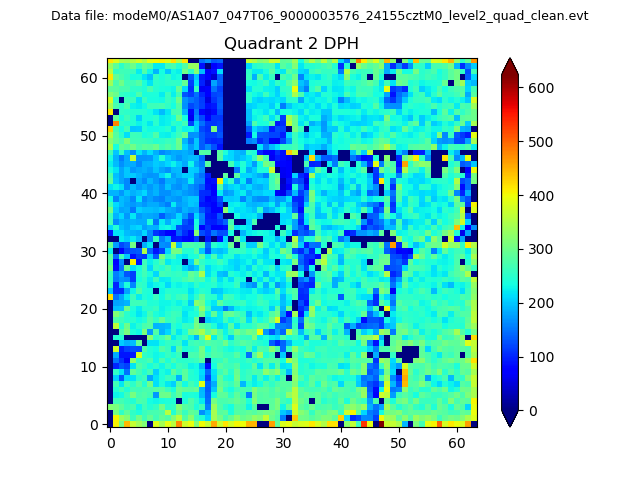 |
Quadrant C |
| Plot type | Count rate plots | Images |
|---|---|---|
| Comparison with Poisson distribution Blue bars denote a histogram of data divided into 1 sec bins. Red curve is a Poisson curve with rate = median count rate of data. |
 |
 |
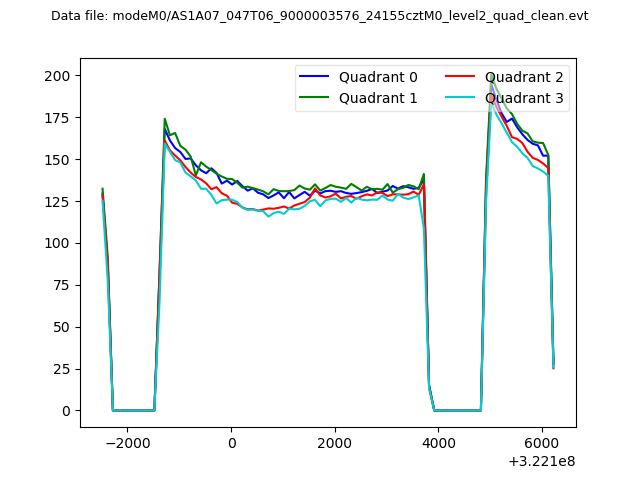
| Quadrant-wise count rates Data is divided into 100 sec bins |
 |
|
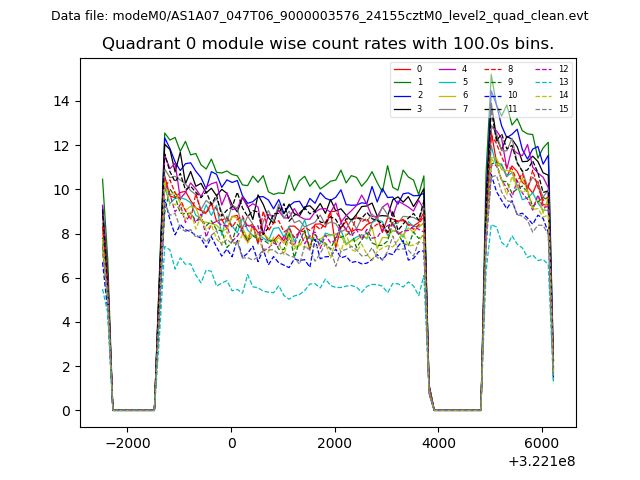
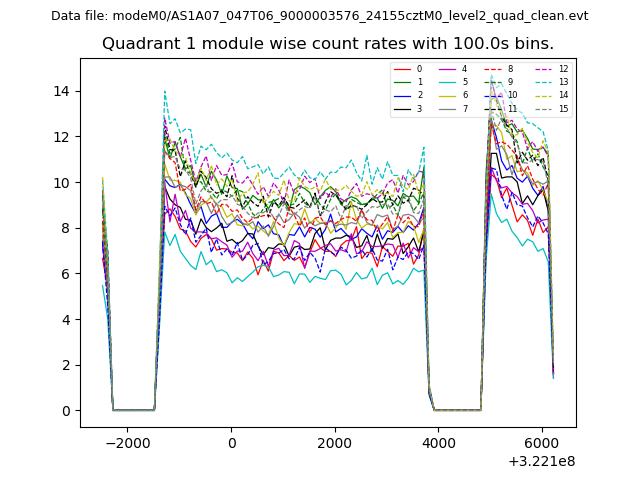
| Module-wise count rates for Quadrant A Data is divided into 100 sec bins |
 |
 |
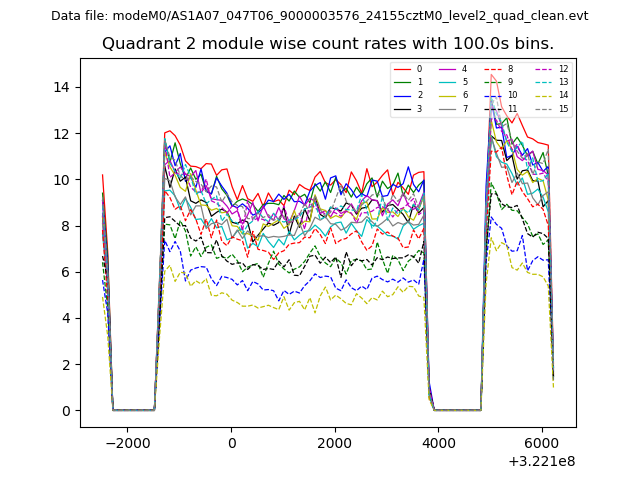
| Module-wise count rates for Quadrant B Data is divided into 100 sec bins |
 |
 |
| Module-wise count rates for Quadrant C Data is divided into 100 sec bins |
 |
 |
| Module-wise count rates for Quadrant D Data is divided into 100 sec bins |
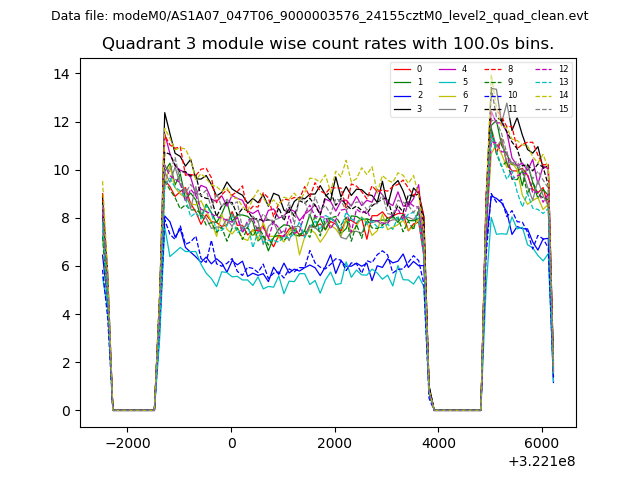 |
 |
| Parameter | Plot |
|---|---|
| CZT HV Monitor | 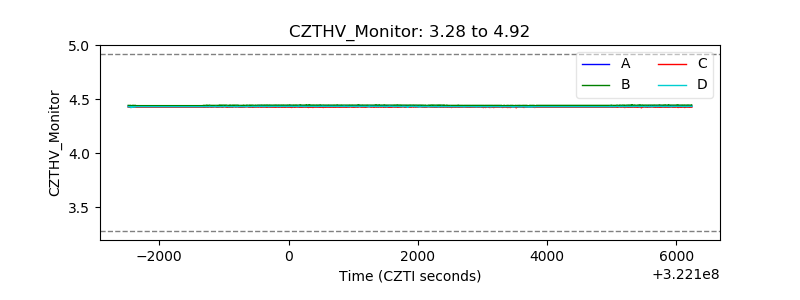 |
| D_VDD | 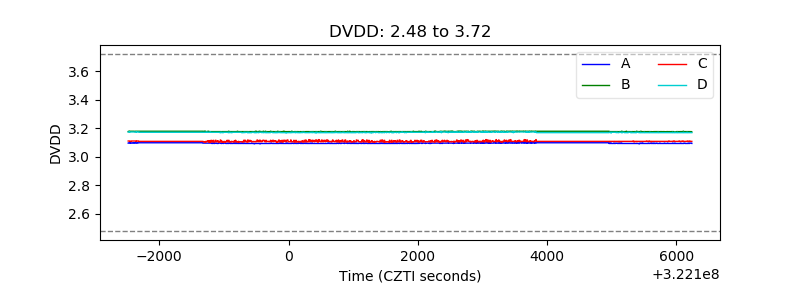 |
| Temperature 1 | 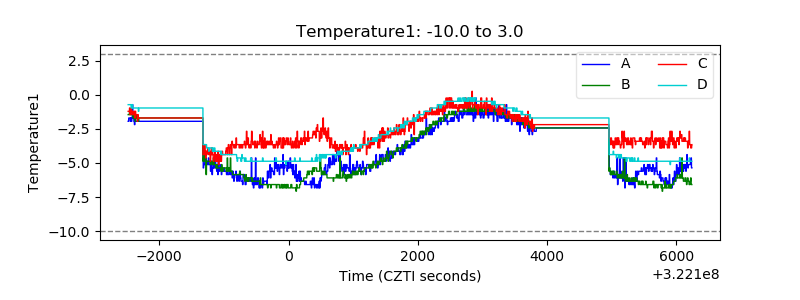 |
| Veto HV Monitor |  |
| Veto LLD | 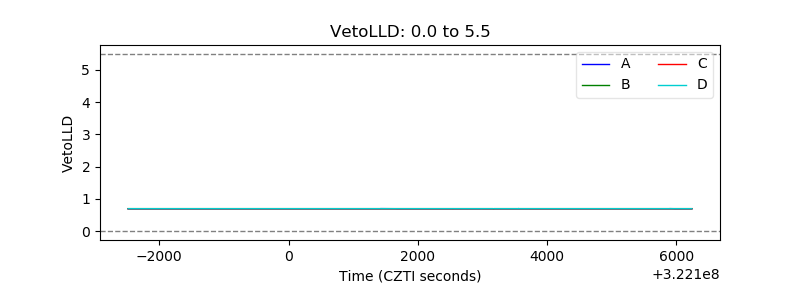 |
| Alpha Counter |  |
| _CPM_Rate | 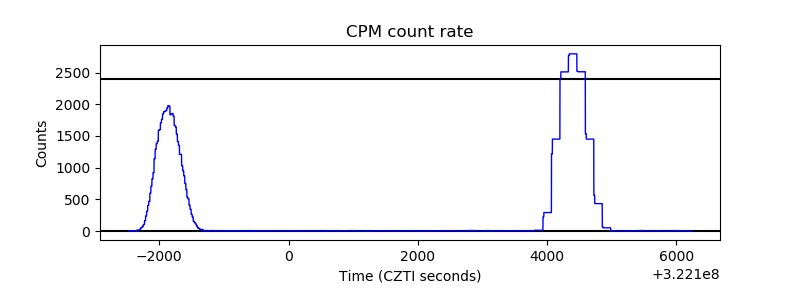 |
| CZT Counter | 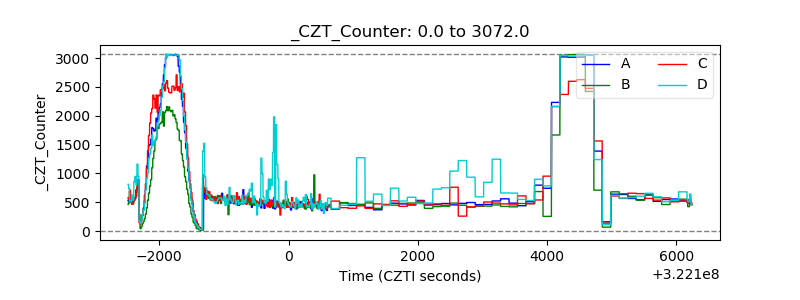 |
| +2.5 Volts monitor |  |
| +5 Volts monitor |  |
| _ROLL_ROT | 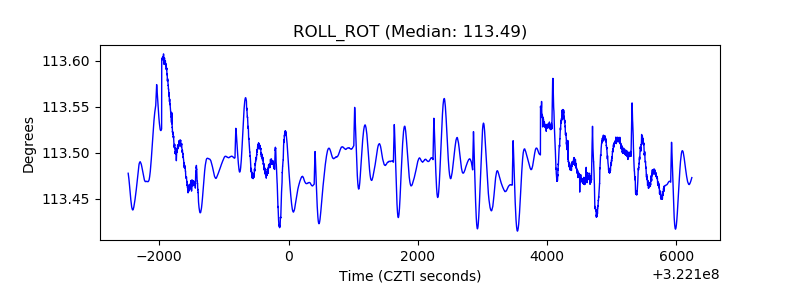 |
| _Roll_DEC | 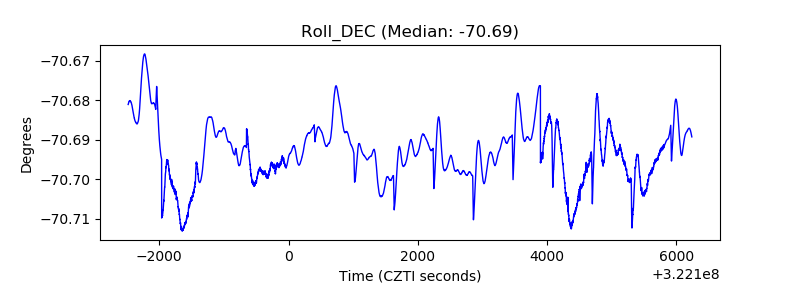 |
| _Roll_RA | 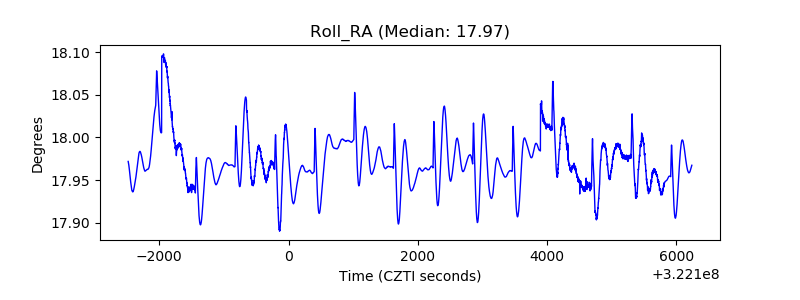 |
| Veto Counter | 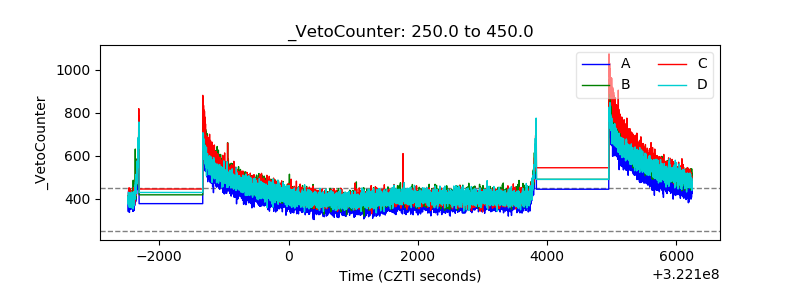 |