| Param | Original file | Final file |
|---|---|---|
| Filename | modeM0/AS1A07_047T06_9000003576_24156cztM0_level2.evt | modeM0/AS1A07_047T06_9000003576_24156cztM0_level2_quad_clean.evt |
| Size (bytes) | 523,992,960 | 139,285,440 |
| Size | 499.7 MB | 132.8 MB |
| Events in quadrant A | 3,275,357 | 975,057 |
| Events in quadrant B | 3,987,188 | 962,361 |
| Events in quadrant C | 3,563,955 | 939,168 |
| Events in quadrant D | 4,616,134 | 903,147 |
| Mode M9 | |||
|---|---|---|---|
| Quadrant | BADHDUFLAG | Total packets | Discarded packets |
| A | 0 | 19 | 0 |
| B | 0 | 20 | 0 |
| C | 0 | 20 | 0 |
| D | 0 | 20 | 0 |
| Mode SS | |||
|---|---|---|---|
| Quadrant | BADHDUFLAG | Total packets | Discarded packets |
| A | 0 | 128 | 0 |
| B | 0 | 128 | 0 |
| C | 0 | 128 | 0 |
| D | 0 | 128 | 0 |
| Mode M0 | |||
|---|---|---|---|
| Quadrant | BADHDUFLAG | Total packets | Discarded packets |
| A | 0 | 13668 | 2 |
| B | 0 | 15884 | 2 |
| C | 0 | 14624 | 2 |
| D | 0 | 17902 | 2 |
| Quadrant | Total seconds | Saturated seconds | Saturation percentage |
|---|---|---|---|
| A | 6286 | 26 | 0.413618% |
| B | 6286 | 329 | 5.233853% |
| C | 6286 | 146 | 2.322622% |
| D | 6286 | 311 | 4.947502% |
Noise dominated data is calculated using 1-second bins in cleaned event files. If a bin has >2000 counts, and if more than 50% of those come from <1% of pixels, then it is considered to be noise-dominated and hence unusable.
| Quadrant | # 1 sec bins | Bins with >0 counts | Bins with >2000 counts | High rate bins dominated by noise | Noise dominated (total time) | Noise dominated (detector-on time) | Marked lightcurve |
|---|---|---|---|---|---|---|---|
| A | 7536 | 6287 | 0 | 0 | 0.00% | 0.00% | 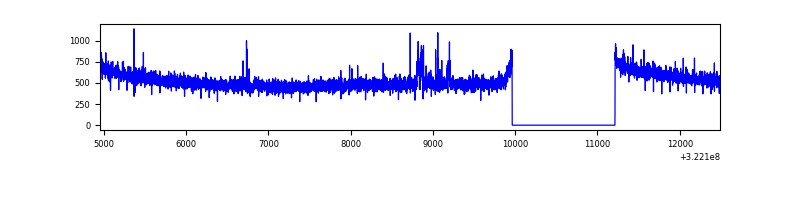 |
| B | 7536 | 6286 | 254 | 254 | 3.37% | 4.04% | 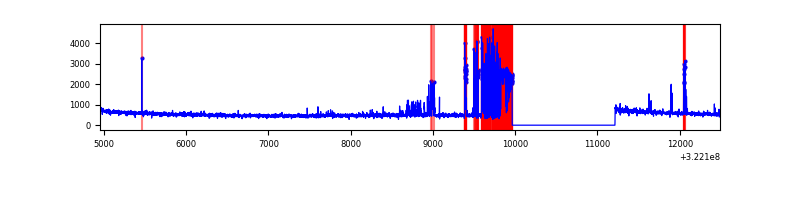 |
| C | 7536 | 6287 | 35 | 35 | 0.46% | 0.56% | 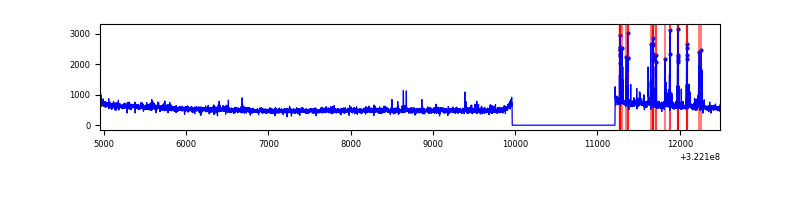 |
| D | 7536 | 6287 | 264 | 264 | 3.50% | 4.20% | 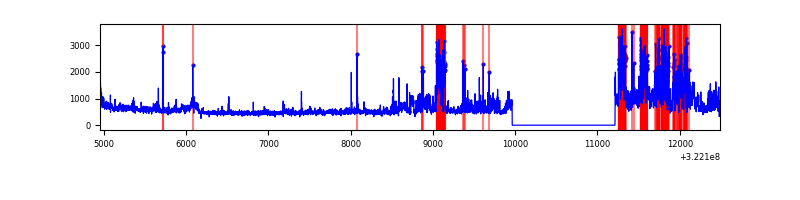 |
Top three noisy pixels from each quadrant. If the there are fewer than three noisy pixels in the level2.evt file, extra rows are filled as -1
| Pixel properties | Quadrant properties | ||||||
|---|---|---|---|---|---|---|---|
| Quadrant | DetID | PixID | Counts | Sigma | Mean | Median | Sigma |
| A | 6 | 16 | 34664 | 206.64 | 839 | 823 | 163.8 |
| A | 13 | 254 | 10634 | 59.91 | 839 | 823 | 163.8 |
| A | 0 | 226 | 7163 | 38.71 | 839 | 823 | 163.8 |
| B | 0 | 245 | 677493 | 4577.49 | 812 | 795 | 147.8 |
| B | 0 | 189 | 88289 | 591.85 | 812 | 795 | 147.8 |
| B | 5 | 172 | 37995 | 251.63 | 812 | 795 | 147.8 |
| C | 14 | 238 | 134133 | 728.85 | 811 | 819 | 182.9 |
| C | 2 | 16 | 131712 | 715.61 | 811 | 819 | 182.9 |
| C | 3 | 233 | 61959 | 334.26 | 811 | 819 | 182.9 |
| D | 7 | 238 | 1220091 | 6267.22 | 810 | 786 | 194.6 |
| D | 6 | 112 | 170443 | 872.04 | 810 | 786 | 194.6 |
| D | 8 | 195 | 89279 | 454.85 | 810 | 786 | 194.6 |
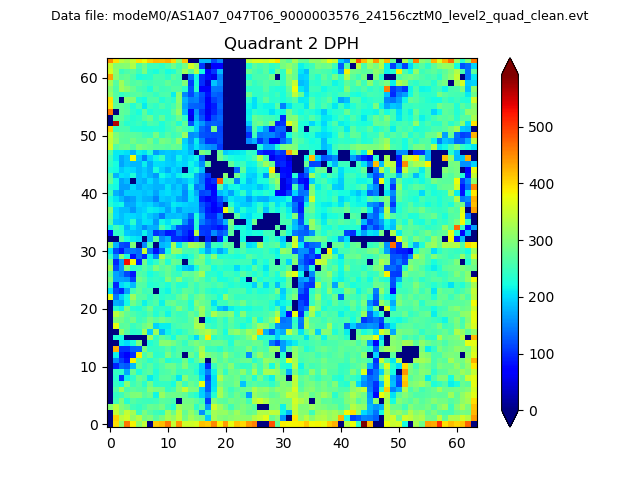
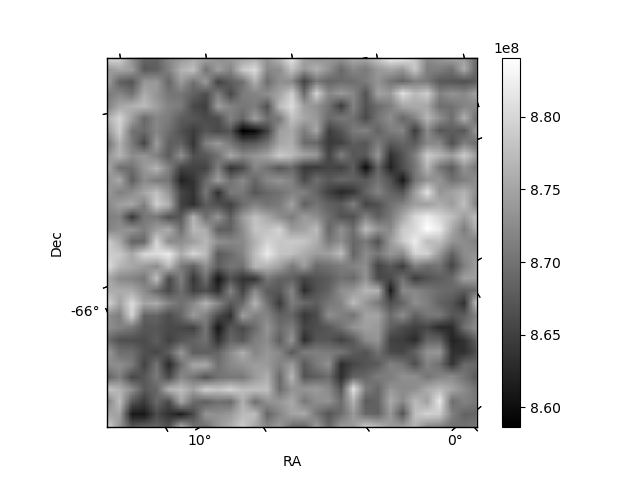
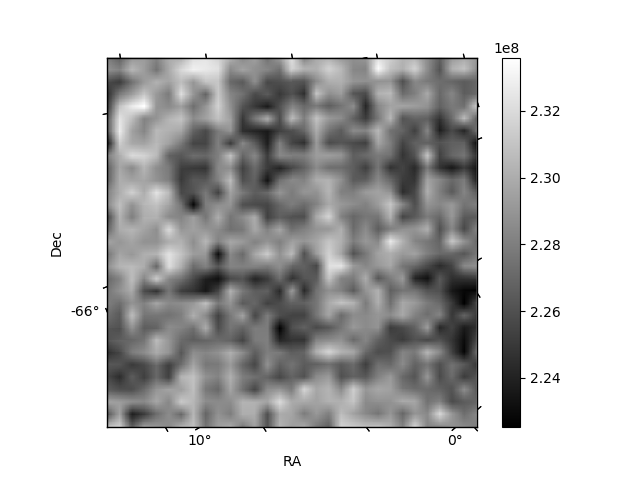
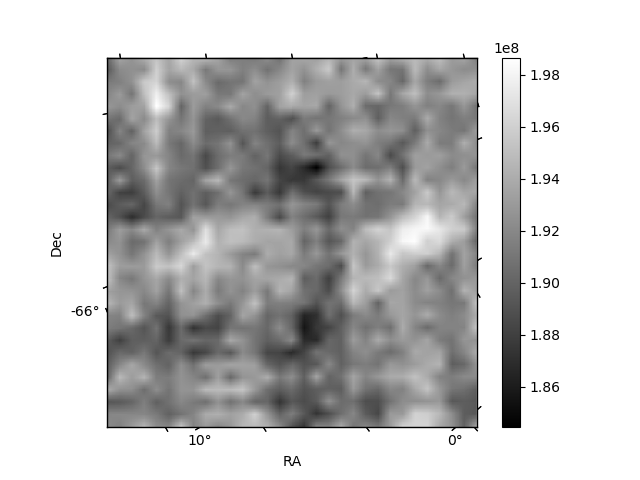
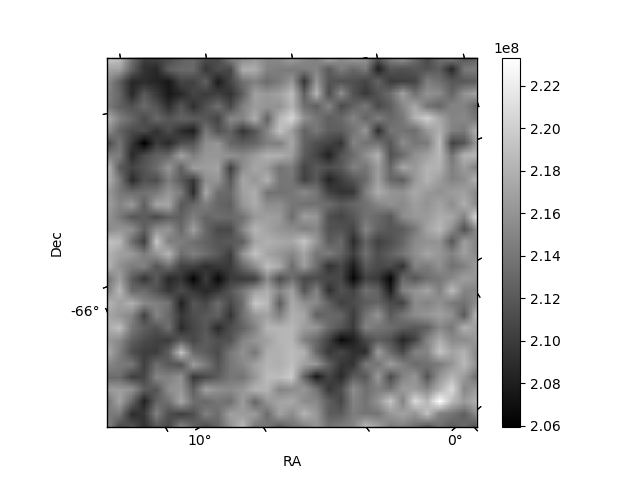
Histogram calculated using DETX and DETY for each event in the final _common_clean file
| Quadrant A | 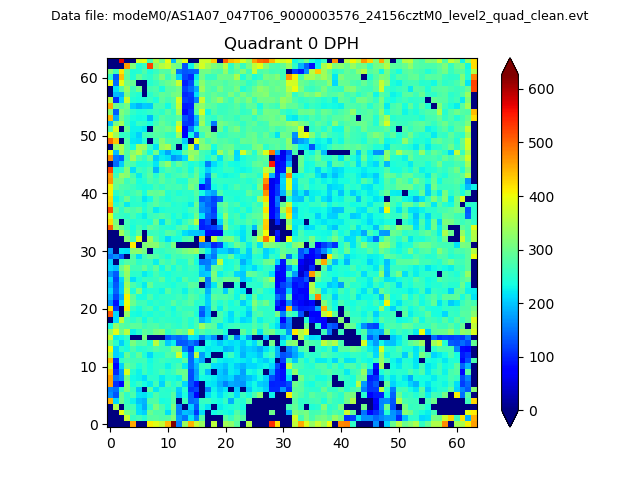 |
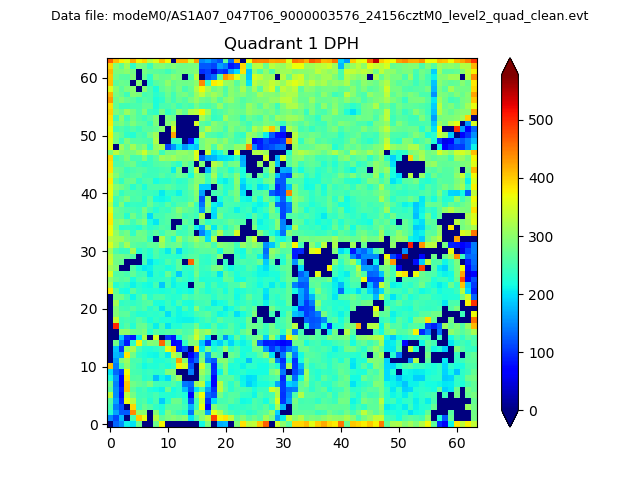 |
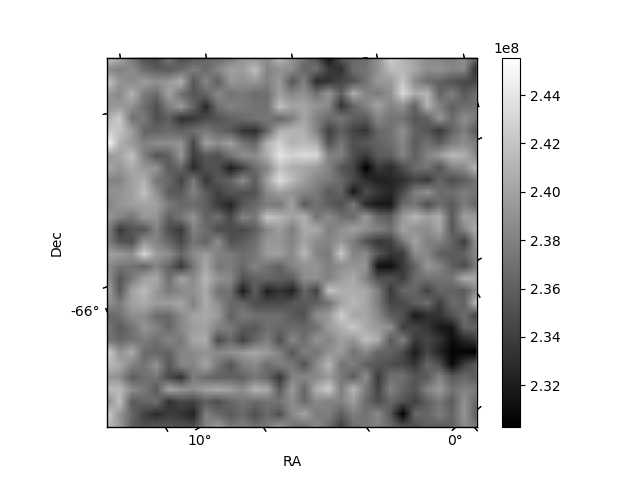
Quadrant B |
|---|---|---|---|
| Quadrant D | 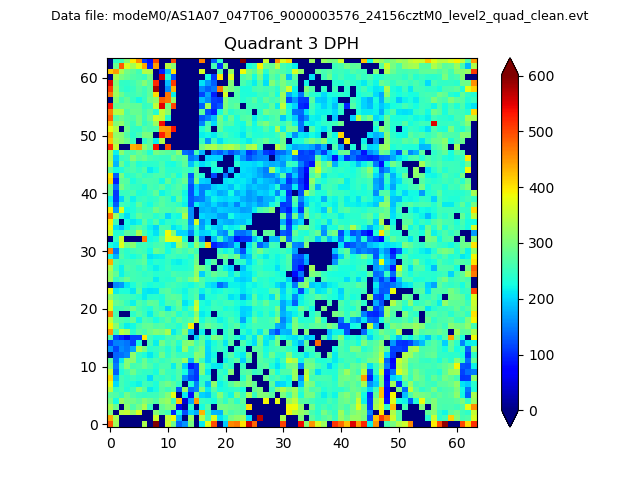 |
 |
Quadrant C |
| Plot type | Count rate plots | Images |
|---|---|---|
| Comparison with Poisson distribution Blue bars denote a histogram of data divided into 1 sec bins. Red curve is a Poisson curve with rate = median count rate of data. |
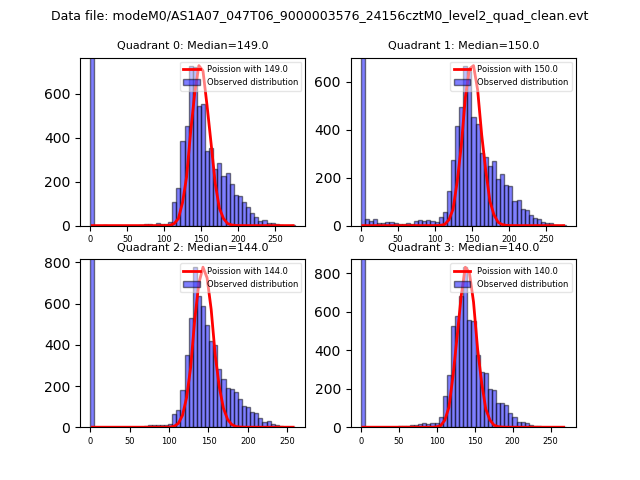 |
 |
| Quadrant-wise count rates Data is divided into 100 sec bins |
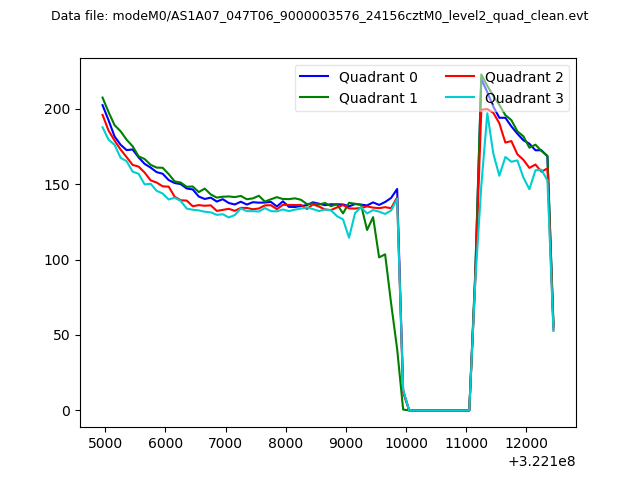 |
|
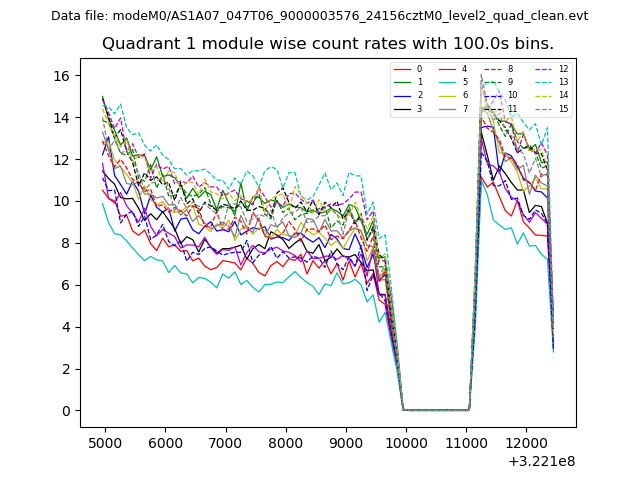
| Module-wise count rates for Quadrant A Data is divided into 100 sec bins |
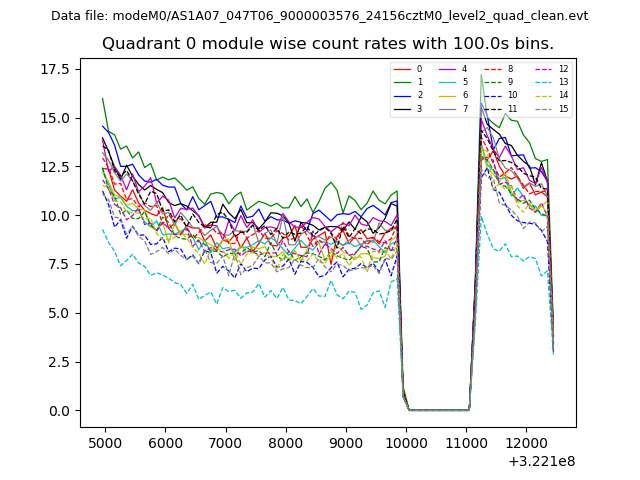 |
 |
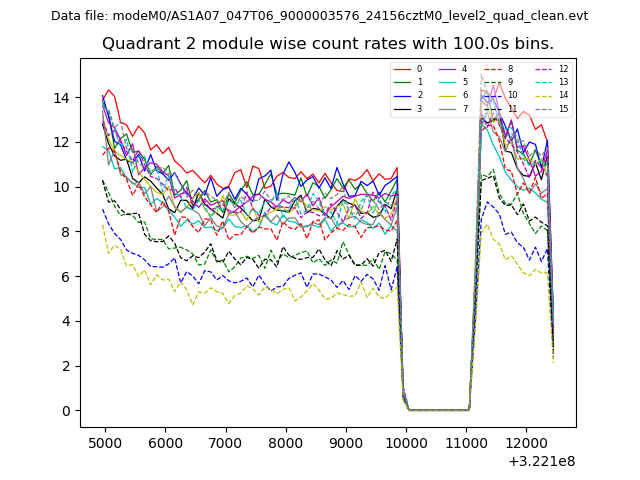
| Module-wise count rates for Quadrant B Data is divided into 100 sec bins |
 |
 |
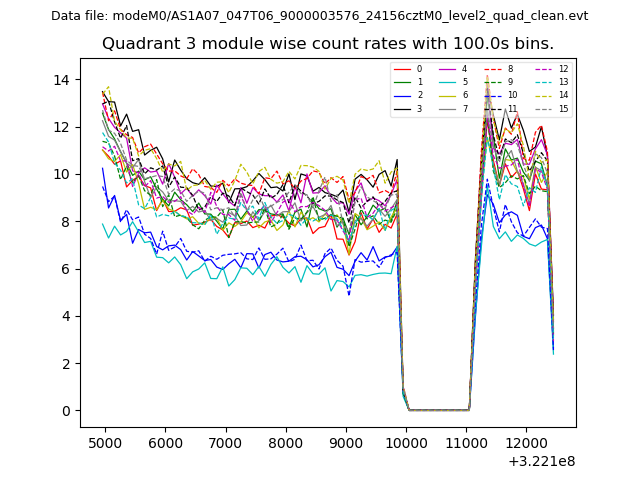
| Module-wise count rates for Quadrant C Data is divided into 100 sec bins |
 |
 |
| Module-wise count rates for Quadrant D Data is divided into 100 sec bins |
 |
 |
| Parameter | Plot |
|---|---|
| CZT HV Monitor | 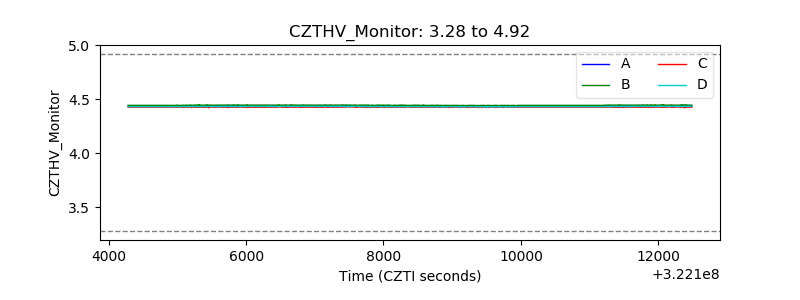 |
| D_VDD | 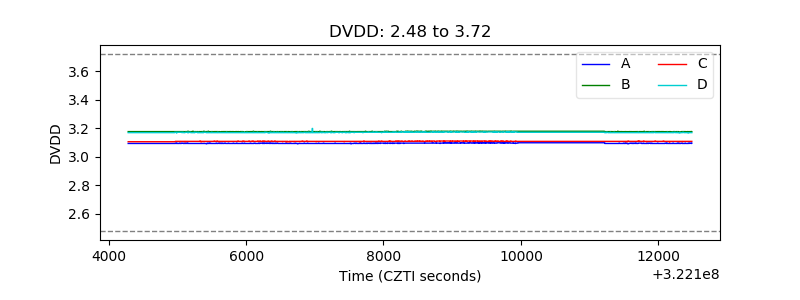 |
| Temperature 1 | 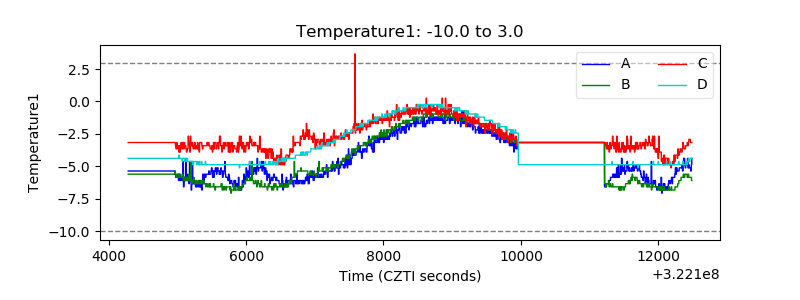 |
| Veto HV Monitor | 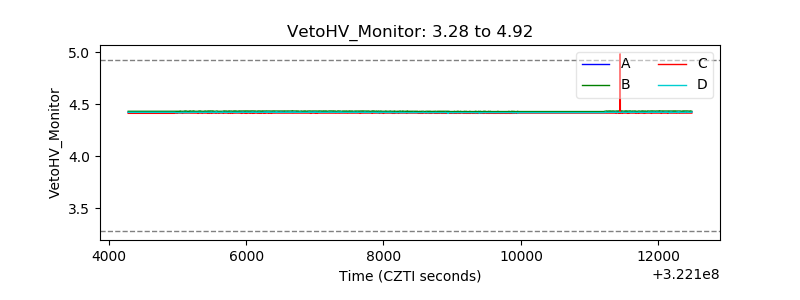 |
| Veto LLD | 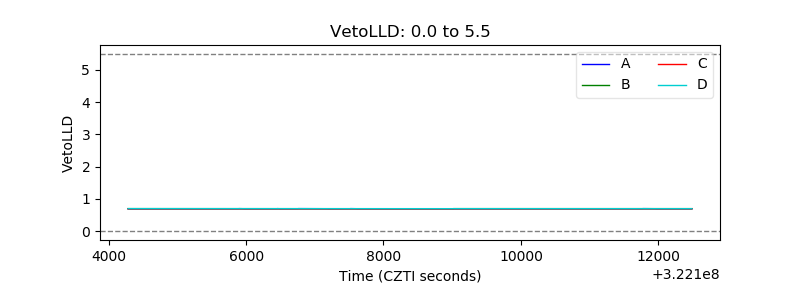 |
| Alpha Counter | 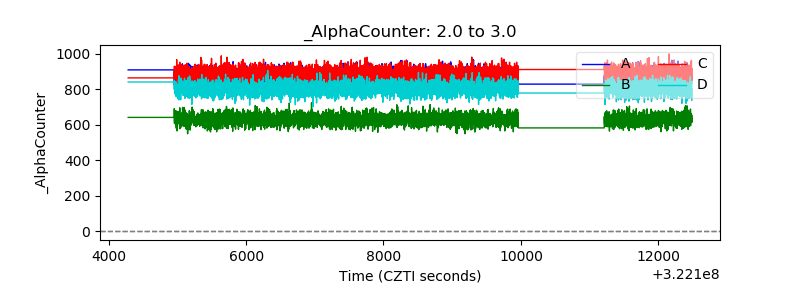 |
| _CPM_Rate | 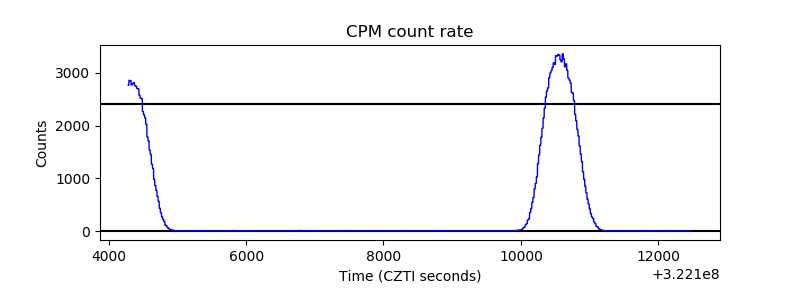 |
| CZT Counter |  |
| +2.5 Volts monitor |  |
| +5 Volts monitor |  |
| _ROLL_ROT | 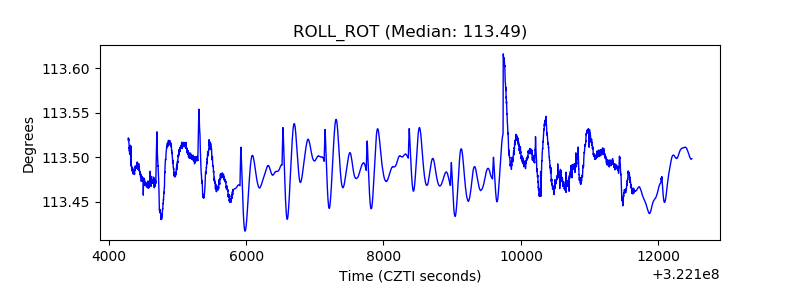 |
| _Roll_DEC | 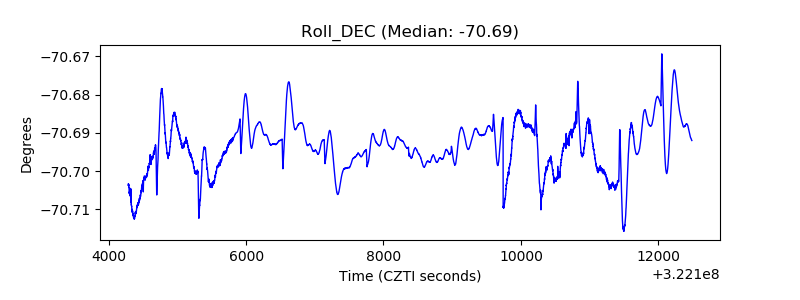 |
| _Roll_RA |  |
| Veto Counter | 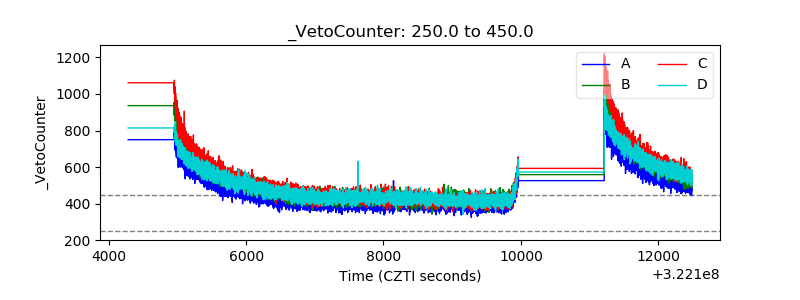 |