| Param | Original file | Final file |
|---|---|---|
| Filename | modeM0/AS1A07_047T06_9000003576_24158cztM0_level2.evt | modeM0/AS1A07_047T06_9000003576_24158cztM0_level2_quad_clean.evt |
| Size (bytes) | 446,909,760 | 129,064,320 |
| Size | 426.2 MB | 123.1 MB |
| Events in quadrant A | 2,925,591 | 901,180 |
| Events in quadrant B | 2,952,079 | 910,013 |
| Events in quadrant C | 3,359,464 | 864,193 |
| Events in quadrant D | 3,923,236 | 847,883 |
| Mode M9 | |||
|---|---|---|---|
| Quadrant | BADHDUFLAG | Total packets | Discarded packets |
| A | 0 | 13 | 0 |
| B | 0 | 13 | 0 |
| C | 0 | 13 | 0 |
| D | 0 | 13 | 0 |
| Mode SS | |||
|---|---|---|---|
| Quadrant | BADHDUFLAG | Total packets | Discarded packets |
| A | 0 | 112 | 0 |
| B | 0 | 112 | 0 |
| C | 0 | 112 | 0 |
| D | 0 | 112 | 0 |
| Mode M0 | |||
|---|---|---|---|
| Quadrant | BADHDUFLAG | Total packets | Discarded packets |
| A | 0 | 11895 | 1 |
| B | 0 | 12056 | 1 |
| C | 0 | 13507 | 1 |
| D | 0 | 15266 | 1 |
| Quadrant | Total seconds | Saturated seconds | Saturation percentage |
|---|---|---|---|
| A | 5513 | 36 | 0.653002% |
| B | 5514 | 60 | 1.088139% |
| C | 5514 | 205 | 3.717809% |
| D | 5514 | 161 | 2.919840% |
Noise dominated data is calculated using 1-second bins in cleaned event files. If a bin has >2000 counts, and if more than 50% of those come from <1% of pixels, then it is considered to be noise-dominated and hence unusable.
| Quadrant | # 1 sec bins | Bins with >0 counts | Bins with >2000 counts | High rate bins dominated by noise | Noise dominated (total time) | Noise dominated (detector-on time) | Marked lightcurve |
|---|---|---|---|---|---|---|---|
| A | 6858 | 5514 | 0 | 0 | 0.00% | 0.00% | 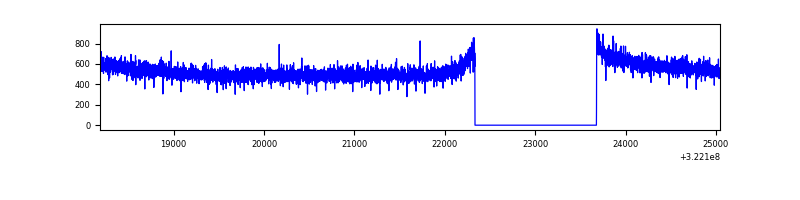 |
| B | 6859 | 5514 | 6 | 6 | 0.09% | 0.11% | 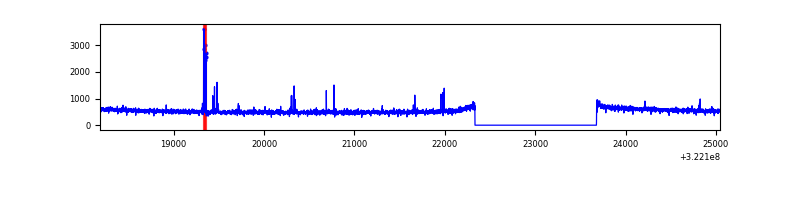 |
| C | 6859 | 5515 | 54 | 54 | 0.79% | 0.98% | 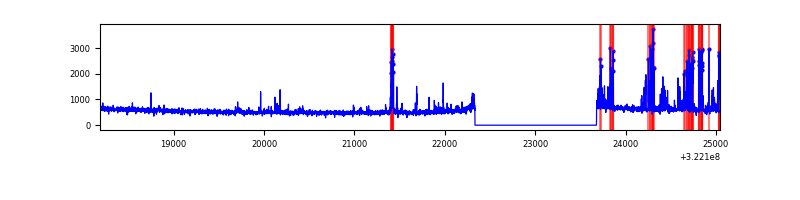 |
| D | 6859 | 5514 | 115 | 115 | 1.68% | 2.09% | 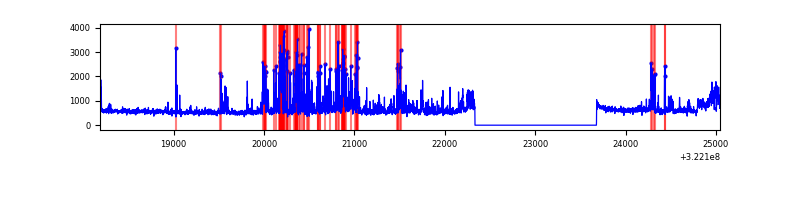 |
Top three noisy pixels from each quadrant. If the there are fewer than three noisy pixels in the level2.evt file, extra rows are filled as -1
| Pixel properties | Quadrant properties | ||||||
|---|---|---|---|---|---|---|---|
| Quadrant | DetID | PixID | Counts | Sigma | Mean | Median | Sigma |
| A | 13 | 254 | 9431 | 58.2 | 758 | 746 | 149.2 |
| A | 0 | 226 | 6769 | 40.36 | 758 | 746 | 149.2 |
| A | 3 | 137 | 5718 | 33.32 | 758 | 746 | 149.2 |
| B | 4 | 216 | 30495 | 218.73 | 746 | 732 | 136.1 |
| B | 12 | 111 | 15018 | 104.99 | 746 | 732 | 136.1 |
| B | 11 | 111 | 13243 | 91.94 | 746 | 732 | 136.1 |
| C | 10 | 9 | 278319 | 1705.75 | 725 | 732 | 162.7 |
| C | 14 | 238 | 120079 | 733.38 | 725 | 732 | 162.7 |
| C | 2 | 16 | 78117 | 475.52 | 725 | 732 | 162.7 |
| D | 7 | 238 | 726234 | 4120.51 | 741 | 721 | 176.1 |
| D | 8 | 195 | 211522 | 1197.23 | 741 | 721 | 176.1 |
| D | 12 | 233 | 160509 | 907.51 | 741 | 721 | 176.1 |
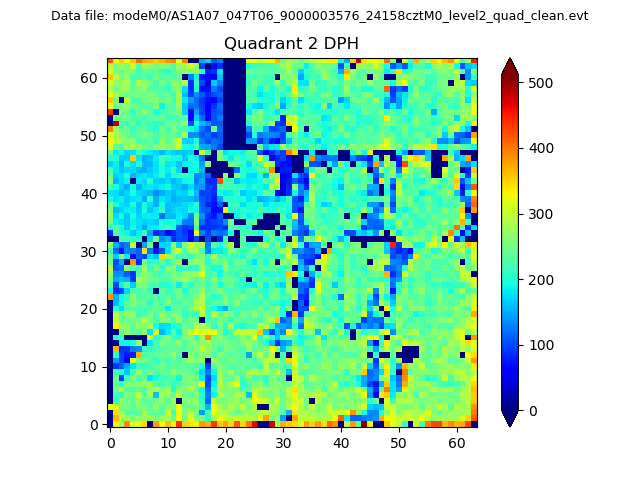
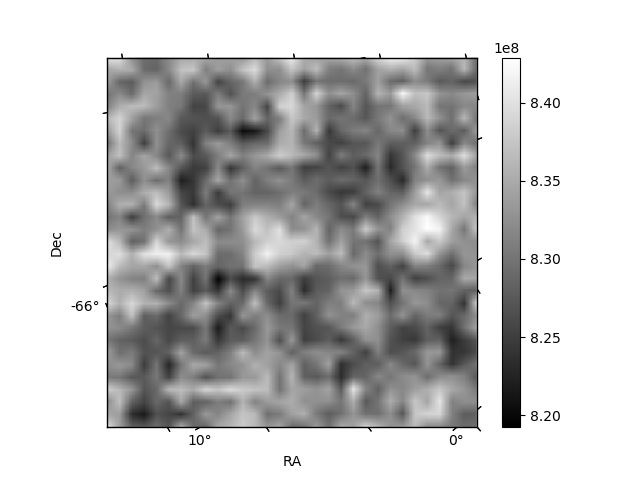
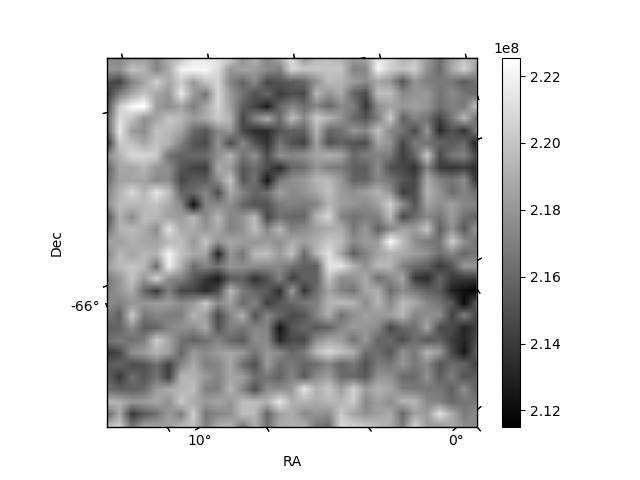
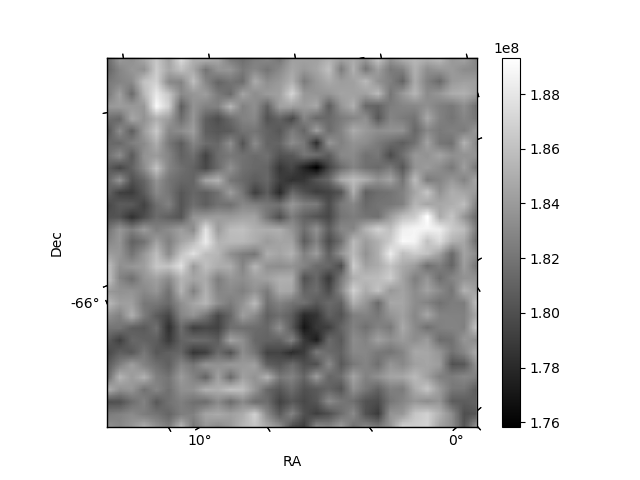
Histogram calculated using DETX and DETY for each event in the final _common_clean file
| Quadrant A | 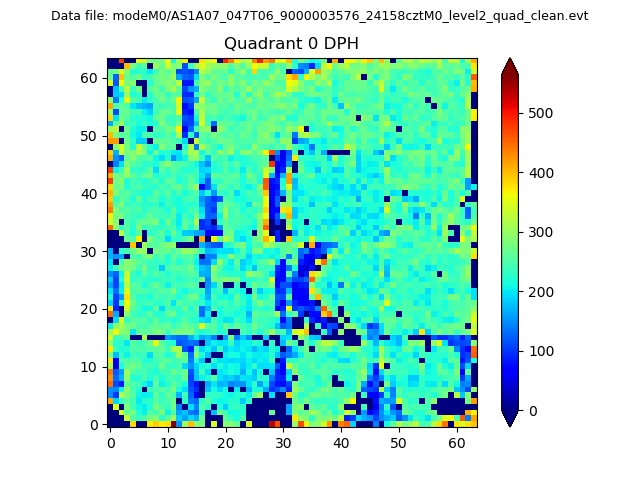 |
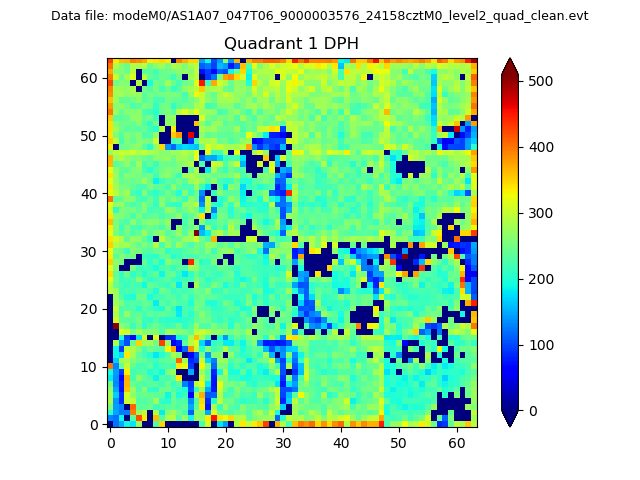 |
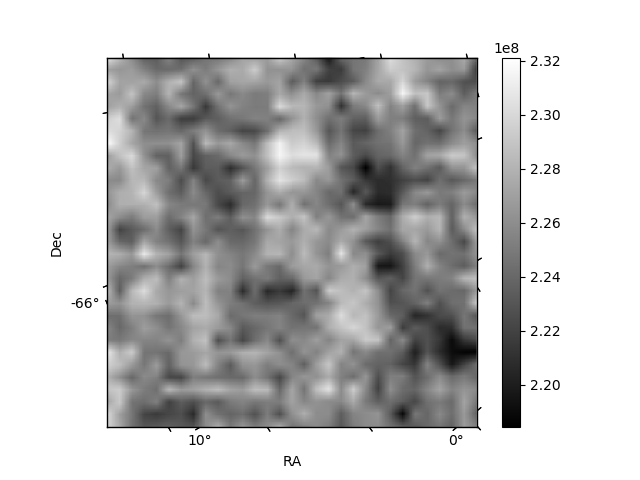
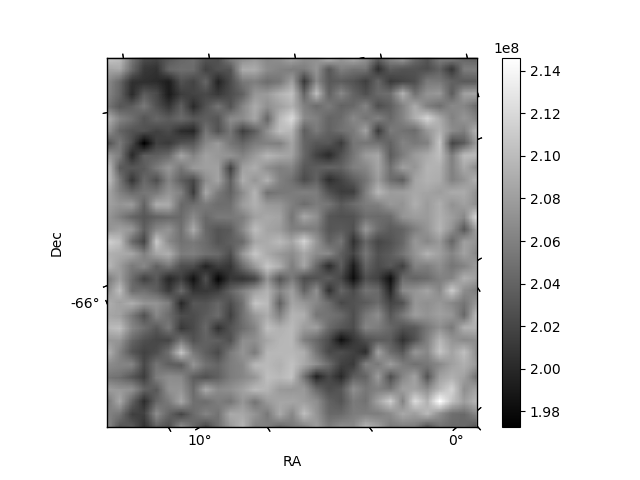
Quadrant B |
|---|---|---|---|
| Quadrant D | 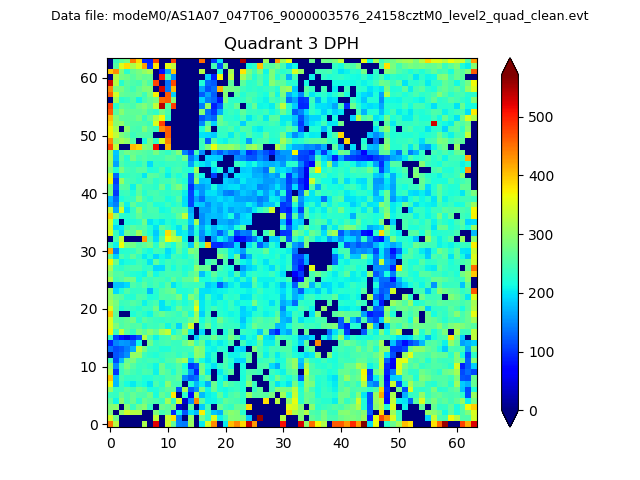 |
 |
Quadrant C |
| Plot type | Count rate plots | Images |
|---|---|---|
| Comparison with Poisson distribution Blue bars denote a histogram of data divided into 1 sec bins. Red curve is a Poisson curve with rate = median count rate of data. |
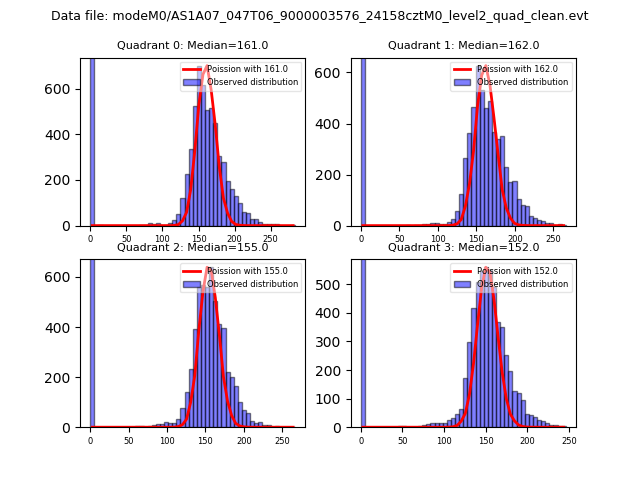 |
 |
| Quadrant-wise count rates Data is divided into 100 sec bins |
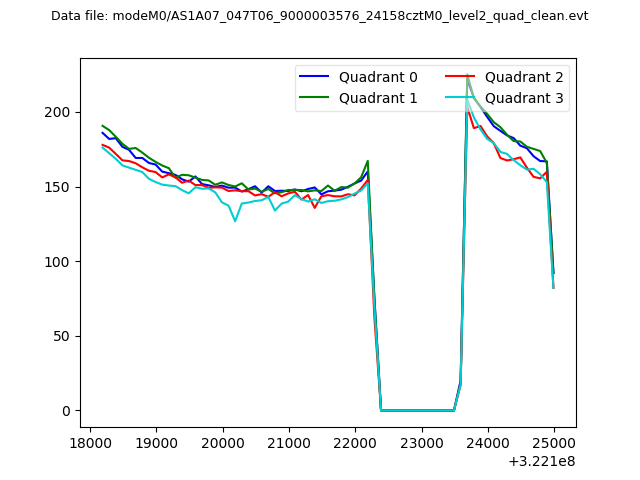 |
|
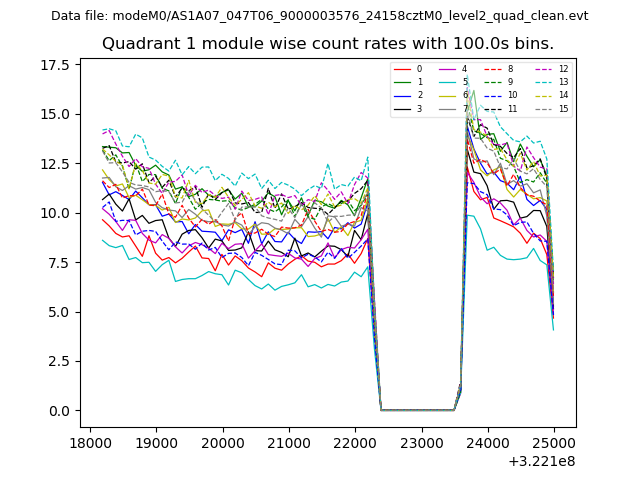
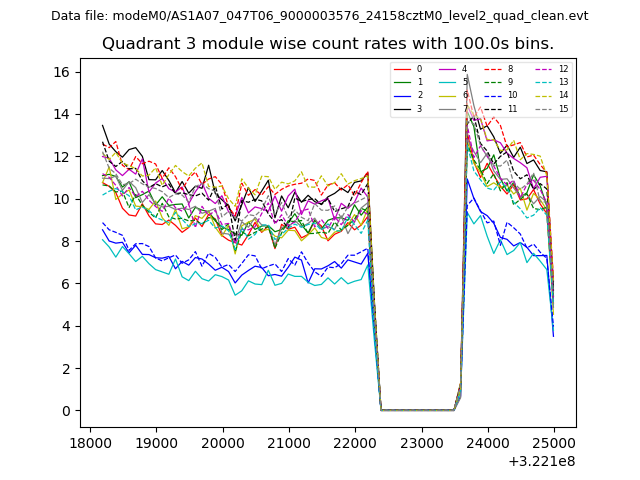
| Module-wise count rates for Quadrant A Data is divided into 100 sec bins |
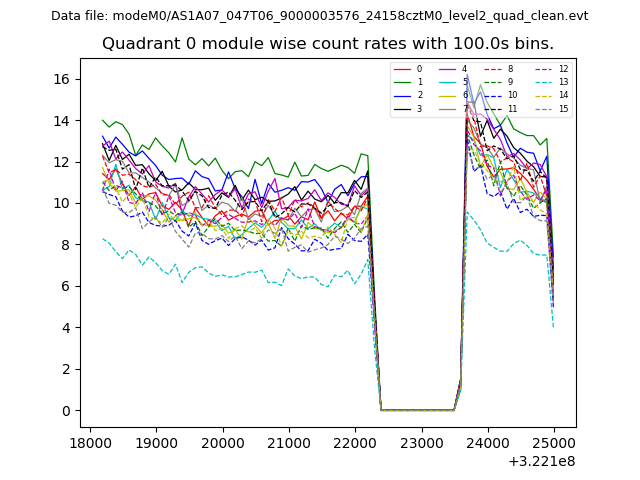 |
 |
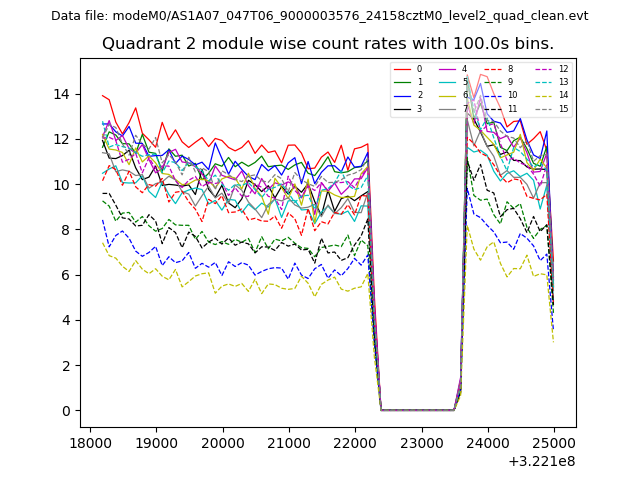
| Module-wise count rates for Quadrant B Data is divided into 100 sec bins |
 |
 |
| Module-wise count rates for Quadrant C Data is divided into 100 sec bins |
 |
 |
| Module-wise count rates for Quadrant D Data is divided into 100 sec bins |
 |
 |
| Parameter | Plot |
|---|---|
| CZT HV Monitor | 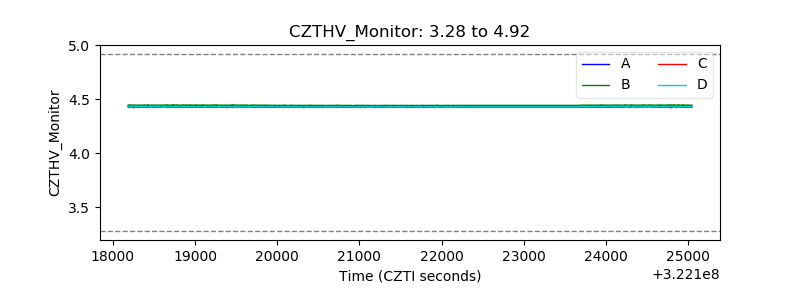 |
| D_VDD | 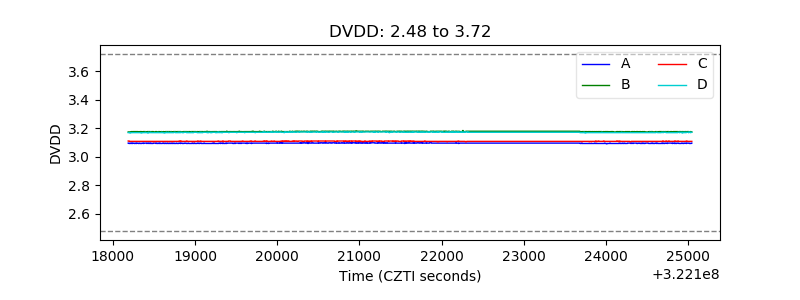 |
| Temperature 1 | 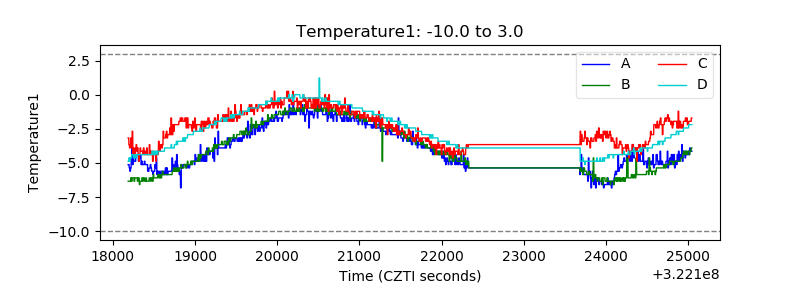 |
| Veto HV Monitor | 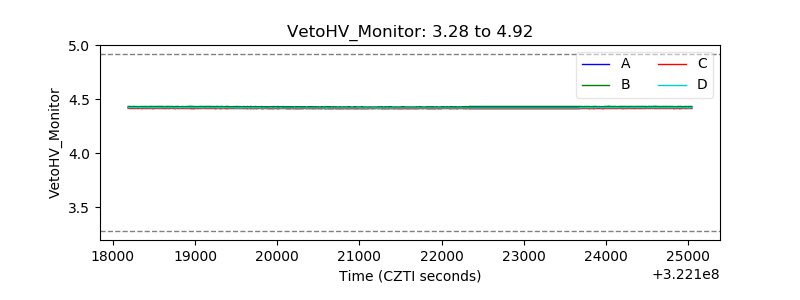 |
| Veto LLD | 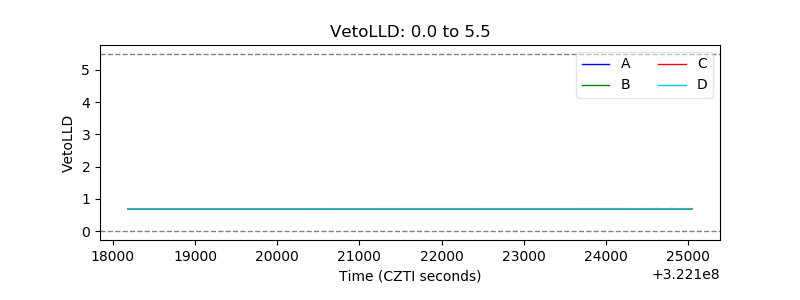 |
| Alpha Counter | 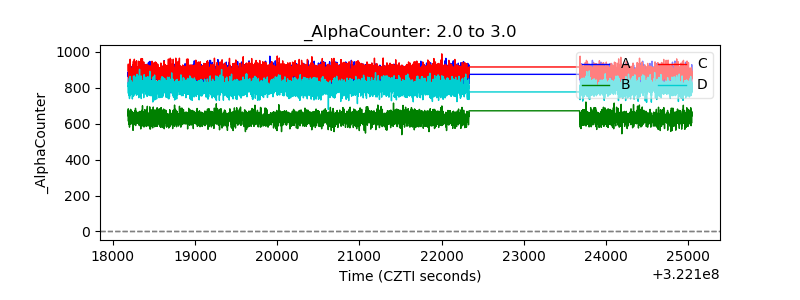 |
| _CPM_Rate | 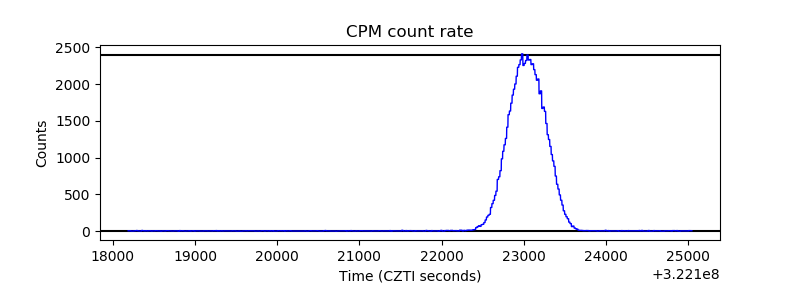 |
| CZT Counter | 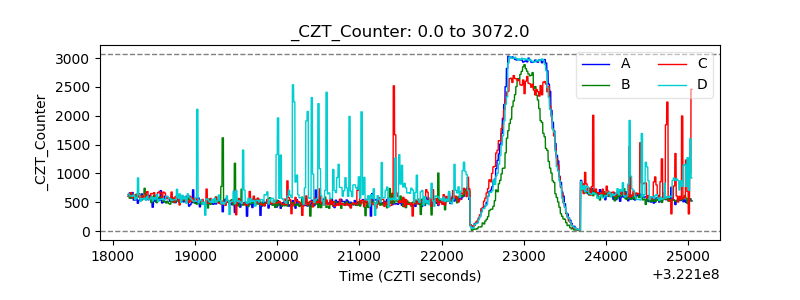 |
| +2.5 Volts monitor |  |
| +5 Volts monitor |  |
| _ROLL_ROT | 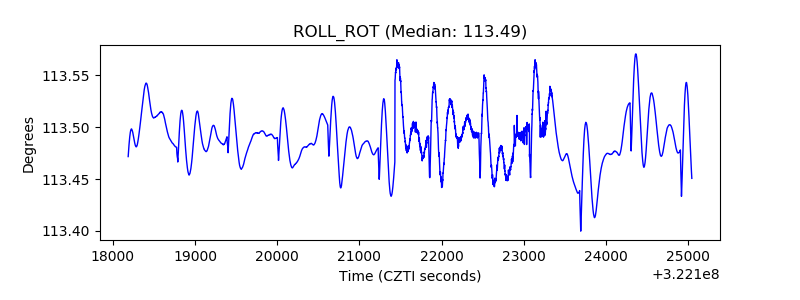 |
| _Roll_DEC | 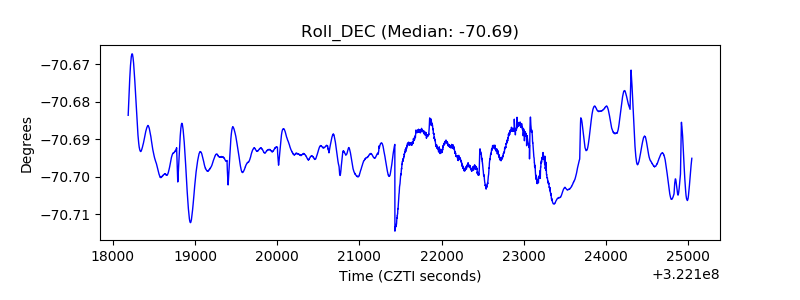 |
| _Roll_RA | 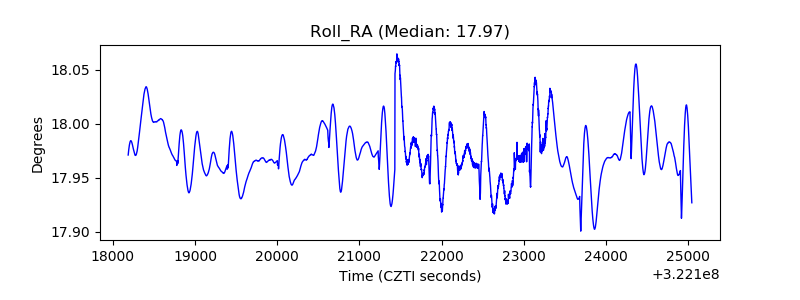 |
| Veto Counter | 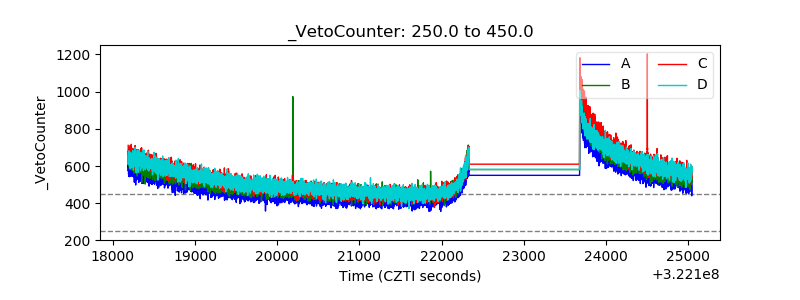 |