| Param | Original file | Final file |
|---|---|---|
| Filename | modeM0/AS1A07_047T06_9000003576_24159cztM0_level2.evt | modeM0/AS1A07_047T06_9000003576_24159cztM0_level2_quad_clean.evt |
| Size (bytes) | 342,391,680 | 93,240,000 |
| Size | 326.5 MB | 88.9 MB |
| Events in quadrant A | 2,097,939 | 650,636 |
| Events in quadrant B | 2,143,509 | 654,002 |
| Events in quadrant C | 2,787,637 | 619,552 |
| Events in quadrant D | 3,064,764 | 614,395 |
| Mode SS | |||
|---|---|---|---|
| Quadrant | BADHDUFLAG | Total packets | Discarded packets |
| A | 0 | 80 | 0 |
| B | 0 | 80 | 0 |
| C | 0 | 80 | 0 |
| D | 0 | 80 | 0 |
| Mode M0 | |||
|---|---|---|---|
| Quadrant | BADHDUFLAG | Total packets | Discarded packets |
| A | 0 | 8701 | 0 |
| B | 0 | 8902 | 0 |
| C | 0 | 10983 | 0 |
| D | 0 | 11859 | 0 |
| Quadrant | Total seconds | Saturated seconds | Saturation percentage |
|---|---|---|---|
| A | 4047 | 6 | 0.148258% |
| B | 4047 | 19 | 0.469484% |
| C | 4047 | 184 | 4.546578% |
| D | 4048 | 148 | 3.656126% |
Noise dominated data is calculated using 1-second bins in cleaned event files. If a bin has >2000 counts, and if more than 50% of those come from <1% of pixels, then it is considered to be noise-dominated and hence unusable.
| Quadrant | # 1 sec bins | Bins with >0 counts | Bins with >2000 counts | High rate bins dominated by noise | Noise dominated (total time) | Noise dominated (detector-on time) | Marked lightcurve |
|---|---|---|---|---|---|---|---|
| A | 4047 | 4047 | 0 | 0 | 0.00% | 0.00% | 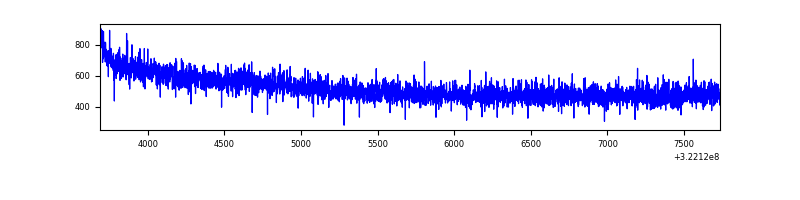 |
| B | 4047 | 4047 | 9 | 9 | 0.22% | 0.22% | 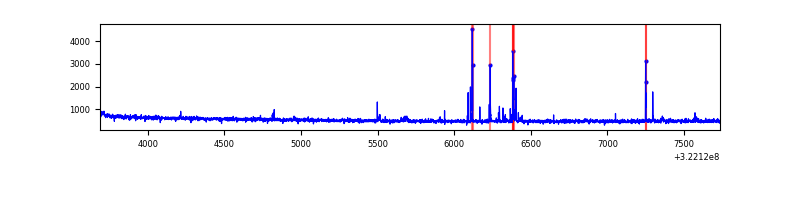 |
| C | 4047 | 4047 | 102 | 102 | 2.52% | 2.52% | 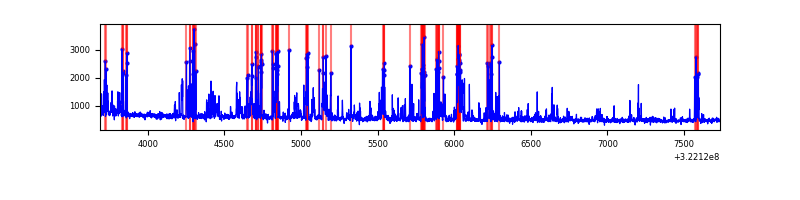 |
| D | 4048 | 4048 | 165 | 165 | 4.08% | 4.08% | 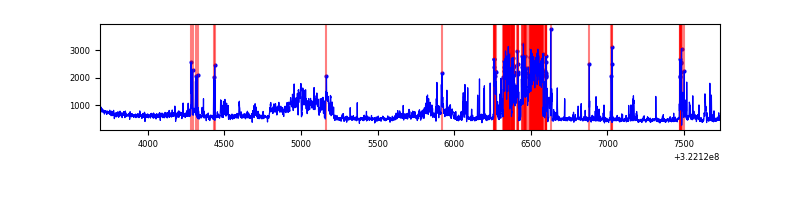 |
Top three noisy pixels from each quadrant. If the there are fewer than three noisy pixels in the level2.evt file, extra rows are filled as -1
| Pixel properties | Quadrant properties | ||||||
|---|---|---|---|---|---|---|---|
| Quadrant | DetID | PixID | Counts | Sigma | Mean | Median | Sigma |
| A | 13 | 254 | 6697 | 57.41 | 544 | 536 | 107.3 |
| A | 0 | 226 | 4799 | 39.72 | 544 | 536 | 107.3 |
| A | 3 | 137 | 3954 | 31.85 | 544 | 536 | 107.3 |
| B | 0 | 245 | 53291 | 542.05 | 531 | 521 | 97.4 |
| B | 12 | 111 | 10547 | 102.99 | 531 | 521 | 97.4 |
| B | 11 | 111 | 9232 | 89.48 | 531 | 521 | 97.4 |
| C | 10 | 9 | 423059 | 3649.55 | 513 | 518 | 115.8 |
| C | 2 | 16 | 236238 | 2035.95 | 513 | 518 | 115.8 |
| C | 14 | 238 | 84195 | 722.73 | 513 | 518 | 115.8 |
| D | 7 | 238 | 913998 | 7138.61 | 531 | 516 | 128.0 |
| D | 12 | 233 | 66021 | 511.9 | 531 | 516 | 128.0 |
| D | 8 | 195 | 46184 | 356.88 | 531 | 516 | 128.0 |
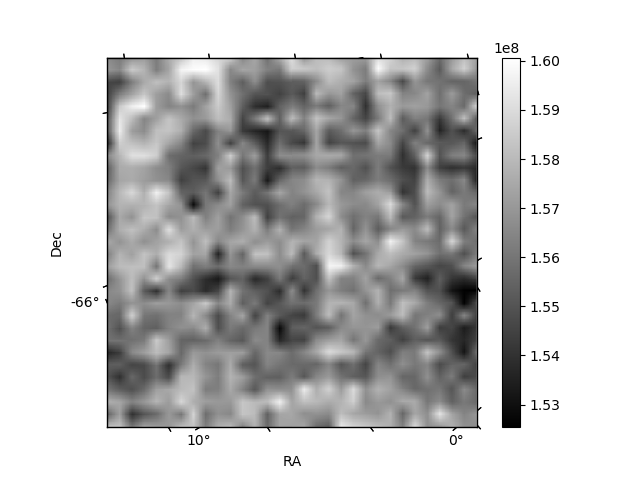
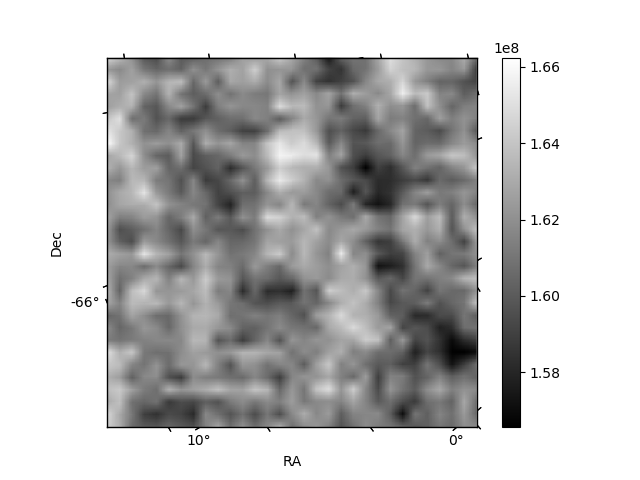
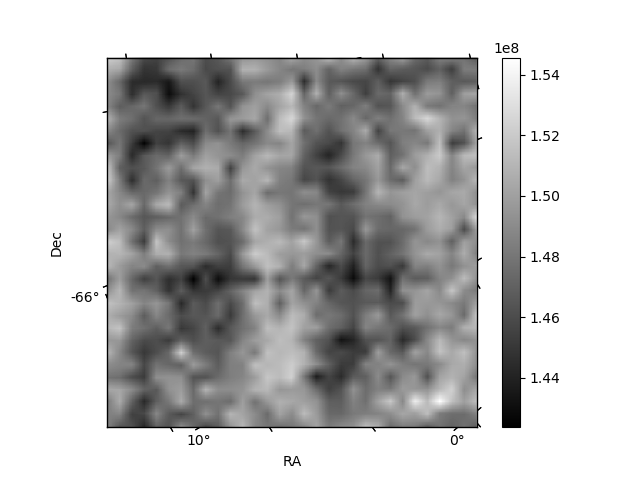
Histogram calculated using DETX and DETY for each event in the final _common_clean file
| Quadrant A | 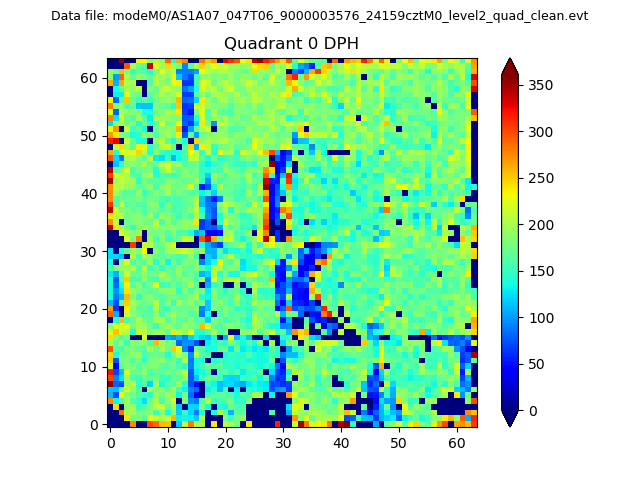 |
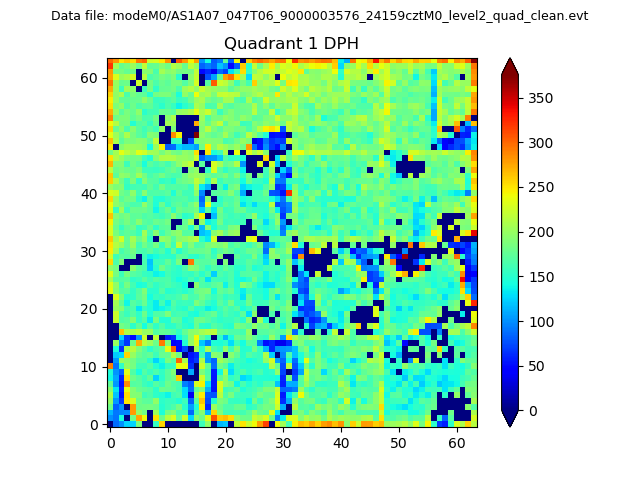 |
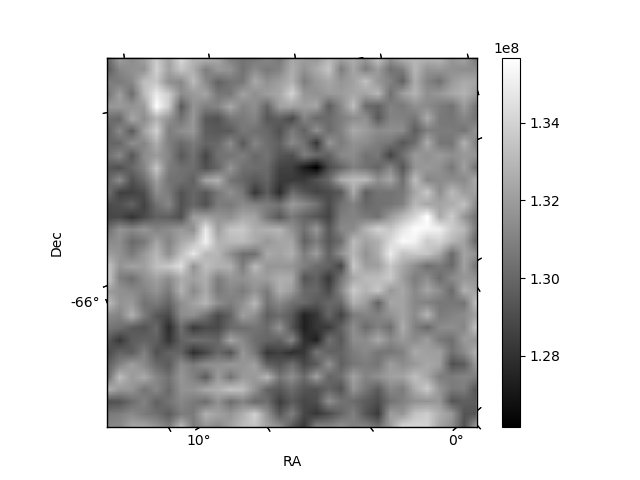
Quadrant B |
|---|---|---|---|
| Quadrant D | 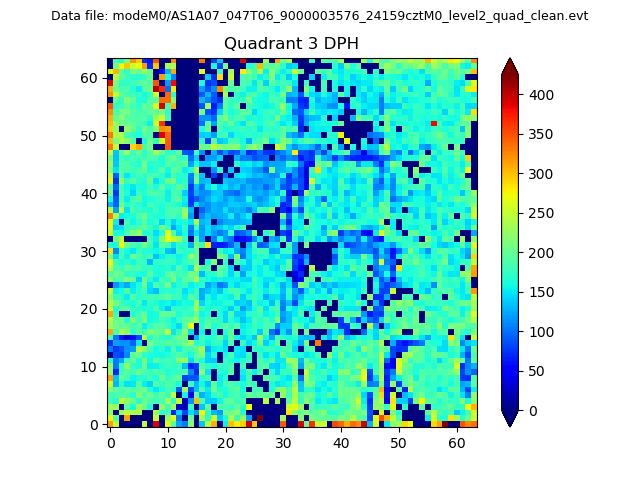 |
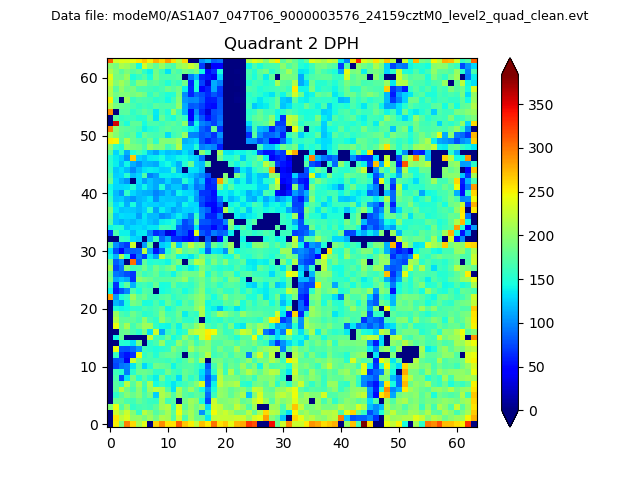 |
Quadrant C |
| Plot type | Count rate plots | Images |
|---|---|---|
| Comparison with Poisson distribution Blue bars denote a histogram of data divided into 1 sec bins. Red curve is a Poisson curve with rate = median count rate of data. |
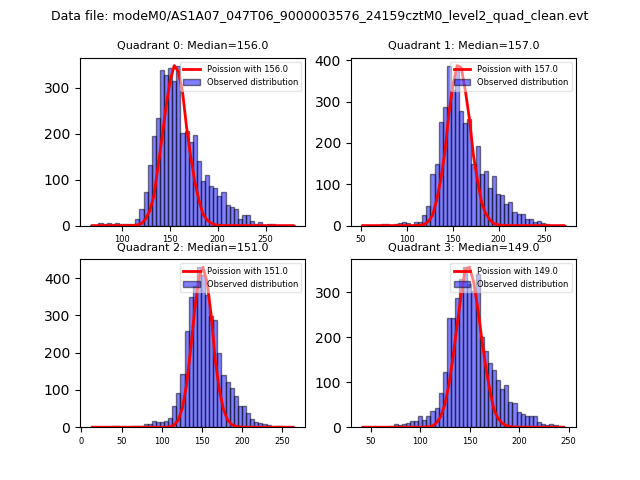 |
 |
| Quadrant-wise count rates Data is divided into 100 sec bins |
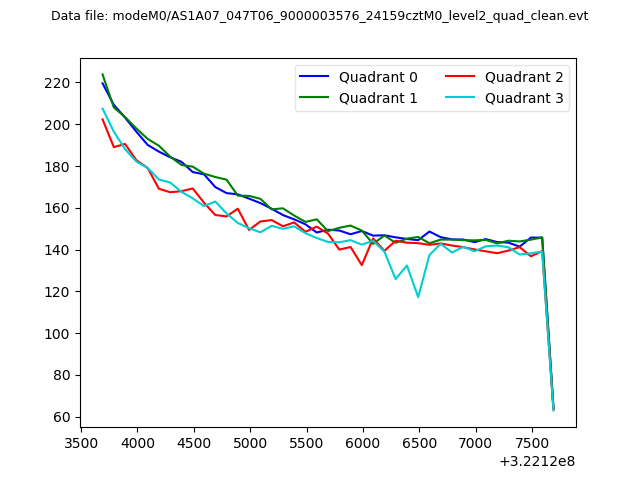 |
|
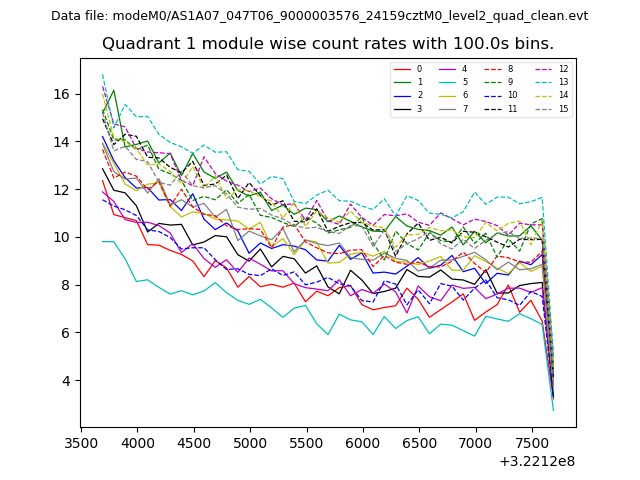
| Module-wise count rates for Quadrant A Data is divided into 100 sec bins |
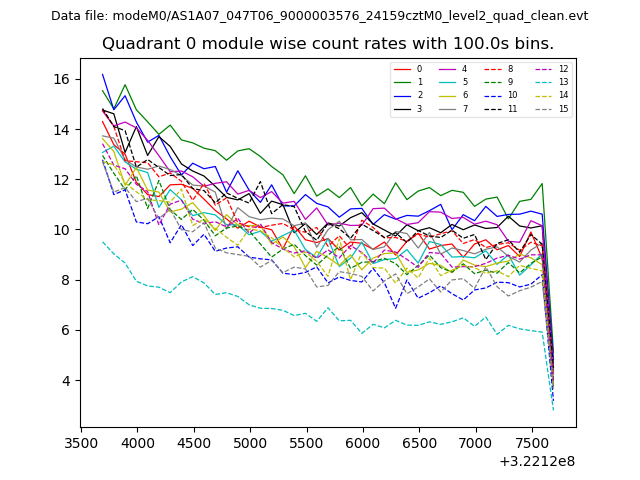 |
 |
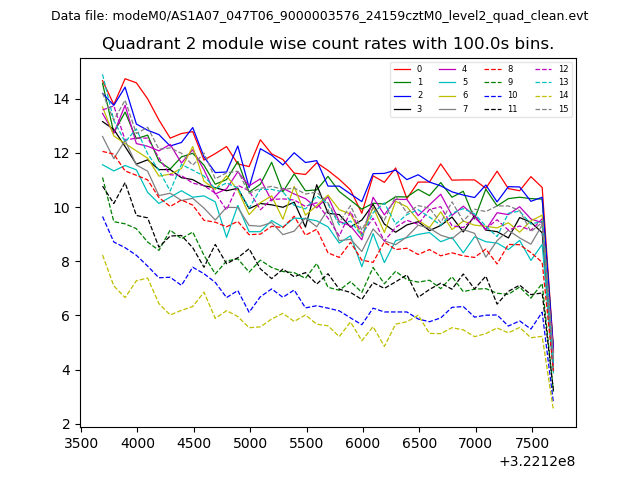
| Module-wise count rates for Quadrant B Data is divided into 100 sec bins |
 |
 |
| Module-wise count rates for Quadrant C Data is divided into 100 sec bins |
 |
 |
| Module-wise count rates for Quadrant D Data is divided into 100 sec bins |
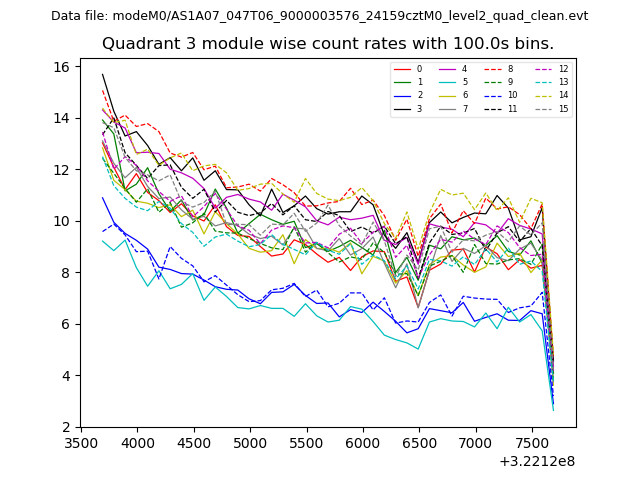 |
 |
| Parameter | Plot |
|---|---|
| CZT HV Monitor | 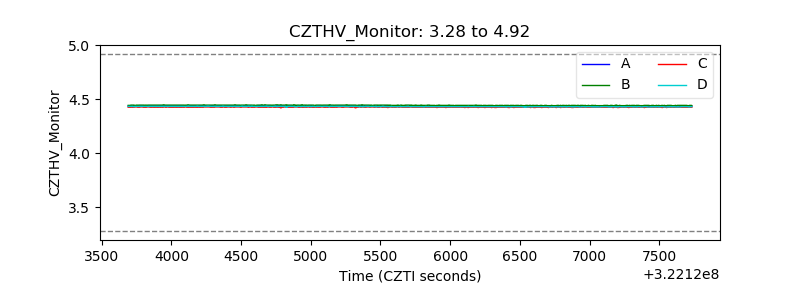 |
| D_VDD | 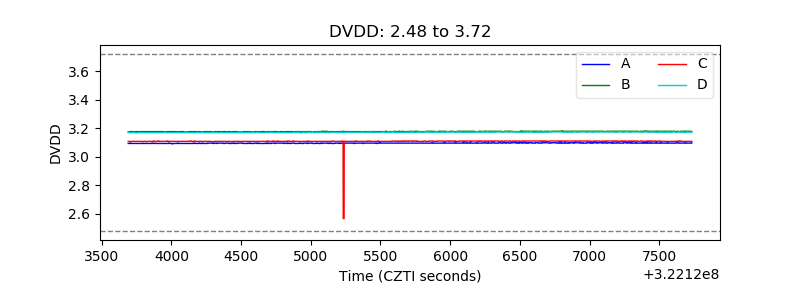 |
| Temperature 1 |  |
| Veto HV Monitor | 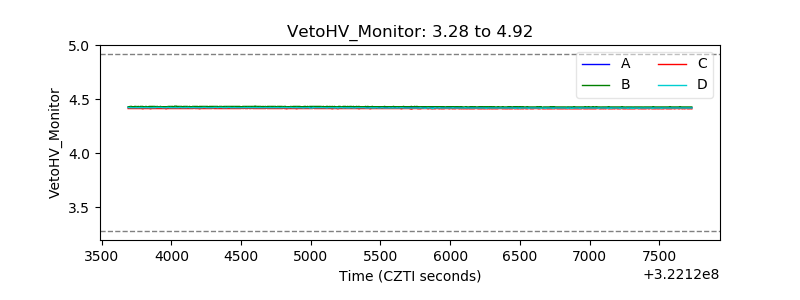 |
| Veto LLD | 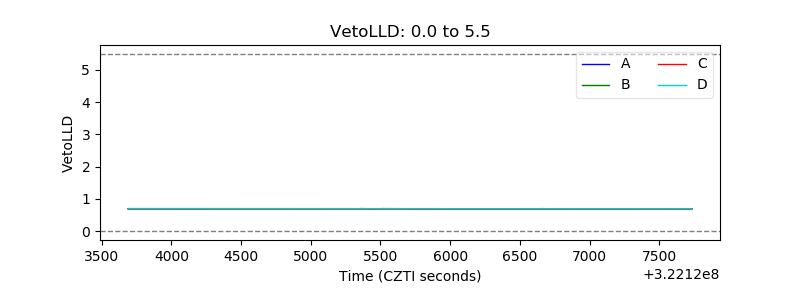 |
| Alpha Counter | 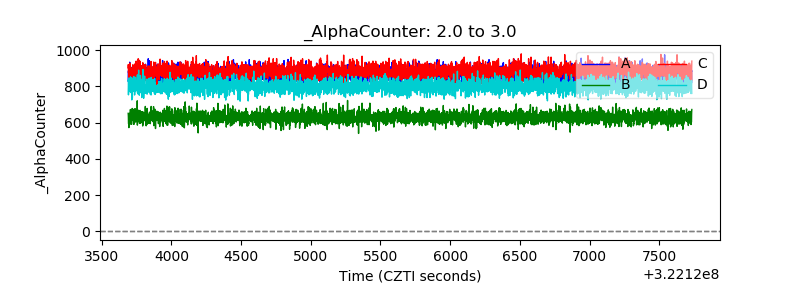 |
| _CPM_Rate | 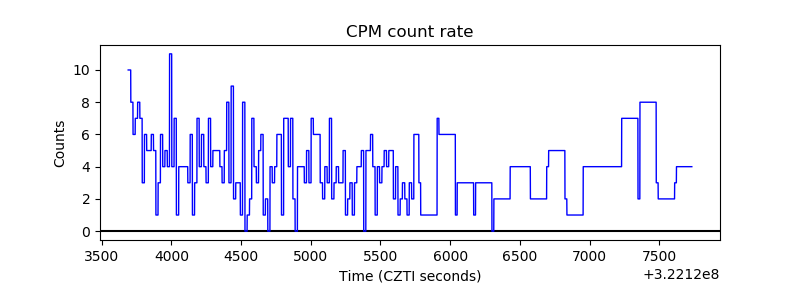 |
| CZT Counter |  |
| +2.5 Volts monitor |  |
| +5 Volts monitor |  |
| _ROLL_ROT | 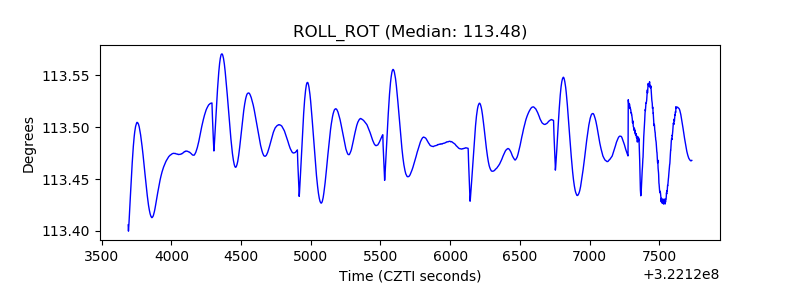 |
| _Roll_DEC | 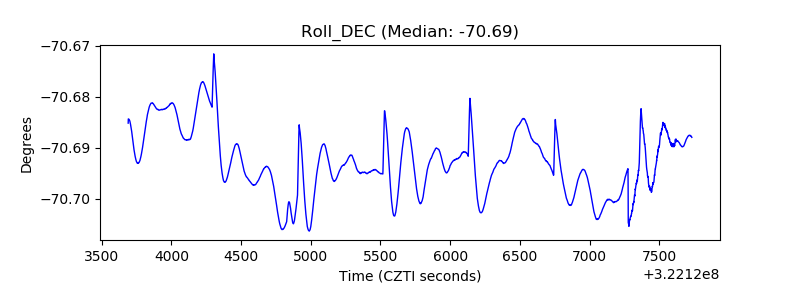 |
| _Roll_RA |  |
| Veto Counter | 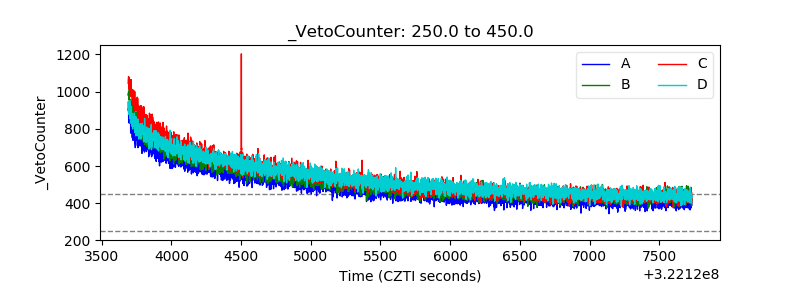 |