| Param | Original file | Final file |
|---|---|---|
| Filename | modeM0/AS1A07_067T01_9000003578cztM0_level2.fits | modeM0/AS1A07_067T01_9000003578cztM0_level2_quad_clean.evt |
| Size (bytes) | 1,738,768,320 | 1,422,930,240 |
| Size | 1.6 GB | 1.3 GB |
| Events in quadrant A | 11,003,022 | 8,272,704 |
| Events in quadrant B | 10,531,782 | 8,323,544 |
| Events in quadrant C | 10,562,022 | 7,906,578 |
| Events in quadrant D | 8,395,232 | 6,438,296 |
| Mode M9 | |||
|---|---|---|---|
| Quadrant | BADHDUFLAG | Total packets | Discarded packets |
| A | 0 | 277 | 0 |
| B | 0 | 278 | 0 |
| C | 0 | 278 | 0 |
| D | 0 | 278 | 0 |
| Mode SS | |||
|---|---|---|---|
| Quadrant | BADHDUFLAG | Total packets | Discarded packets |
| A | 0 | 3618 | 0 |
| B | 0 | 3618 | 0 |
| C | 0 | 3618 | 0 |
| D | 0 | 3618 | 0 |
| Mode M0 | |||
|---|---|---|---|
| Quadrant | BADHDUFLAG | Total packets | Discarded packets |
| A | 0 | 367134 | 0 |
| B | 0 | 368872 | 0 |
| C | 0 | 394216 | 0 |
| D | 0 | 661640 | 0 |
| Quadrant | Total seconds | Saturated seconds | Saturation percentage |
|---|---|---|---|
| A | 177355 | 2136 | 1.204364% |
| B | 177354 | 2568 | 1.447952% |
| C | 177354 | 4850 | 2.734644% |
| D | 177354 | 35984 | 20.289365% |
Noise dominated data is calculated using 1-second bins in cleaned event files. If a bin has >2000 counts, and if more than 50% of those come from <1% of pixels, then it is considered to be noise-dominated and hence unusable.
| Quadrant | # 1 sec bins | Bins with >0 counts | Bins with >2000 counts | High rate bins dominated by noise | Noise dominated (total time) | Noise dominated (detector-on time) | Marked lightcurve |
|---|---|---|---|---|---|---|---|
| A | 226289 | 177342 | 0 | 0 | 0.00% | 0.00% |  |
| B | 226289 | 177334 | 0 | 0 | 0.00% | 0.00% |  |
| C | 226289 | 177329 | 0 | 0 | 0.00% | 0.00% |  |
| D | 226289 | 177036 | 0 | 0 | 0.00% | 0.00% |  |
Top three noisy pixels from each quadrant. If the there are fewer than three noisy pixels in the level2.evt file, extra rows are filled as -1
| Pixel properties | Quadrant properties | ||||||
|---|---|---|---|---|---|---|---|
| Quadrant | DetID | PixID | Counts | Sigma | Mean | Median | Sigma |
| A | 0 | 29 | 10432 | 11.04 | 2866 | 2690 | 701.4 |
| A | 7 | 110 | 8891 | 8.84 | 2866 | 2690 | 701.4 |
| A | 9 | 19 | 8221 | 7.89 | 2866 | 2690 | 701.4 |
| B | 2 | 9 | 8583 | 10.93 | 2781 | 2654 | 542.2 |
| B | 2 | 8 | 7043 | 8.09 | 2781 | 2654 | 542.2 |
| B | 5 | 128 | 6826 | 7.69 | 2781 | 2654 | 542.2 |
| C | 12 | 241 | 7473 | 6.86 | 2793 | 2612 | 708.9 |
| C | 3 | 126 | 7186 | 6.45 | 2793 | 2612 | 708.9 |
| C | 9 | 209 | 7181 | 6.44 | 2793 | 2612 | 708.9 |
| D | 3 | 14 | 6178 | 6.3 | 2397 | 2183 | 634.3 |
| D | 6 | 231 | 5980 | 5.99 | 2397 | 2183 | 634.3 |
| D | 6 | 67 | 5815 | 5.73 | 2397 | 2183 | 634.3 |
Histogram calculated using DETX and DETY for each event in the final _common_clean file
| Quadrant A | 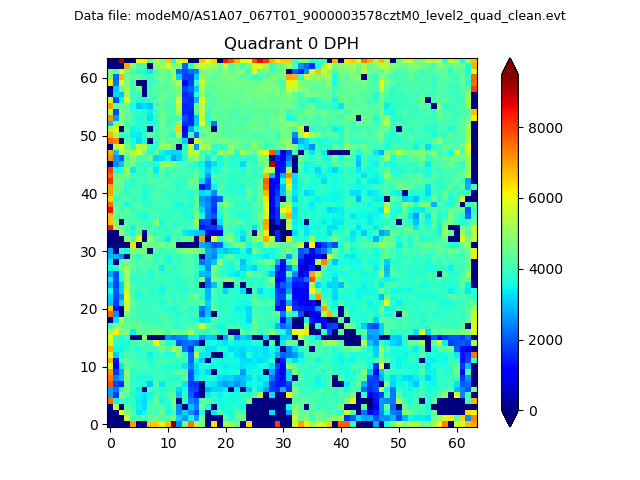 |
 |
Quadrant B |
|---|---|---|---|
| Quadrant D | 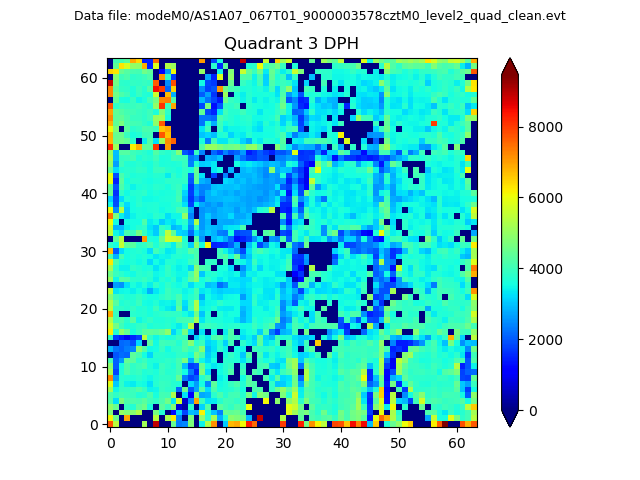 |
 |
Quadrant C |
| Plot type | Count rate plots | Images |
|---|---|---|
| Comparison with Poisson distribution Blue bars denote a histogram of data divided into 1 sec bins. Red curve is a Poisson curve with rate = median count rate of data. |
 |
 |
| Quadrant-wise count rates Data is divided into 100 sec bins |
 |
|
| Module-wise count rates for Quadrant A Data is divided into 100 sec bins |
 |
 |
| Module-wise count rates for Quadrant B Data is divided into 100 sec bins |
 |
 |
| Module-wise count rates for Quadrant C Data is divided into 100 sec bins |
 |
 |
| Module-wise count rates for Quadrant D Data is divided into 100 sec bins |
 |
 |
| Parameter | Plot |
|---|---|
| CZT HV Monitor |  |
| D_VDD |  |
| Temperature 1 |  |
| Veto HV Monitor |  |
| Veto LLD |  |
| Alpha Counter |  |
| _CPM_Rate |  |
| CZT Counter | 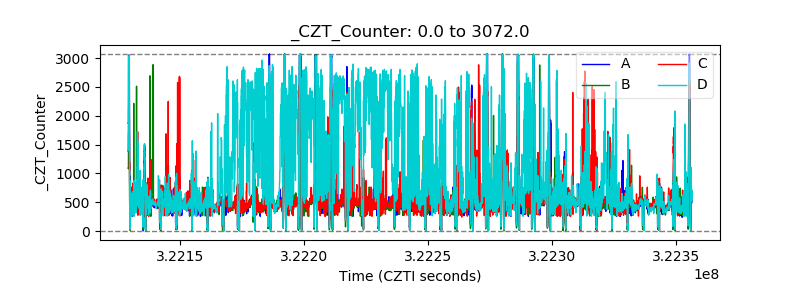 |
| +2.5 Volts monitor |  |
| +5 Volts monitor |  |
| _ROLL_ROT |  |
| _Roll_DEC |  |
| _Roll_RA |  |
| Veto Counter |  |