| Param | Original file | Final file |
|---|---|---|
| Filename | modeM0/AS1A07_067T01_9000003578_24159cztM0_level2.evt | modeM0/AS1A07_067T01_9000003578_24159cztM0_level2_quad_clean.evt |
| Size (bytes) | 103,472,640 | 29,557,440 |
| Size | 98.7 MB | 28.2 MB |
| Events in quadrant A | 764,784 | 201,560 |
| Events in quadrant B | 758,375 | 202,602 |
| Events in quadrant C | 758,789 | 193,656 |
| Events in quadrant D | 753,564 | 192,459 |
| Mode M9 | |||
|---|---|---|---|
| Quadrant | BADHDUFLAG | Total packets | Discarded packets |
| A | 0 | 9 | 0 |
| B | 0 | 9 | 0 |
| C | 0 | 9 | 0 |
| D | 0 | 9 | 0 |
| Mode SS | |||
|---|---|---|---|
| Quadrant | BADHDUFLAG | Total packets | Discarded packets |
| A | 0 | 28 | 0 |
| B | 0 | 28 | 0 |
| C | 0 | 28 | 0 |
| D | 0 | 28 | 0 |
| Mode M0 | |||
|---|---|---|---|
| Quadrant | BADHDUFLAG | Total packets | Discarded packets |
| A | 0 | 2996 | 2 |
| B | 0 | 2981 | 1 |
| C | 0 | 3026 | 1 |
| D | 0 | 3005 | 1 |
| Quadrant | Total seconds | Saturated seconds | Saturation percentage |
|---|---|---|---|
| A | 1401 | 15 | 1.070664% |
| B | 1401 | 19 | 1.356174% |
| C | 1401 | 16 | 1.142041% |
| D | 1401 | 5 | 0.356888% |
Noise dominated data is calculated using 1-second bins in cleaned event files. If a bin has >2000 counts, and if more than 50% of those come from <1% of pixels, then it is considered to be noise-dominated and hence unusable.
| Quadrant | # 1 sec bins | Bins with >0 counts | Bins with >2000 counts | High rate bins dominated by noise | Noise dominated (total time) | Noise dominated (detector-on time) | Marked lightcurve |
|---|---|---|---|---|---|---|---|
| A | 1401 | 1401 | 0 | 0 | 0.00% | 0.00% | 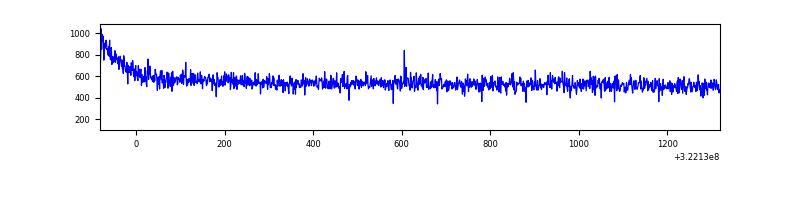 |
| B | 1401 | 1401 | 1 | 1 | 0.07% | 0.07% | 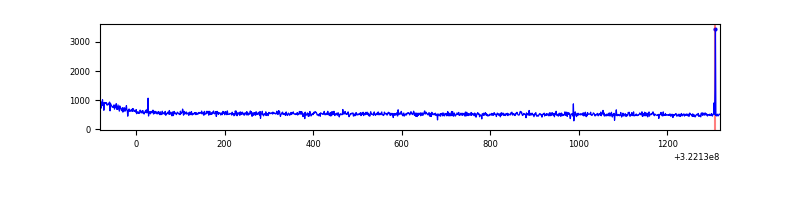 |
| C | 1401 | 1401 | 0 | 0 | 0.00% | 0.00% | 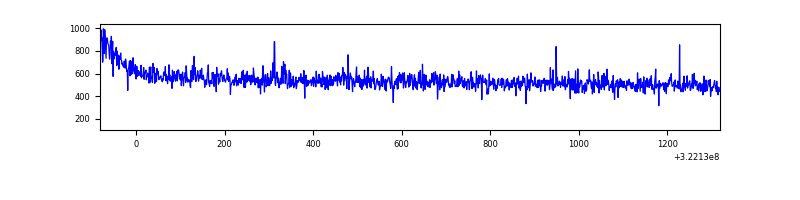 |
| D | 1401 | 1401 | 0 | 0 | 0.00% | 0.00% | 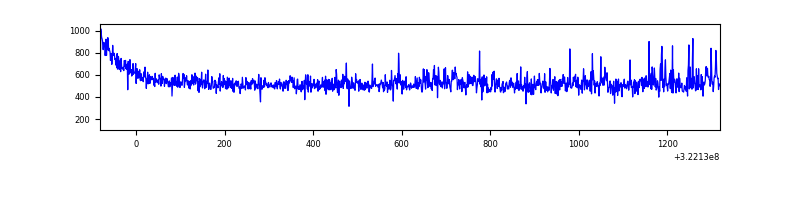 |
Top three noisy pixels from each quadrant. If the there are fewer than three noisy pixels in the level2.evt file, extra rows are filled as -1
| Pixel properties | Quadrant properties | ||||||
|---|---|---|---|---|---|---|---|
| Quadrant | DetID | PixID | Counts | Sigma | Mean | Median | Sigma |
| A | 13 | 254 | 2127 | 47.96 | 198 | 195 | 40.3 |
| A | 0 | 226 | 1716 | 37.76 | 198 | 195 | 40.3 |
| A | 3 | 137 | 1544 | 33.49 | 198 | 195 | 40.3 |
| B | 4 | 216 | 5845 | 147.87 | 192 | 188 | 38.3 |
| B | 12 | 111 | 4121 | 102.81 | 192 | 188 | 38.3 |
| B | 11 | 111 | 3662 | 90.81 | 192 | 188 | 38.3 |
| C | 14 | 238 | 30238 | 681.32 | 184 | 186 | 44.1 |
| C | 2 | 16 | 7399 | 163.53 | 184 | 186 | 44.1 |
| C | 13 | 61 | 1293 | 25.1 | 184 | 186 | 44.1 |
| D | 7 | 238 | 25762 | 551.86 | 189 | 185 | 46.3 |
| D | 1 | 52 | 8036 | 169.4 | 189 | 185 | 46.3 |
| D | 2 | 234 | 4735 | 98.17 | 189 | 185 | 46.3 |
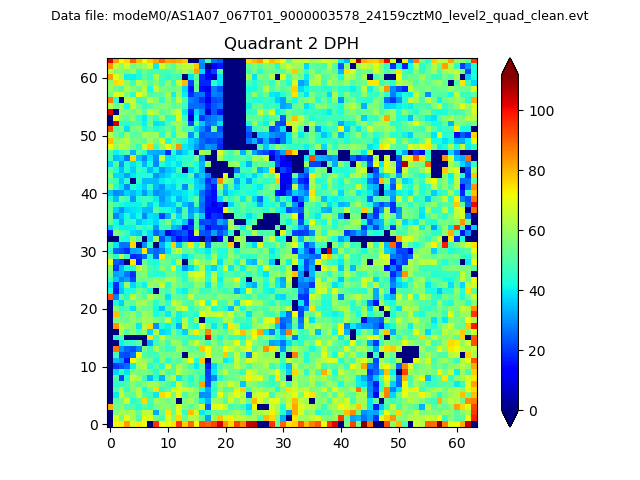
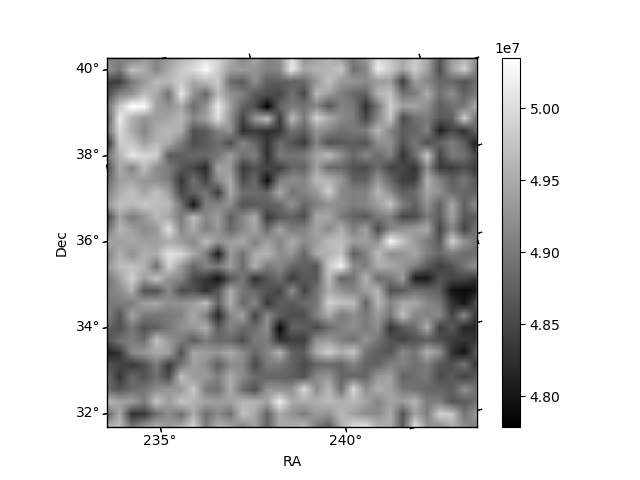
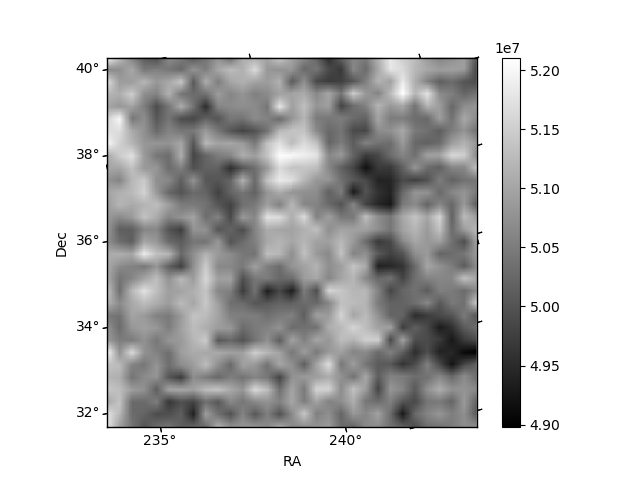
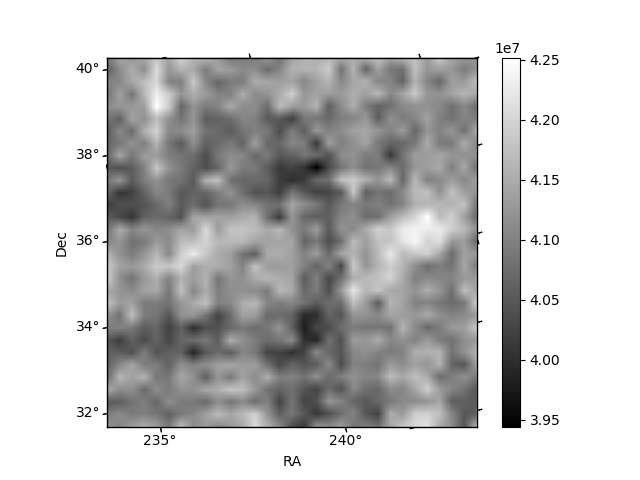
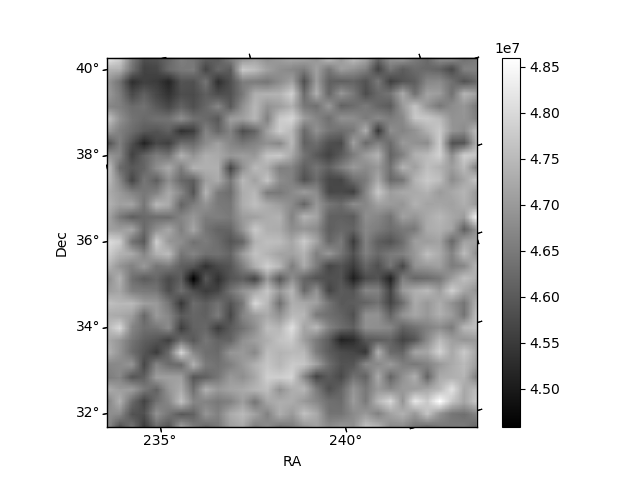
Histogram calculated using DETX and DETY for each event in the final _common_clean file
| Quadrant A | 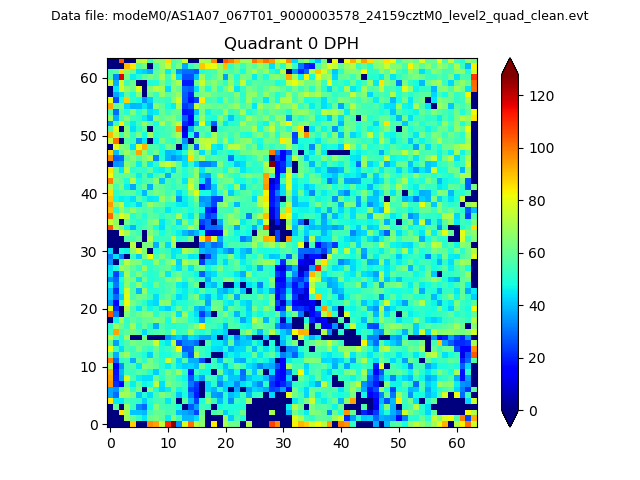 |
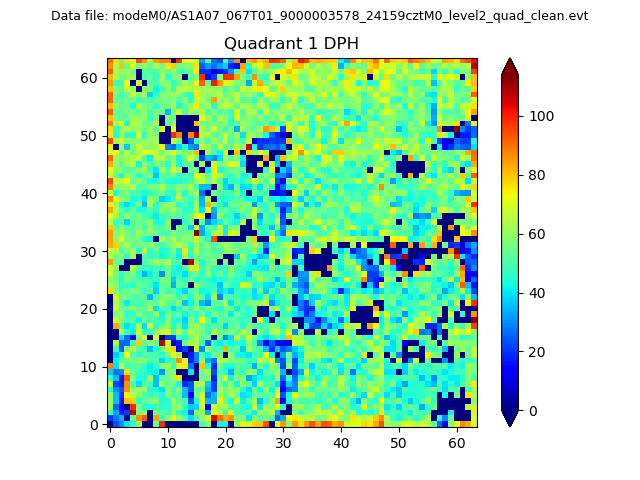 |
Quadrant B |
|---|---|---|---|
| Quadrant D | 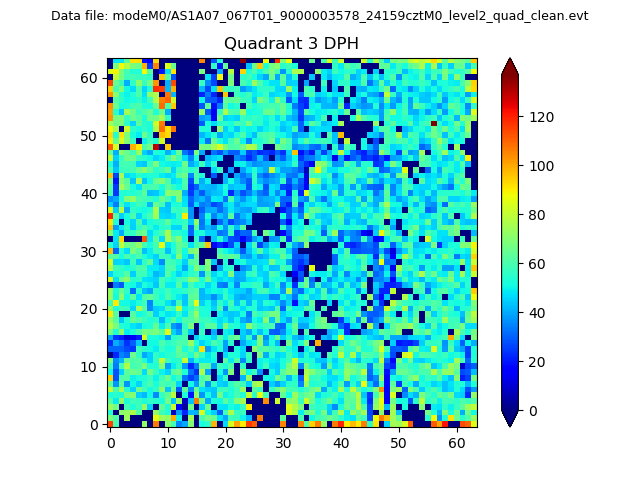 |
 |
Quadrant C |
| Plot type | Count rate plots | Images |
|---|---|---|
| Comparison with Poisson distribution Blue bars denote a histogram of data divided into 1 sec bins. Red curve is a Poisson curve with rate = median count rate of data. |
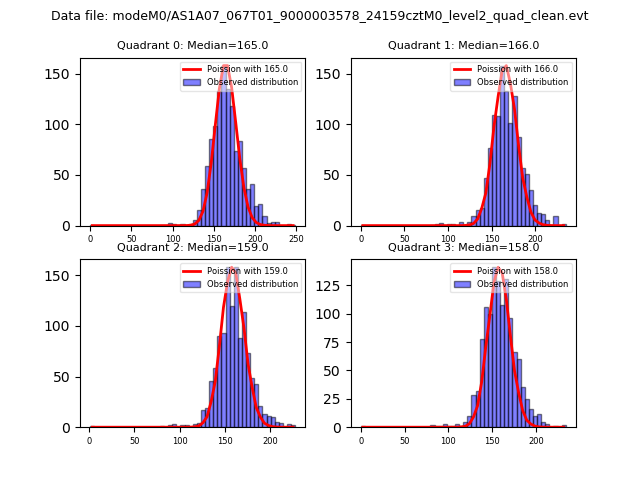 |
 |
| Quadrant-wise count rates Data is divided into 100 sec bins |
 |
|
| Module-wise count rates for Quadrant A Data is divided into 100 sec bins |
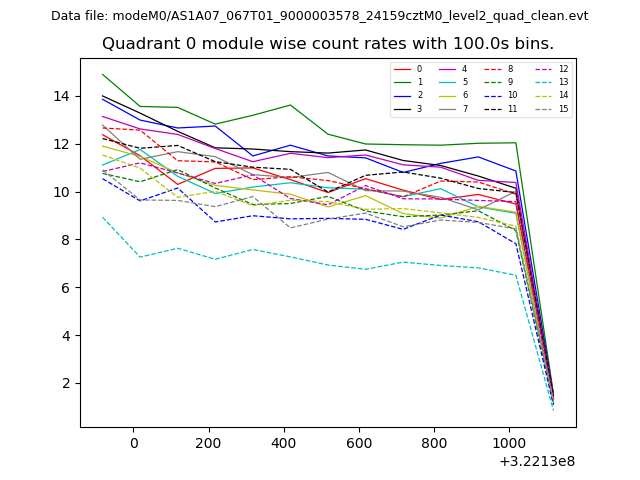 |
 |
| Module-wise count rates for Quadrant B Data is divided into 100 sec bins |
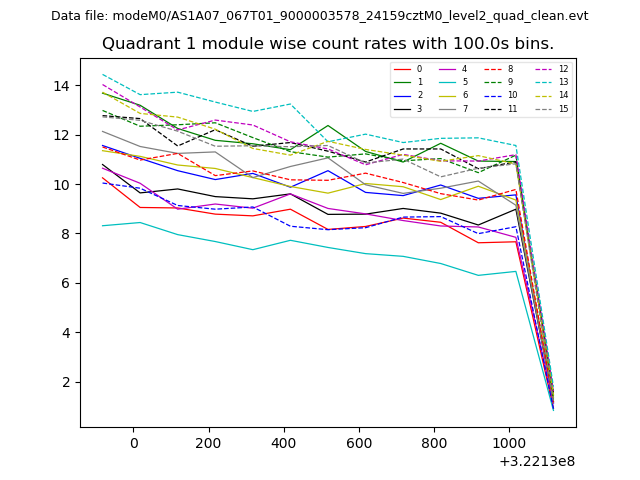 |
 |
| Module-wise count rates for Quadrant C Data is divided into 100 sec bins |
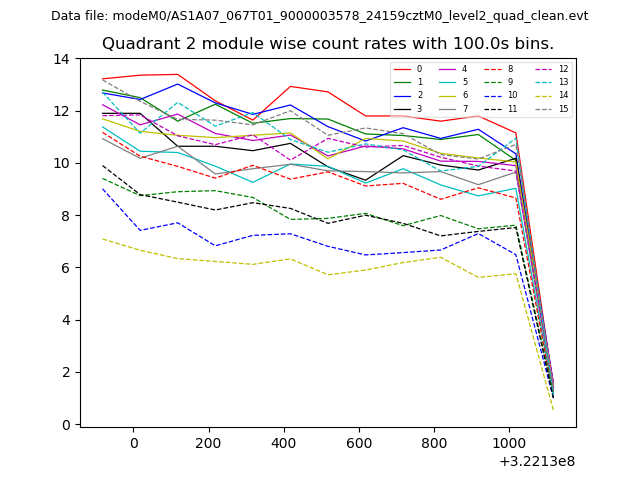 |
 |
| Module-wise count rates for Quadrant D Data is divided into 100 sec bins |
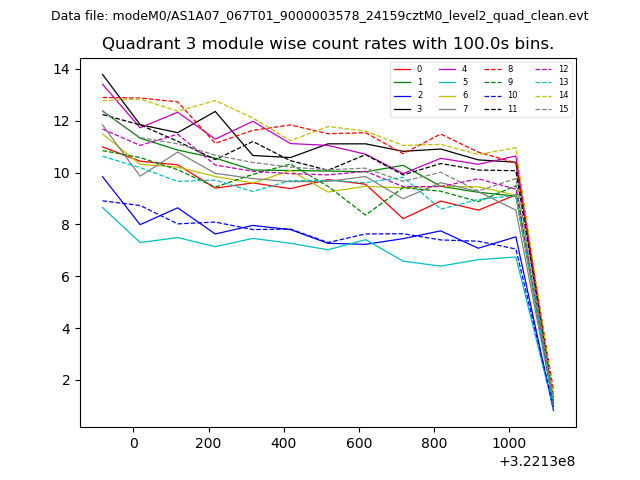 |
 |
| Parameter | Plot |
|---|---|
| CZT HV Monitor | 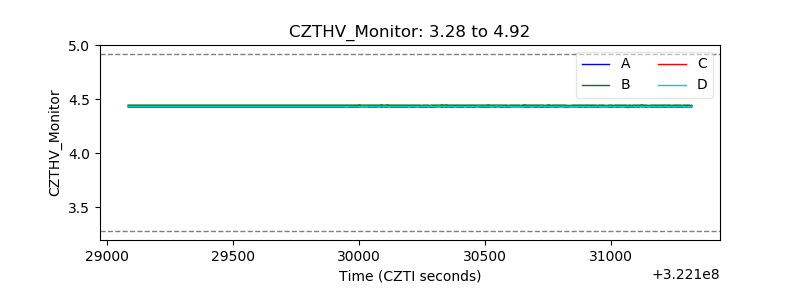 |
| D_VDD | 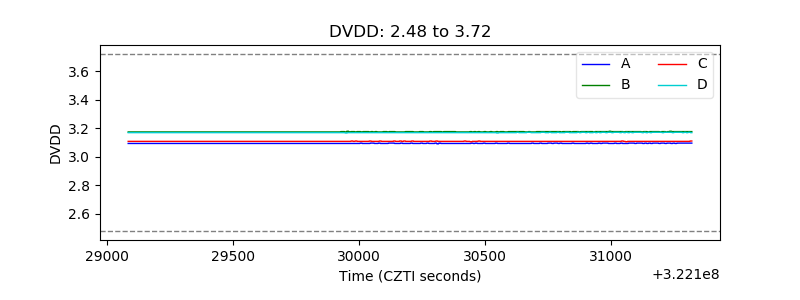 |
| Temperature 1 |  |
| Veto HV Monitor | 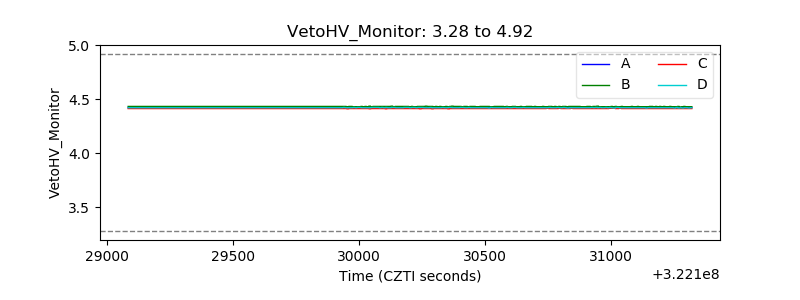 |
| Veto LLD | 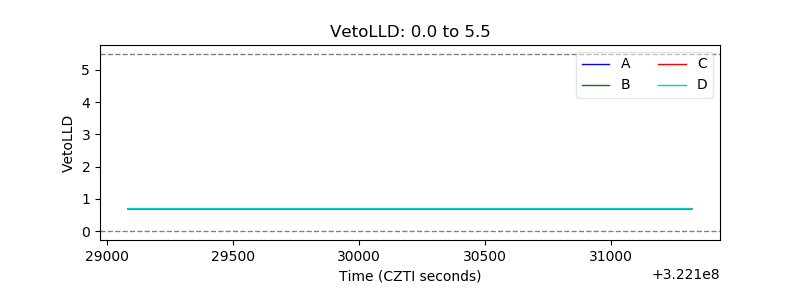 |
| Alpha Counter | 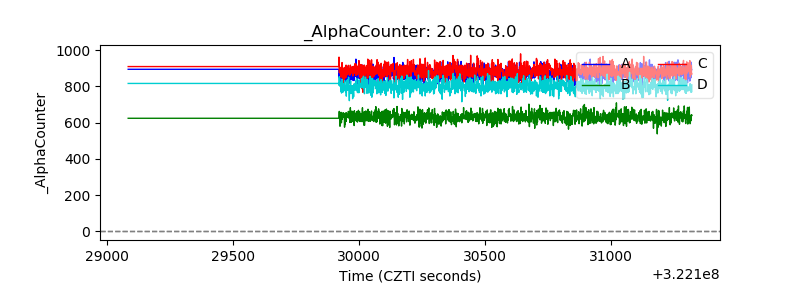 |
| _CPM_Rate | 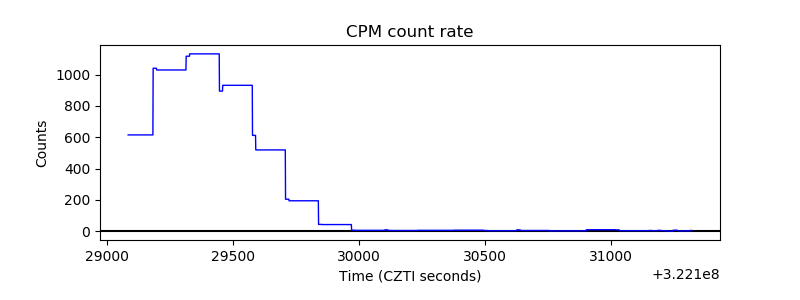 |
| CZT Counter |  |
| +2.5 Volts monitor |  |
| +5 Volts monitor |  |
| _ROLL_ROT | 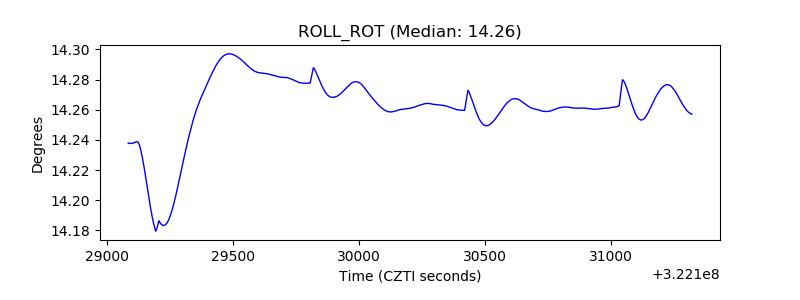 |
| _Roll_DEC | 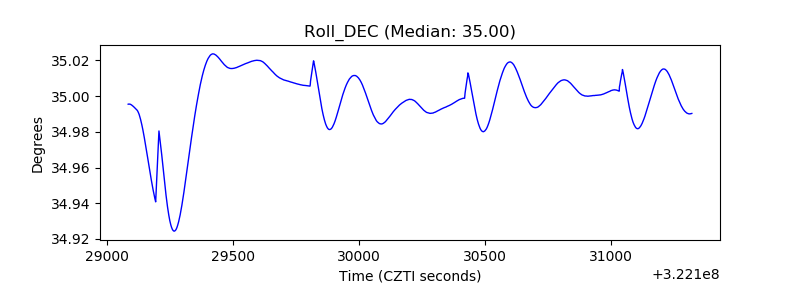 |
| _Roll_RA | 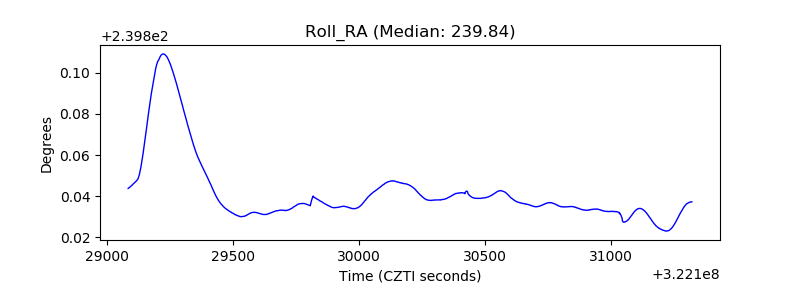 |
| Veto Counter | 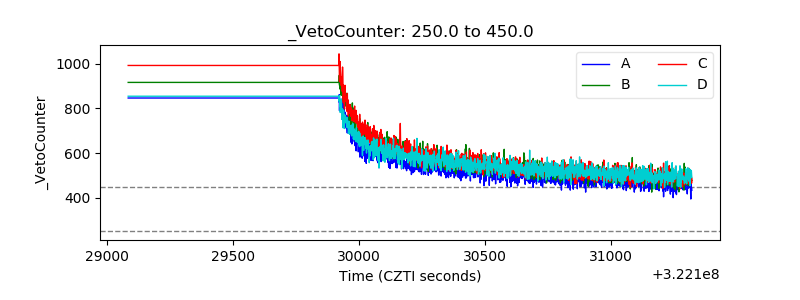 |