| Param | Original file | Final file |
|---|---|---|
| Filename | modeM0/AS1A07_067T01_9000003578_24162cztM0_level2.evt | modeM0/AS1A07_067T01_9000003578_24162cztM0_level2_quad_clean.evt |
| Size (bytes) | 528,868,800 | 85,080,960 |
| Size | 504.4 MB | 81.1 MB |
| Events in quadrant A | 3,708,627 | 516,480 |
| Events in quadrant B | 3,750,435 | 522,699 |
| Events in quadrant C | 4,282,663 | 504,940 |
| Events in quadrant D | 3,760,240 | 504,746 |
| Mode M9 | |||
|---|---|---|---|
| Quadrant | BADHDUFLAG | Total packets | Discarded packets |
| A | 0 | 2 | 0 |
| B | 0 | 3 | 0 |
| C | 0 | 3 | 0 |
| D | 0 | 3 | 0 |
| Mode SS | |||
|---|---|---|---|
| Quadrant | BADHDUFLAG | Total packets | Discarded packets |
| A | 0 | 154 | 0 |
| B | 0 | 154 | 0 |
| C | 0 | 154 | 0 |
| D | 0 | 154 | 0 |
| Mode M0 | |||
|---|---|---|---|
| Quadrant | BADHDUFLAG | Total packets | Discarded packets |
| A | 0 | 15693 | 4 |
| B | 0 | 15804 | 4 |
| C | 0 | 17416 | 4 |
| D | 0 | 15998 | 4 |
| Quadrant | Total seconds | Saturated seconds | Saturation percentage |
|---|---|---|---|
| A | 7578 | 163 | 2.150963% |
| B | 7578 | 166 | 2.190552% |
| C | 7578 | 366 | 4.829770% |
| D | 7578 | 131 | 1.728688% |
Noise dominated data is calculated using 1-second bins in cleaned event files. If a bin has >2000 counts, and if more than 50% of those come from <1% of pixels, then it is considered to be noise-dominated and hence unusable.
| Quadrant | # 1 sec bins | Bins with >0 counts | Bins with >2000 counts | High rate bins dominated by noise | Noise dominated (total time) | Noise dominated (detector-on time) | Marked lightcurve |
|---|---|---|---|---|---|---|---|
| A | 7863 | 7580 | 0 | 0 | 0.00% | 0.00% | 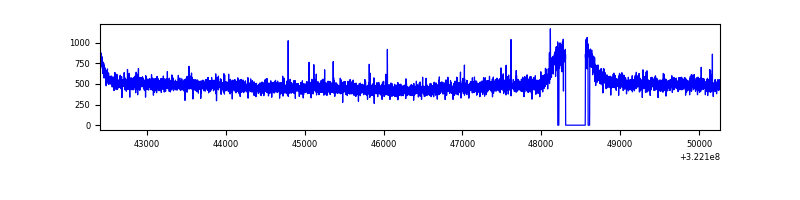 |
| B | 7863 | 7580 | 2 | 2 | 0.03% | 0.03% | 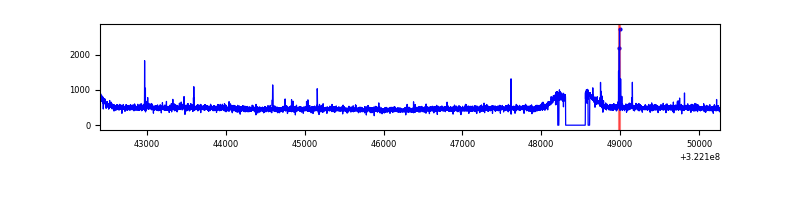 |
| C | 7863 | 7579 | 100 | 100 | 1.27% | 1.32% | 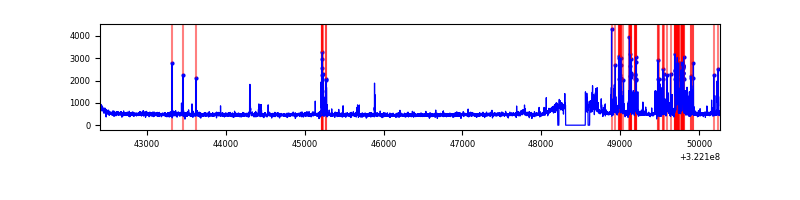 |
| D | 7863 | 7580 | 3 | 3 | 0.04% | 0.04% | 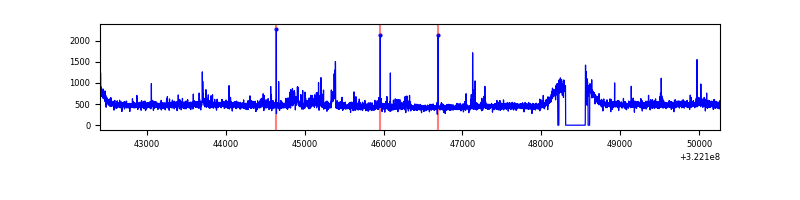 |
Top three noisy pixels from each quadrant. If the there are fewer than three noisy pixels in the level2.evt file, extra rows are filled as -1
| Pixel properties | Quadrant properties | ||||||
|---|---|---|---|---|---|---|---|
| Quadrant | DetID | PixID | Counts | Sigma | Mean | Median | Sigma |
| A | 13 | 254 | 12502 | 60.15 | 960 | 940 | 192.2 |
| A | 3 | 137 | 8516 | 39.41 | 960 | 940 | 192.2 |
| A | 0 | 226 | 8490 | 39.28 | 960 | 940 | 192.2 |
| B | 12 | 111 | 21933 | 114.79 | 947 | 923 | 183.0 |
| B | 11 | 111 | 19826 | 103.28 | 947 | 923 | 183.0 |
| B | 4 | 52 | 19097 | 99.3 | 947 | 923 | 183.0 |
| C | 2 | 16 | 541575 | 2546.04 | 906 | 907 | 212.4 |
| C | 14 | 238 | 143452 | 671.25 | 906 | 907 | 212.4 |
| C | 3 | 233 | 44593 | 205.72 | 906 | 907 | 212.4 |
| D | 8 | 195 | 140654 | 613.53 | 935 | 905 | 227.8 |
| D | 2 | 234 | 31875 | 135.96 | 935 | 905 | 227.8 |
| D | 1 | 52 | 23566 | 99.48 | 935 | 905 | 227.8 |
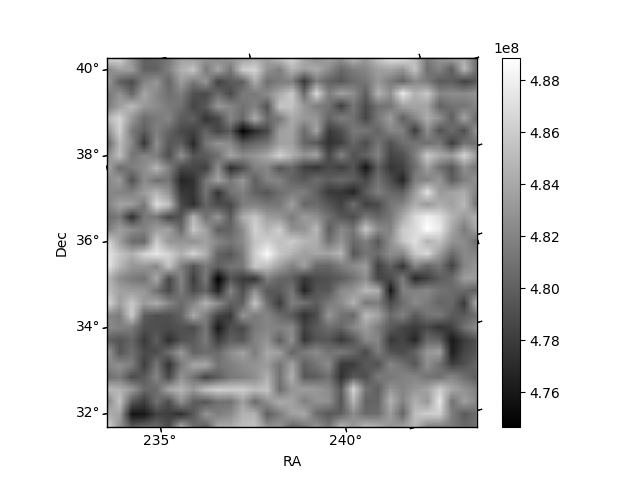
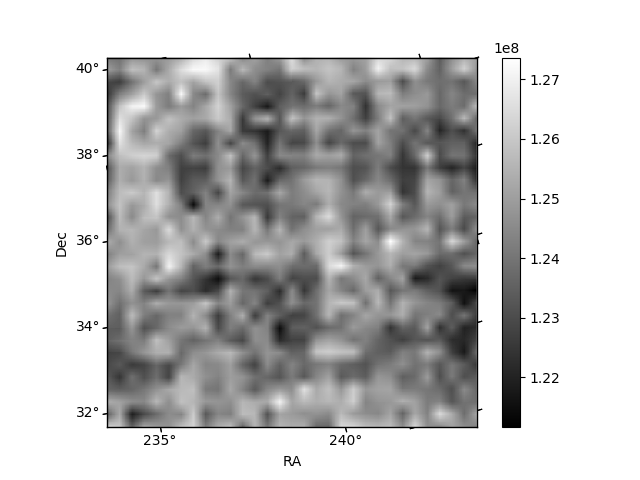
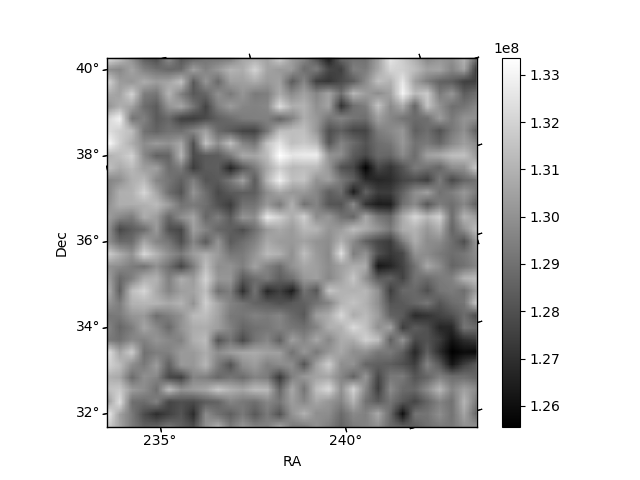
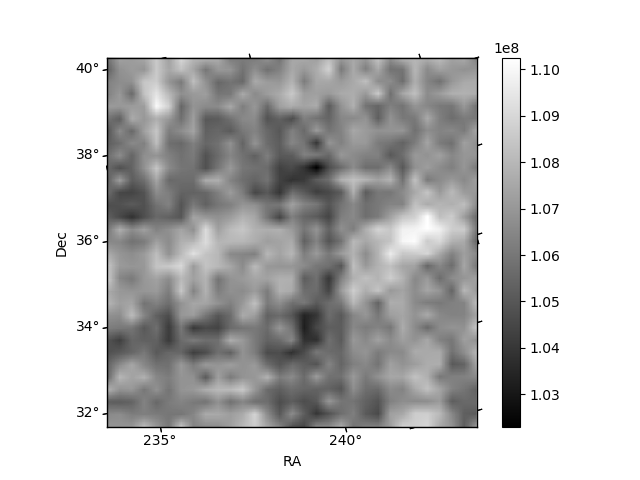
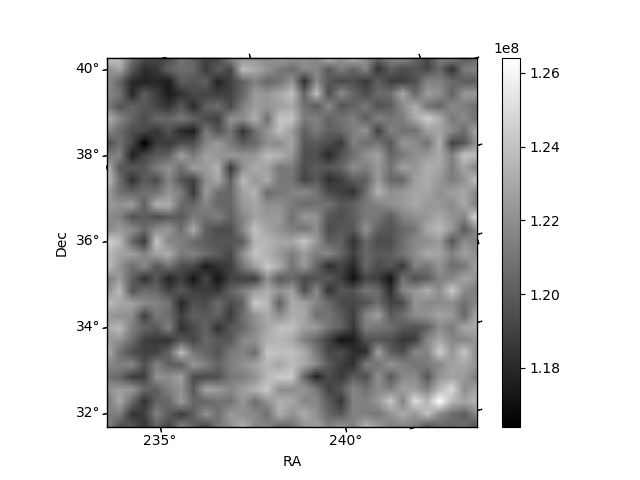
Histogram calculated using DETX and DETY for each event in the final _common_clean file
| Quadrant A | 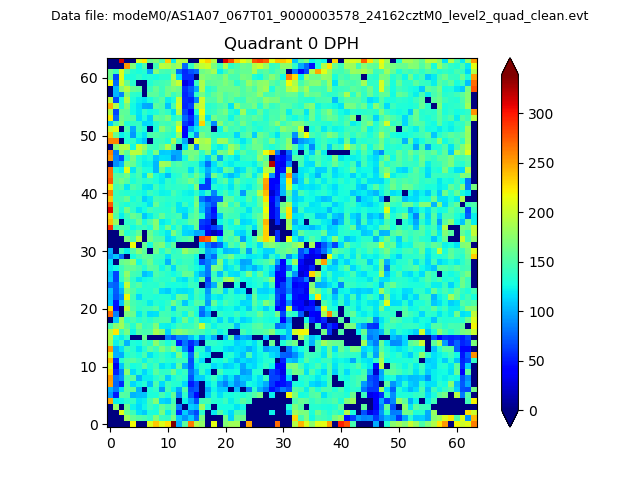 |
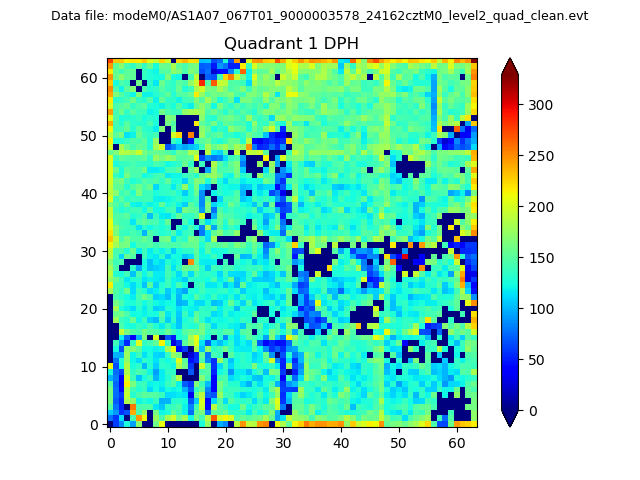 |
Quadrant B |
|---|---|---|---|
| Quadrant D | 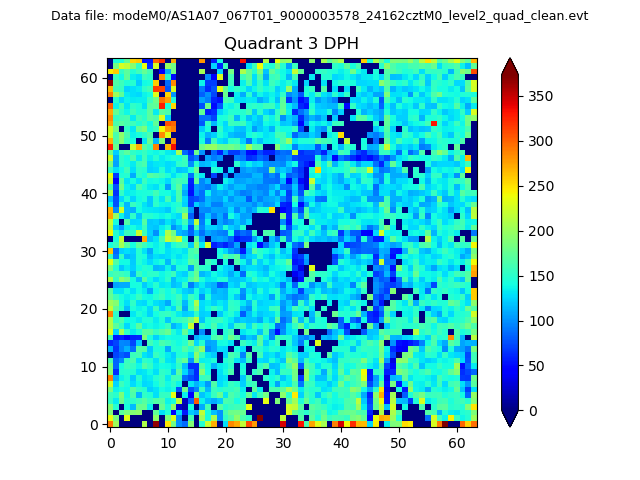 |
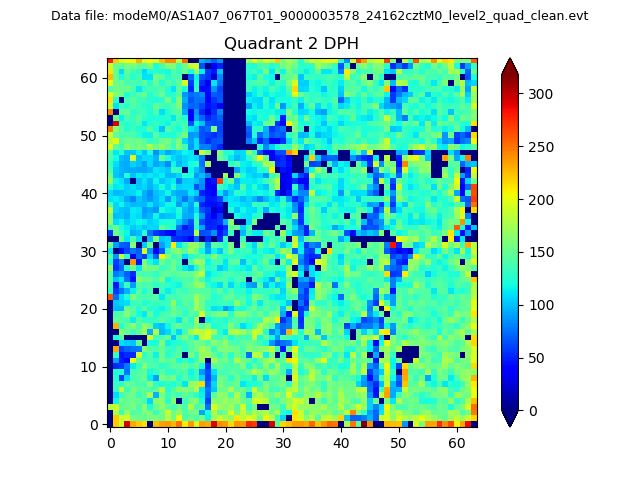 |
Quadrant C |
| Plot type | Count rate plots | Images |
|---|---|---|
| Comparison with Poisson distribution Blue bars denote a histogram of data divided into 1 sec bins. Red curve is a Poisson curve with rate = median count rate of data. |
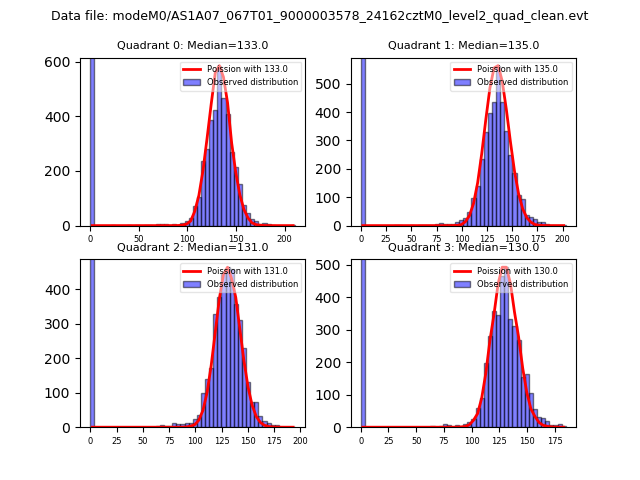 |
 |
| Quadrant-wise count rates Data is divided into 100 sec bins |
 |
|
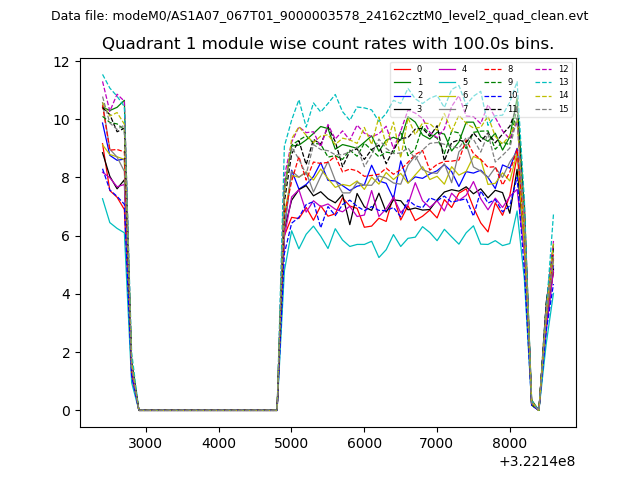
| Module-wise count rates for Quadrant A Data is divided into 100 sec bins |
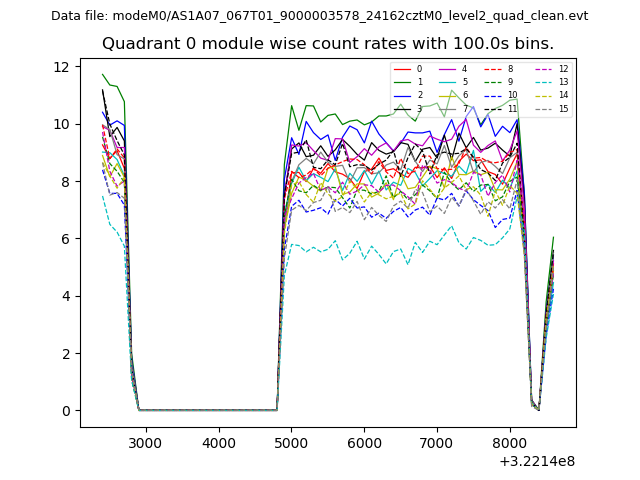 |
 |
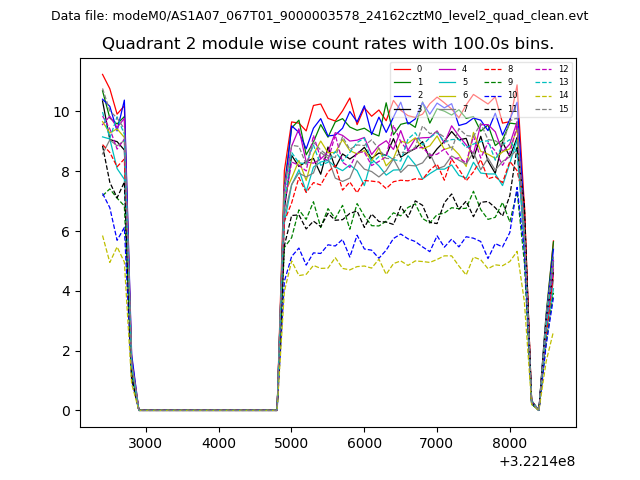
| Module-wise count rates for Quadrant B Data is divided into 100 sec bins |
 |
 |
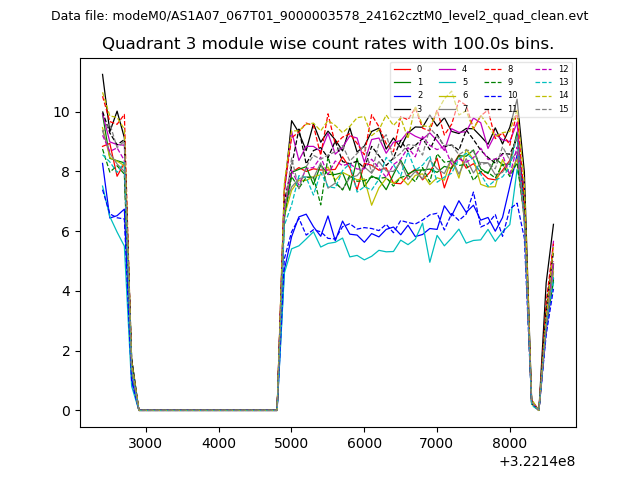
| Module-wise count rates for Quadrant C Data is divided into 100 sec bins |
 |
 |
| Module-wise count rates for Quadrant D Data is divided into 100 sec bins |
 |
 |
| Parameter | Plot |
|---|---|
| CZT HV Monitor | 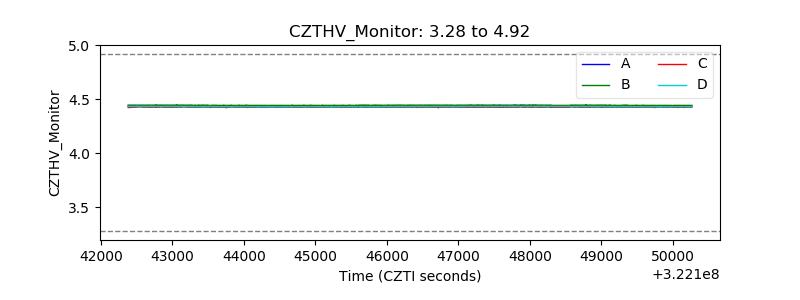 |
| D_VDD | 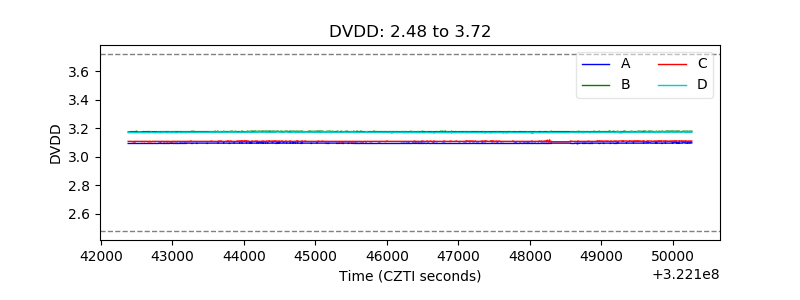 |
| Temperature 1 | 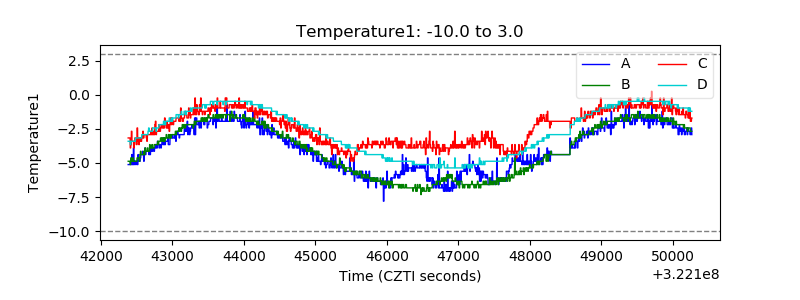 |
| Veto HV Monitor | 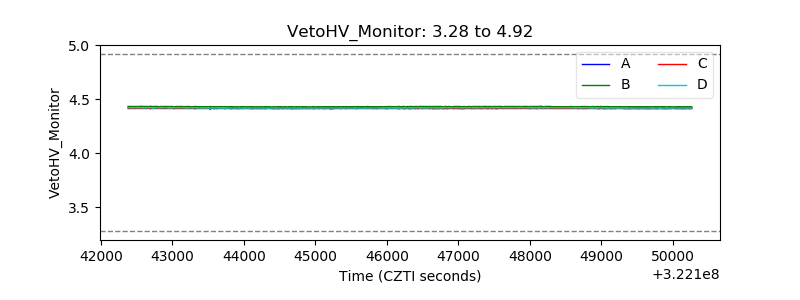 |
| Veto LLD | 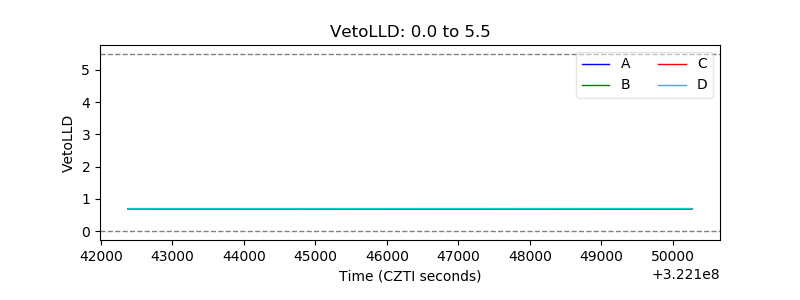 |
| Alpha Counter | 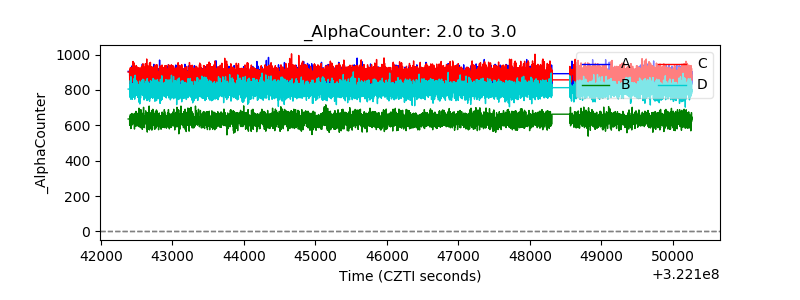 |
| _CPM_Rate | 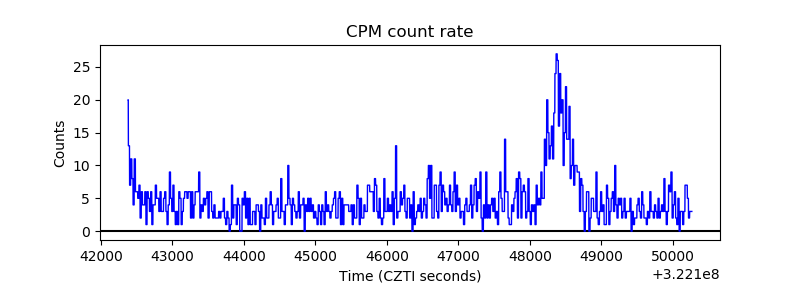 |
| CZT Counter |  |
| +2.5 Volts monitor |  |
| +5 Volts monitor |  |
| _ROLL_ROT | 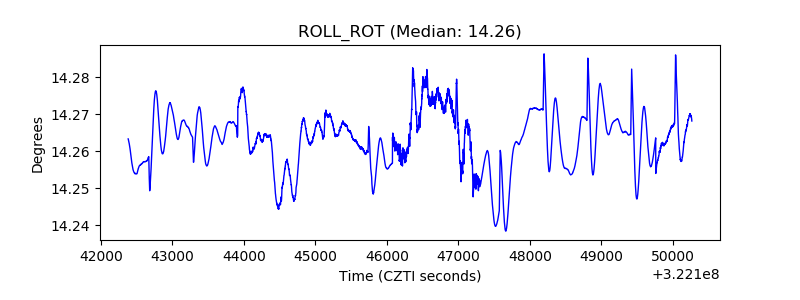 |
| _Roll_DEC | 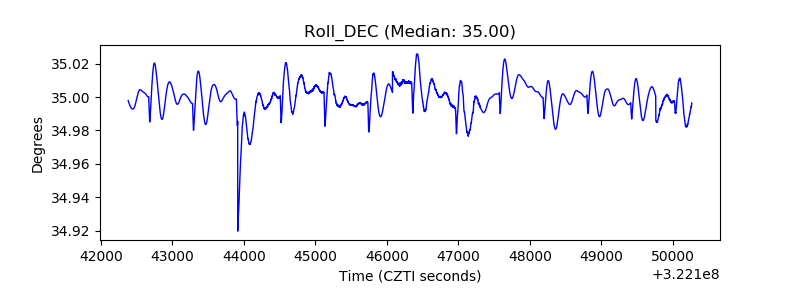 |
| _Roll_RA |  |
| Veto Counter | 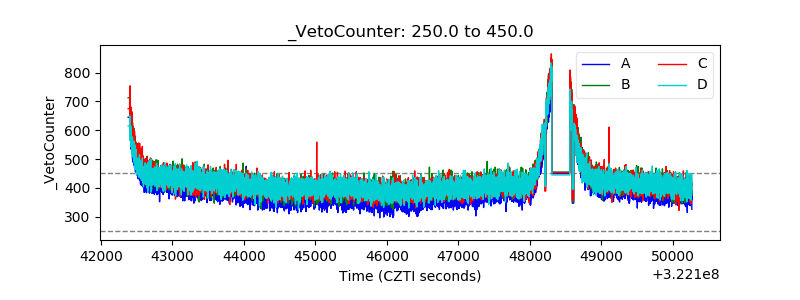 |