| Param | Original file | Final file |
|---|---|---|
| Filename | modeM0/AS1A07_067T01_9000003578_24163cztM0_level2.evt | modeM0/AS1A07_067T01_9000003578_24163cztM0_level2_quad_clean.evt |
| Size (bytes) | 536,235,840 | 82,509,120 |
| Size | 511.4 MB | 78.7 MB |
| Events in quadrant A | 3,733,134 | 496,935 |
| Events in quadrant B | 3,805,570 | 503,163 |
| Events in quadrant C | 4,295,000 | 486,640 |
| Events in quadrant D | 3,888,333 | 481,171 |
| Mode M9 | |||
|---|---|---|---|
| Quadrant | BADHDUFLAG | Total packets | Discarded packets |
| A | 0 | 2 | 0 |
| B | 0 | 3 | 0 |
| C | 0 | 3 | 0 |
| D | 0 | 3 | 0 |
| Mode SS | |||
|---|---|---|---|
| Quadrant | BADHDUFLAG | Total packets | Discarded packets |
| A | 0 | 156 | 0 |
| B | 0 | 156 | 0 |
| C | 0 | 156 | 0 |
| D | 0 | 156 | 0 |
| Mode M0 | |||
|---|---|---|---|
| Quadrant | BADHDUFLAG | Total packets | Discarded packets |
| A | 0 | 15886 | 3 |
| B | 0 | 16073 | 3 |
| C | 0 | 17568 | 3 |
| D | 0 | 16403 | 3 |
| Quadrant | Total seconds | Saturated seconds | Saturation percentage |
|---|---|---|---|
| A | 7627 | 198 | 2.596040% |
| B | 7626 | 237 | 3.107789% |
| C | 7626 | 397 | 5.205875% |
| D | 7626 | 190 | 2.491477% |
Noise dominated data is calculated using 1-second bins in cleaned event files. If a bin has >2000 counts, and if more than 50% of those come from <1% of pixels, then it is considered to be noise-dominated and hence unusable.
| Quadrant | # 1 sec bins | Bins with >0 counts | Bins with >2000 counts | High rate bins dominated by noise | Noise dominated (total time) | Noise dominated (detector-on time) | Marked lightcurve |
|---|---|---|---|---|---|---|---|
| A | 7817 | 7630 | 0 | 0 | 0.00% | 0.00% | 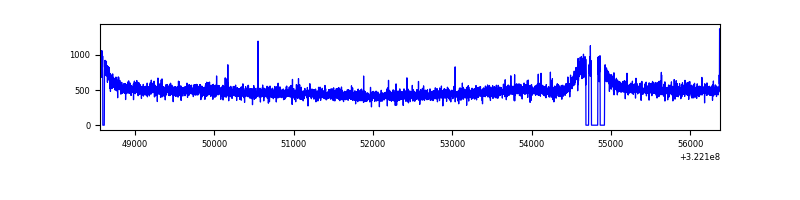 |
| B | 7816 | 7629 | 5 | 5 | 0.06% | 0.07% | 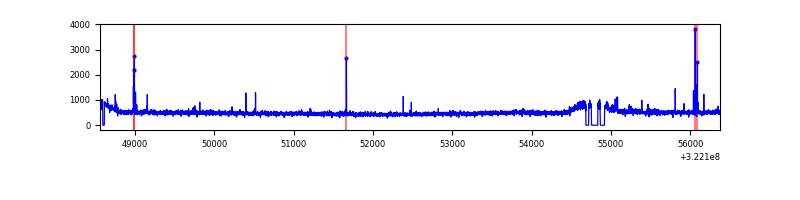 |
| C | 7816 | 7627 | 92 | 92 | 1.18% | 1.21% | 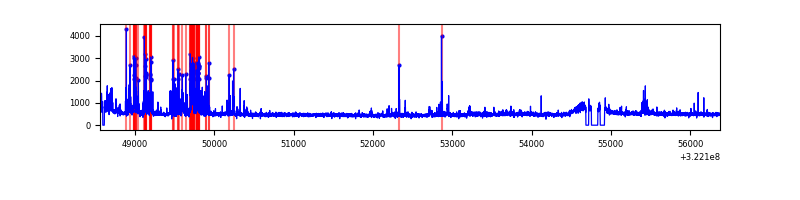 |
| D | 7816 | 7630 | 7 | 7 | 0.09% | 0.09% | 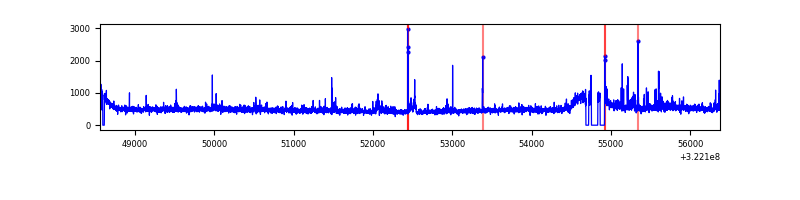 |
Top three noisy pixels from each quadrant. If the there are fewer than three noisy pixels in the level2.evt file, extra rows are filled as -1
| Pixel properties | Quadrant properties | ||||||
|---|---|---|---|---|---|---|---|
| Quadrant | DetID | PixID | Counts | Sigma | Mean | Median | Sigma |
| A | 13 | 254 | 12770 | 60.67 | 965 | 945 | 194.9 |
| A | 3 | 137 | 8685 | 39.71 | 965 | 945 | 194.9 |
| A | 0 | 226 | 8518 | 38.86 | 965 | 945 | 194.9 |
| B | 4 | 52 | 32413 | 170.54 | 953 | 928 | 184.6 |
| B | 0 | 190 | 22413 | 116.38 | 953 | 928 | 184.6 |
| B | 12 | 111 | 22304 | 115.79 | 953 | 928 | 184.6 |
| C | 2 | 16 | 549136 | 2586.69 | 908 | 913 | 211.9 |
| C | 14 | 238 | 142859 | 669.75 | 908 | 913 | 211.9 |
| C | 0 | 207 | 42209 | 194.85 | 908 | 913 | 211.9 |
| D | 8 | 195 | 187151 | 814.99 | 938 | 907 | 228.5 |
| D | 7 | 238 | 113470 | 492.57 | 938 | 907 | 228.5 |
| D | 2 | 234 | 35428 | 151.06 | 938 | 907 | 228.5 |
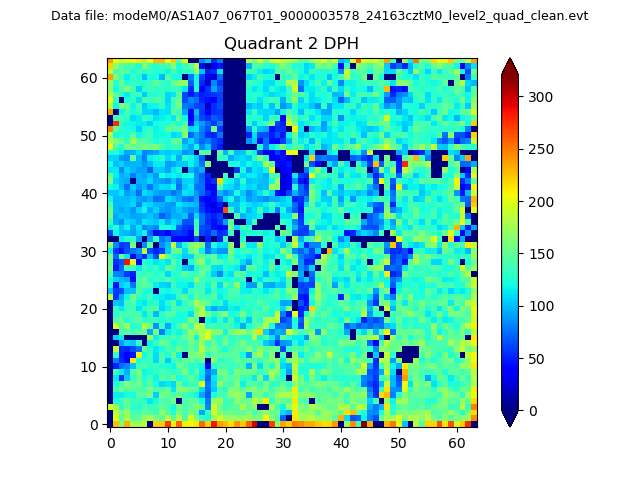
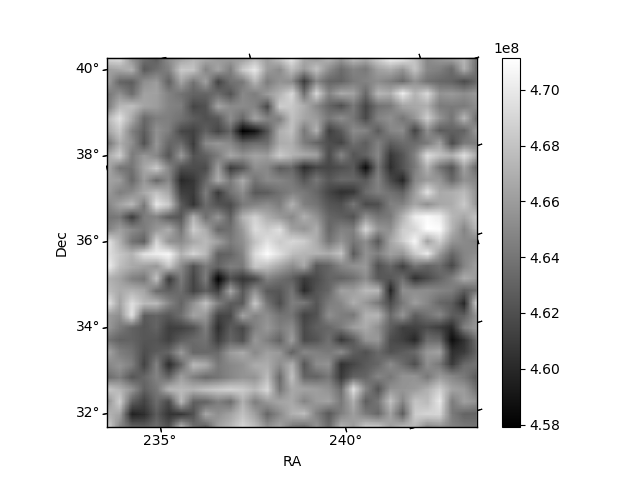
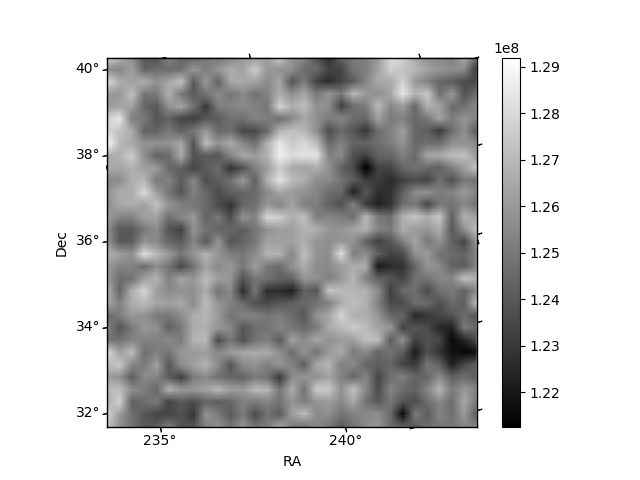
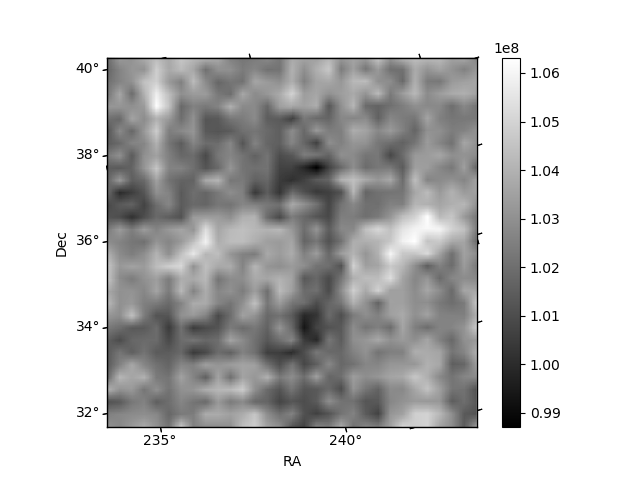
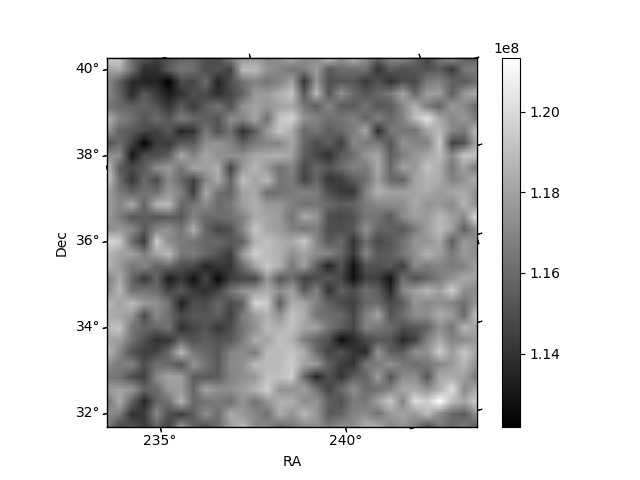
Histogram calculated using DETX and DETY for each event in the final _common_clean file
| Quadrant A | 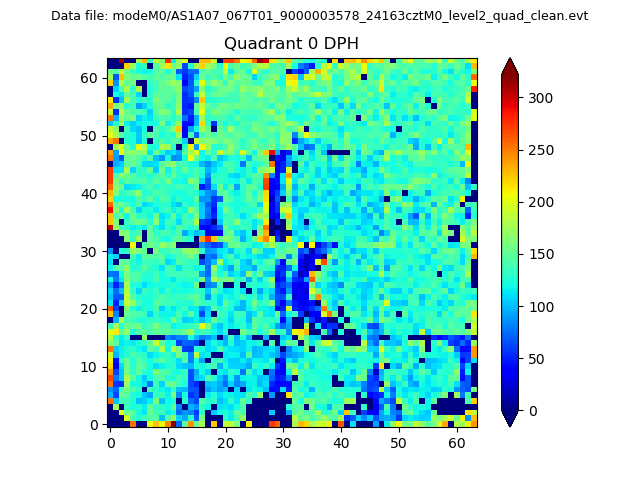 |
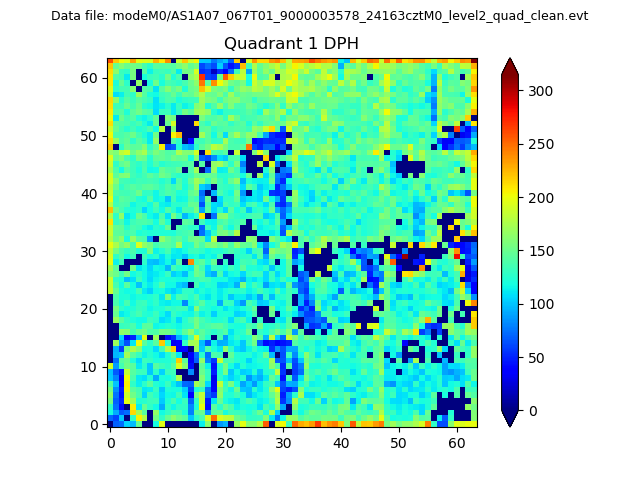 |
Quadrant B |
|---|---|---|---|
| Quadrant D | 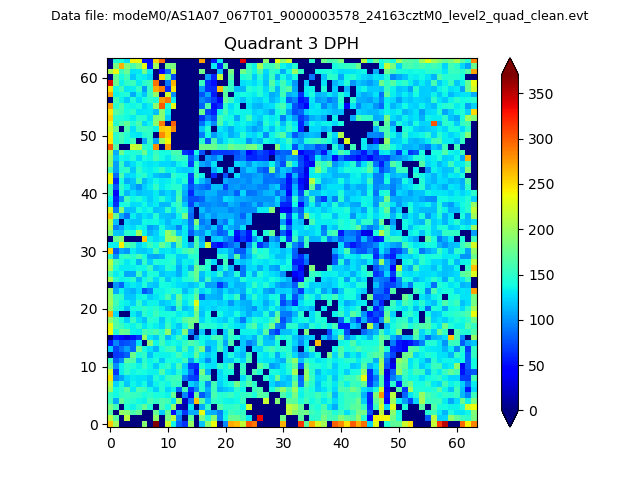 |
 |
Quadrant C |
| Plot type | Count rate plots | Images |
|---|---|---|
| Comparison with Poisson distribution Blue bars denote a histogram of data divided into 1 sec bins. Red curve is a Poisson curve with rate = median count rate of data. |
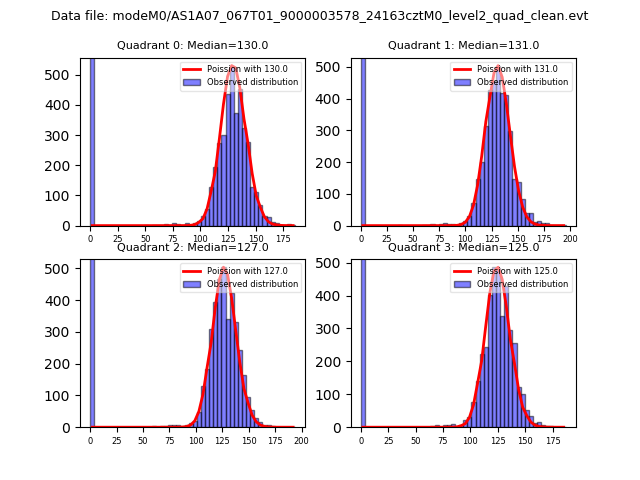 |
 |
| Quadrant-wise count rates Data is divided into 100 sec bins |
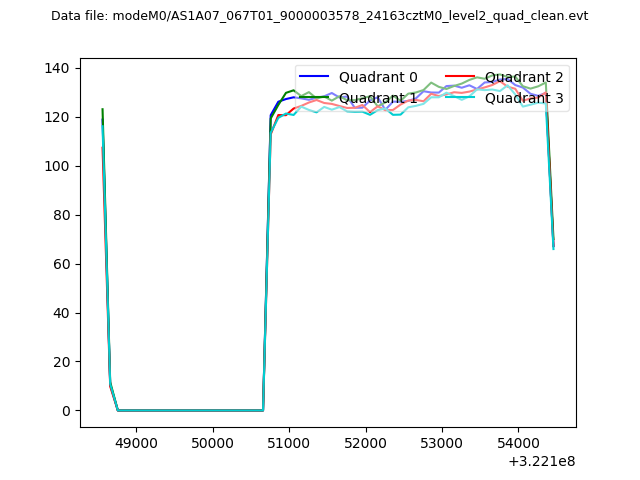 |
|
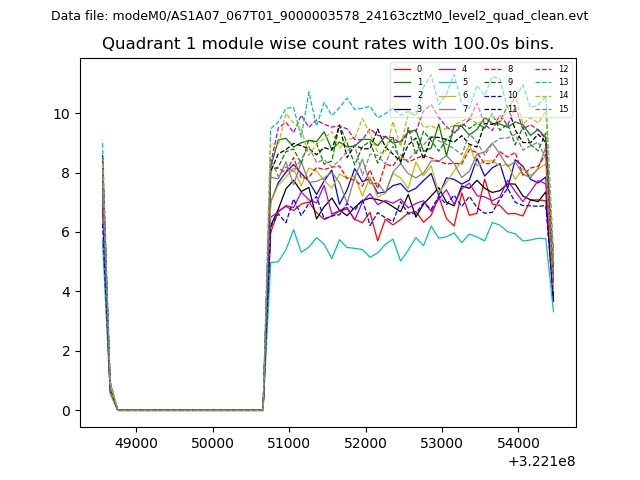
| Module-wise count rates for Quadrant A Data is divided into 100 sec bins |
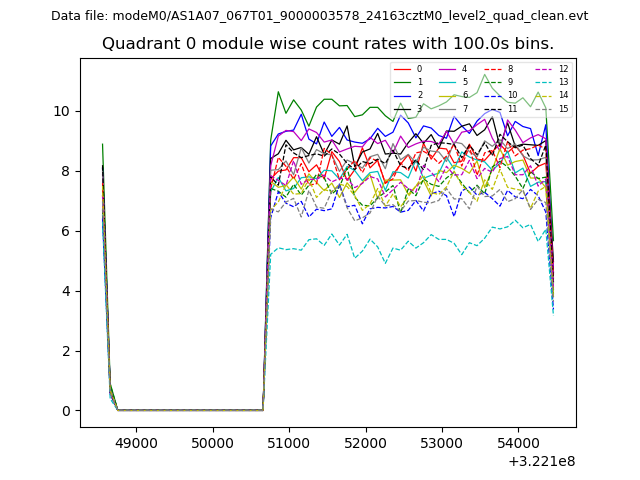 |
 |
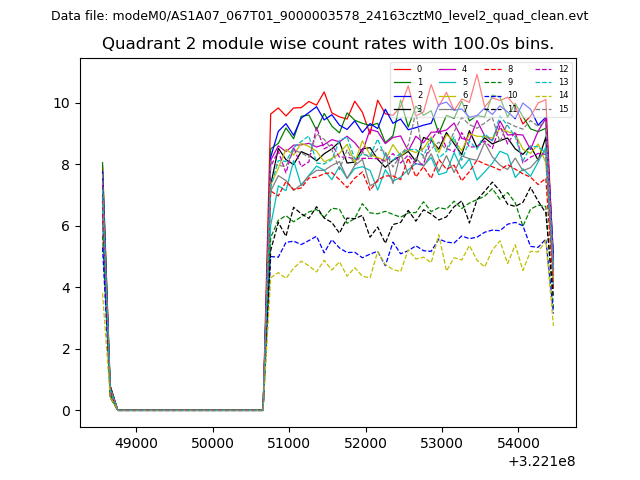
| Module-wise count rates for Quadrant B Data is divided into 100 sec bins |
 |
 |
| Module-wise count rates for Quadrant C Data is divided into 100 sec bins |
 |
 |
| Module-wise count rates for Quadrant D Data is divided into 100 sec bins |
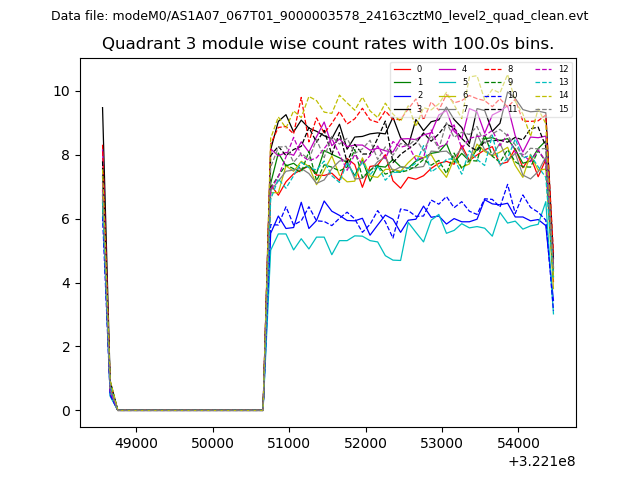 |
 |
| Parameter | Plot |
|---|---|
| CZT HV Monitor | 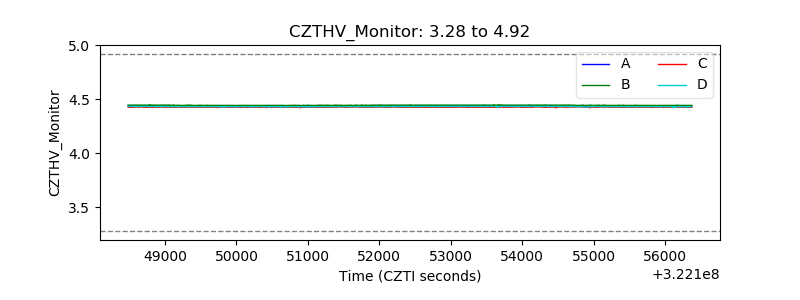 |
| D_VDD | 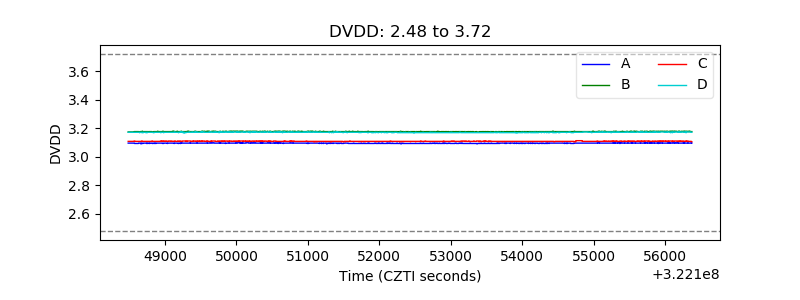 |
| Temperature 1 | 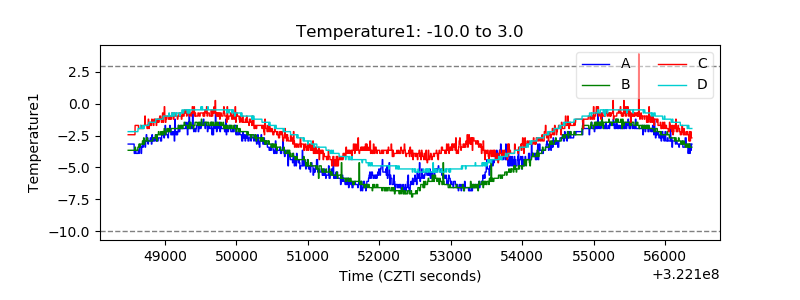 |
| Veto HV Monitor | 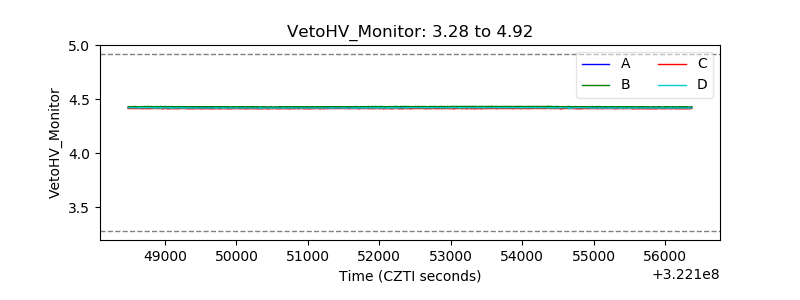 |
| Veto LLD | 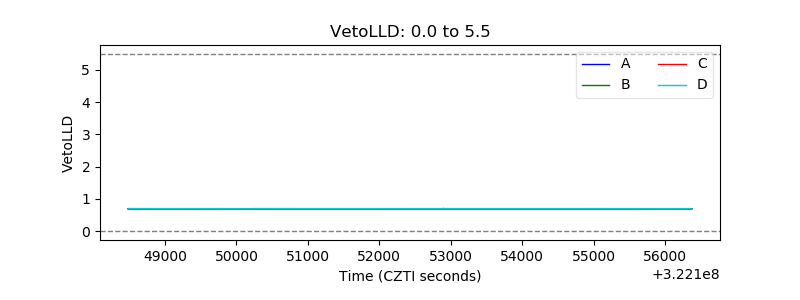 |
| Alpha Counter | 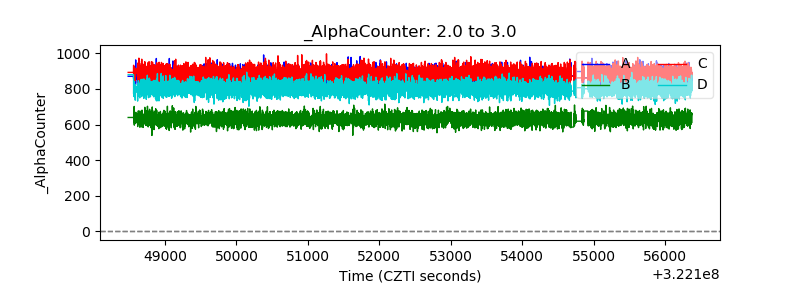 |
| _CPM_Rate | 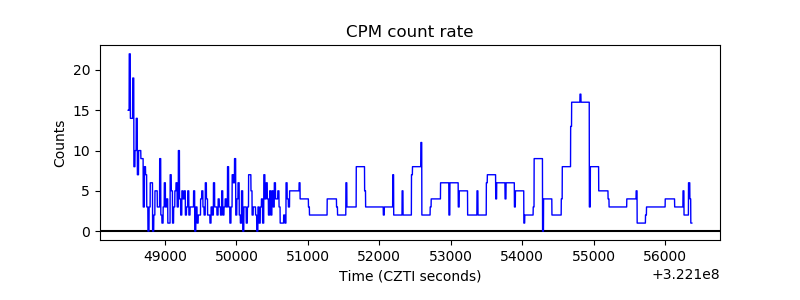 |
| CZT Counter | 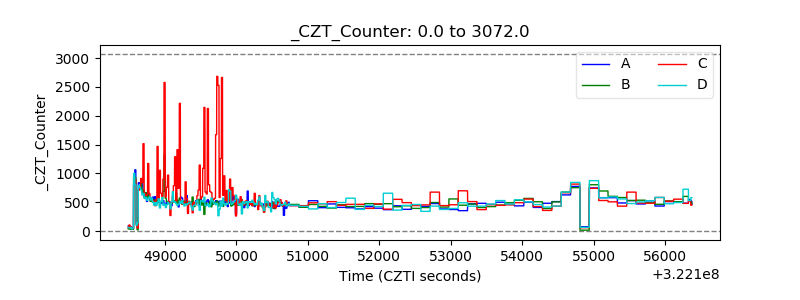 |
| +2.5 Volts monitor |  |
| +5 Volts monitor |  |
| _ROLL_ROT | 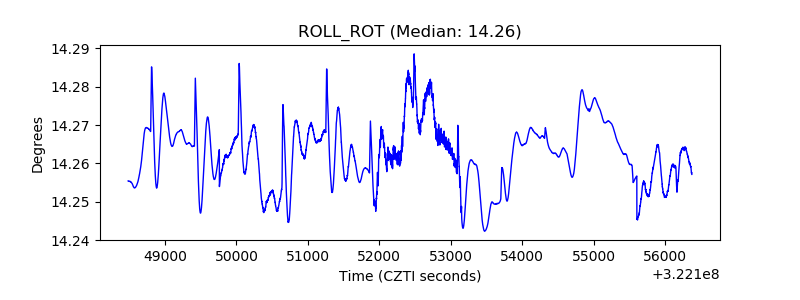 |
| _Roll_DEC | 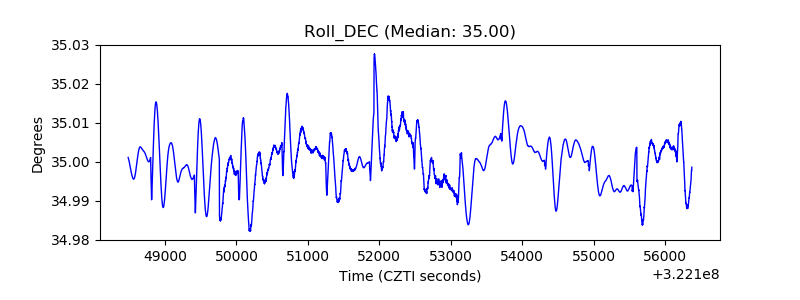 |
| _Roll_RA | 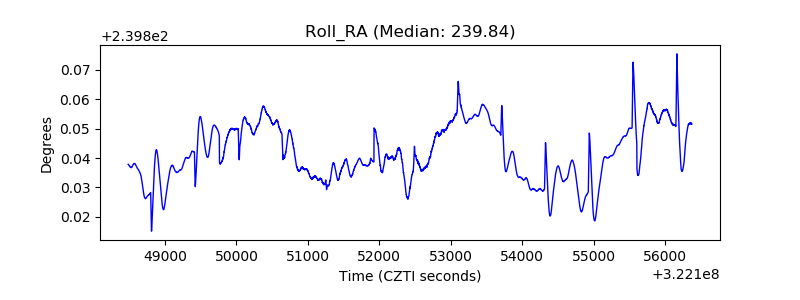 |
| Veto Counter | 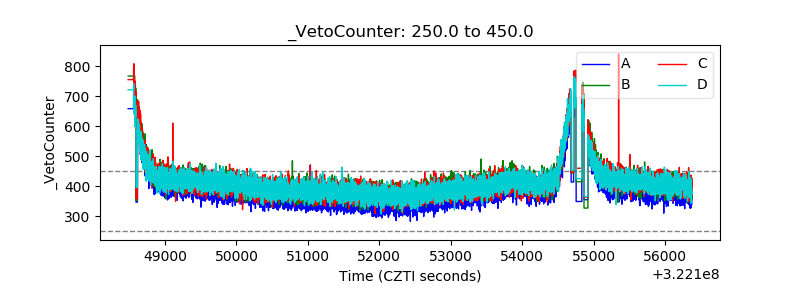 |