| Param | Original file | Final file |
|---|---|---|
| Filename | modeM0/AS1A07_067T01_9000003578_24164cztM0_level2.evt | modeM0/AS1A07_067T01_9000003578_24164cztM0_level2_quad_clean.evt |
| Size (bytes) | 546,874,560 | 90,267,840 |
| Size | 521.5 MB | 86.1 MB |
| Events in quadrant A | 3,901,573 | 548,984 |
| Events in quadrant B | 3,959,327 | 558,264 |
| Events in quadrant C | 4,007,098 | 539,294 |
| Events in quadrant D | 4,153,211 | 533,268 |
| Mode M9 | |||
|---|---|---|---|
| Quadrant | BADHDUFLAG | Total packets | Discarded packets |
| A | 0 | 6 | 0 |
| B | 0 | 6 | 0 |
| C | 0 | 6 | 0 |
| D | 0 | 6 | 0 |
| Mode SS | |||
|---|---|---|---|
| Quadrant | BADHDUFLAG | Total packets | Discarded packets |
| A | 0 | 166 | 0 |
| B | 0 | 166 | 0 |
| C | 0 | 166 | 0 |
| D | 0 | 166 | 0 |
| Mode M0 | |||
|---|---|---|---|
| Quadrant | BADHDUFLAG | Total packets | Discarded packets |
| A | 0 | 16615 | 2 |
| B | 0 | 16746 | 2 |
| C | 0 | 16863 | 2 |
| D | 0 | 17492 | 2 |
| Quadrant | Total seconds | Saturated seconds | Saturation percentage |
|---|---|---|---|
| A | 7963 | 188 | 2.360919% |
| B | 7963 | 241 | 3.026498% |
| C | 7964 | 284 | 3.566047% |
| D | 7964 | 194 | 2.435962% |
Noise dominated data is calculated using 1-second bins in cleaned event files. If a bin has >2000 counts, and if more than 50% of those come from <1% of pixels, then it is considered to be noise-dominated and hence unusable.
| Quadrant | # 1 sec bins | Bins with >0 counts | Bins with >2000 counts | High rate bins dominated by noise | Noise dominated (total time) | Noise dominated (detector-on time) | Marked lightcurve |
|---|---|---|---|---|---|---|---|
| A | 8518 | 7965 | 0 | 0 | 0.00% | 0.00% | 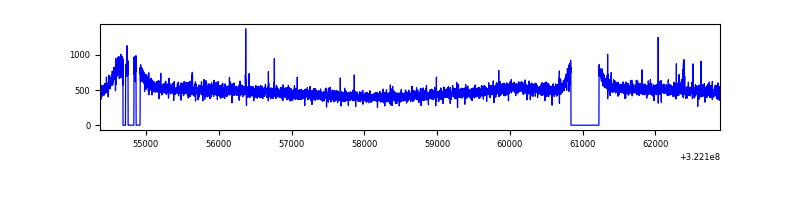 |
| B | 8518 | 7966 | 2 | 2 | 0.02% | 0.03% | 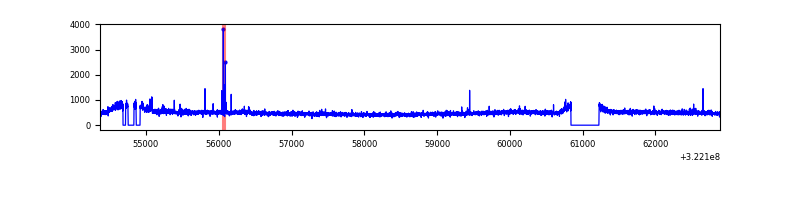 |
| C | 8519 | 7966 | 1 | 1 | 0.01% | 0.01% | 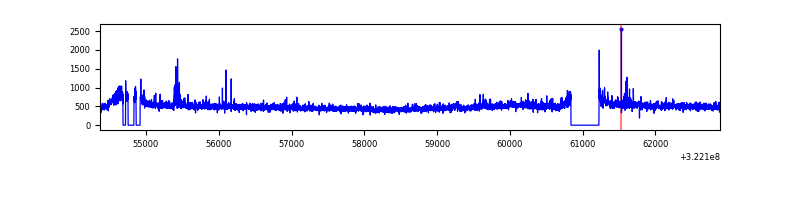 |
| D | 8519 | 7968 | 8 | 8 | 0.09% | 0.10% | 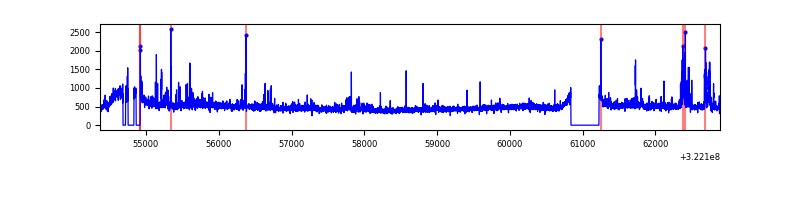 |
Top three noisy pixels from each quadrant. If the there are fewer than three noisy pixels in the level2.evt file, extra rows are filled as -1
| Pixel properties | Quadrant properties | ||||||
|---|---|---|---|---|---|---|---|
| Quadrant | DetID | PixID | Counts | Sigma | Mean | Median | Sigma |
| A | 13 | 254 | 13636 | 61.81 | 1006 | 984 | 204.7 |
| A | 3 | 1 | 10247 | 45.26 | 1006 | 984 | 204.7 |
| A | 4 | 2 | 9366 | 40.95 | 1006 | 984 | 204.7 |
| B | 0 | 190 | 26287 | 131.75 | 995 | 969 | 192.2 |
| B | 12 | 111 | 23249 | 115.94 | 995 | 969 | 192.2 |
| B | 11 | 111 | 20698 | 102.67 | 995 | 969 | 192.2 |
| C | 14 | 238 | 149543 | 664.0 | 955 | 960 | 223.8 |
| C | 0 | 207 | 43899 | 191.89 | 955 | 960 | 223.8 |
| C | 10 | 91 | 29200 | 126.2 | 955 | 960 | 223.8 |
| D | 7 | 238 | 223022 | 926.04 | 980 | 949 | 239.8 |
| D | 8 | 195 | 171652 | 711.83 | 980 | 949 | 239.8 |
| D | 2 | 234 | 38865 | 158.11 | 980 | 949 | 239.8 |
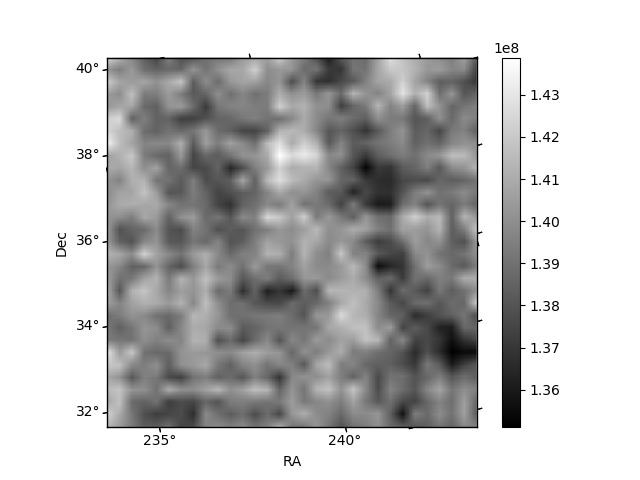
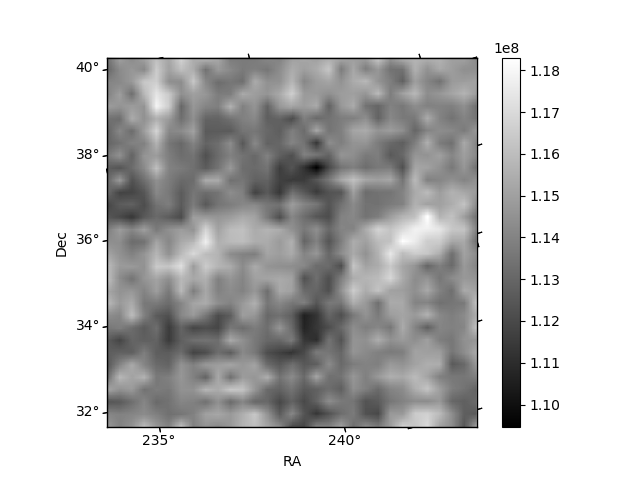
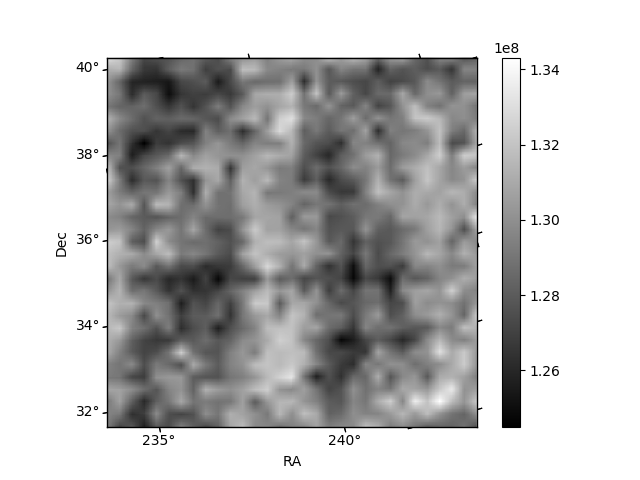
Histogram calculated using DETX and DETY for each event in the final _common_clean file
| Quadrant A |  |
 |
Quadrant B |
|---|---|---|---|
| Quadrant D | 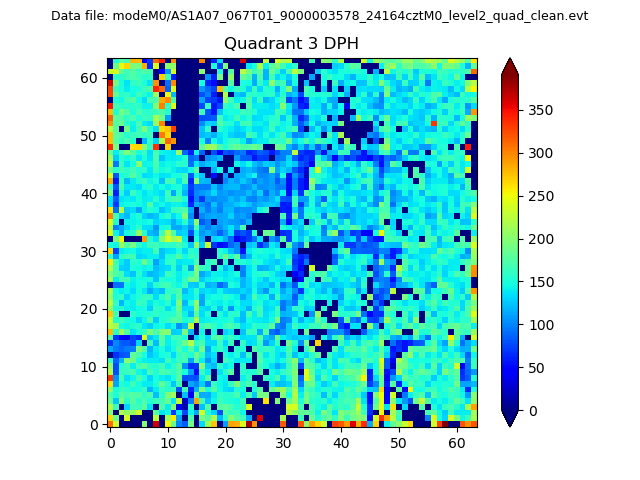 |
 |
Quadrant C |
| Plot type | Count rate plots | Images |
|---|---|---|
| Comparison with Poisson distribution Blue bars denote a histogram of data divided into 1 sec bins. Red curve is a Poisson curve with rate = median count rate of data. |
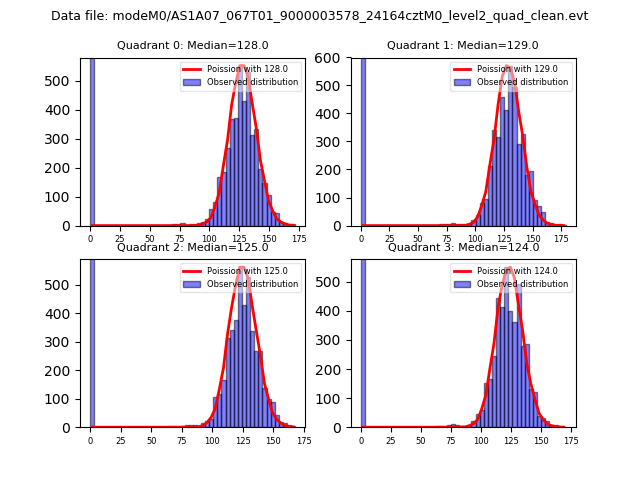 |
 |
| Quadrant-wise count rates Data is divided into 100 sec bins |
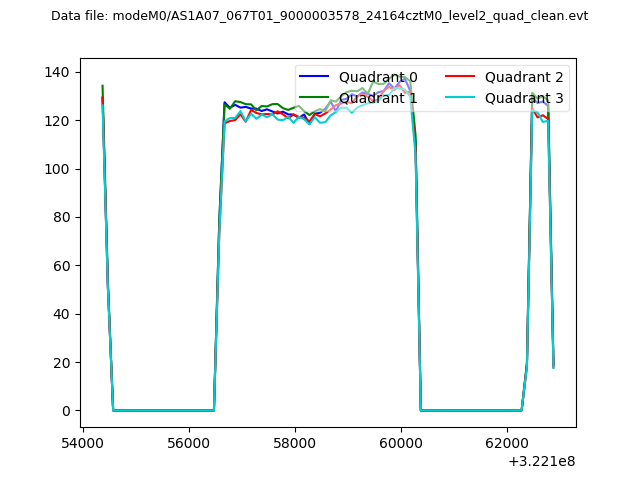 |
|
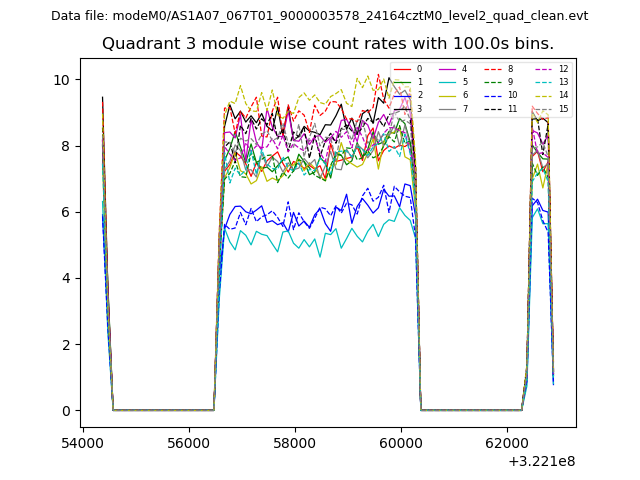
| Module-wise count rates for Quadrant A Data is divided into 100 sec bins |
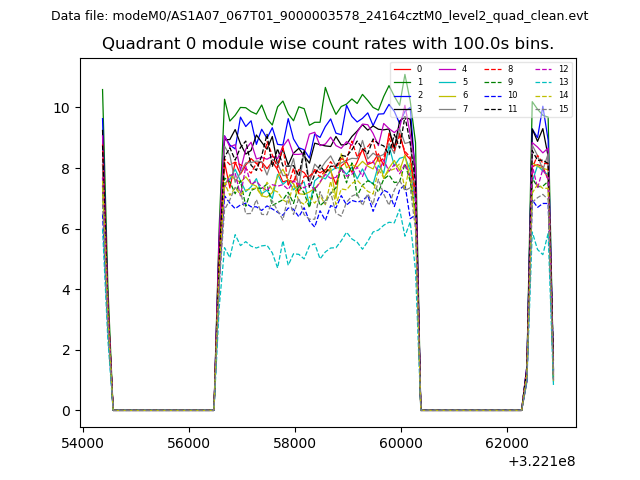 |
 |
| Module-wise count rates for Quadrant B Data is divided into 100 sec bins |
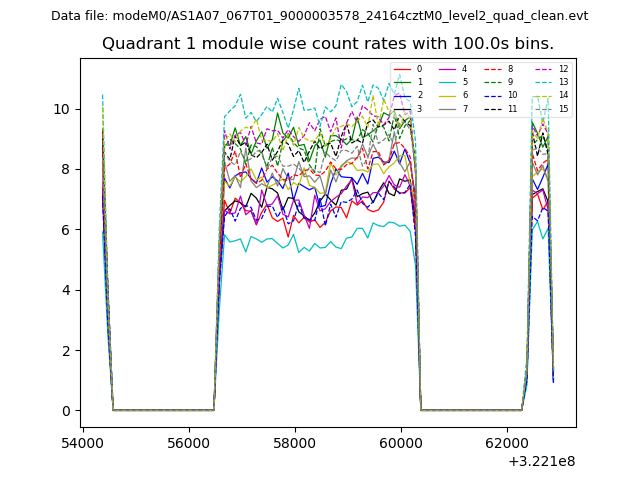 |
 |
| Module-wise count rates for Quadrant C Data is divided into 100 sec bins |
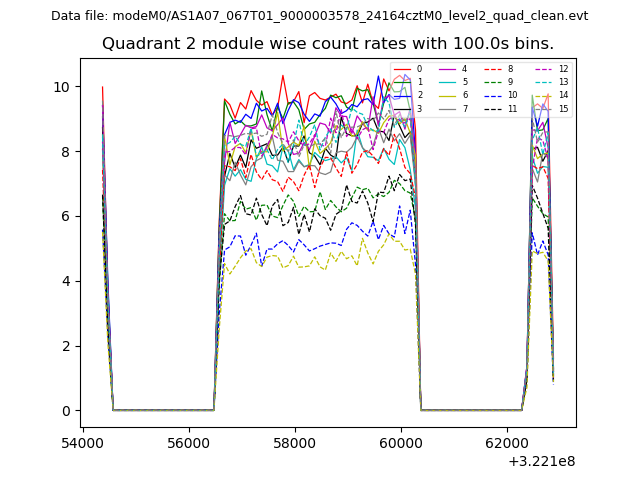 |
 |
| Module-wise count rates for Quadrant D Data is divided into 100 sec bins |
 |
 |
| Parameter | Plot |
|---|---|
| CZT HV Monitor |  |
| D_VDD | 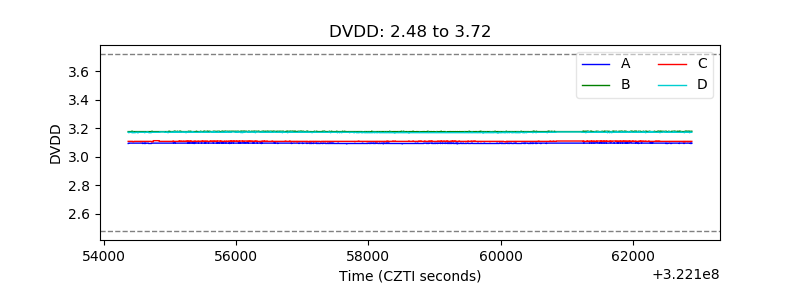 |
| Temperature 1 | 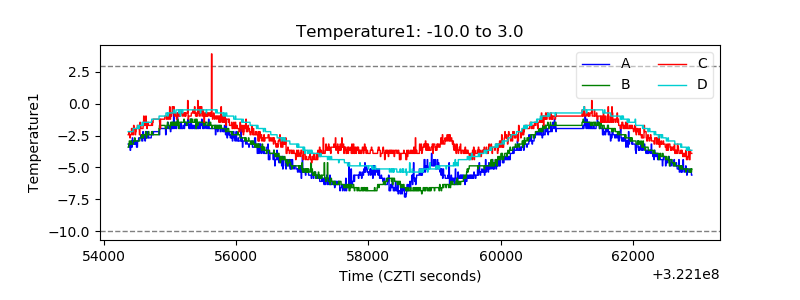 |
| Veto HV Monitor | 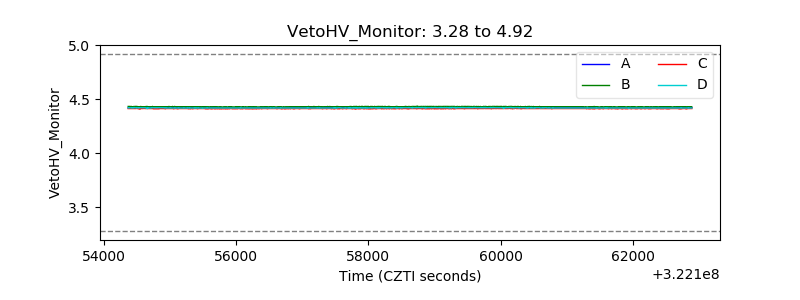 |
| Veto LLD | 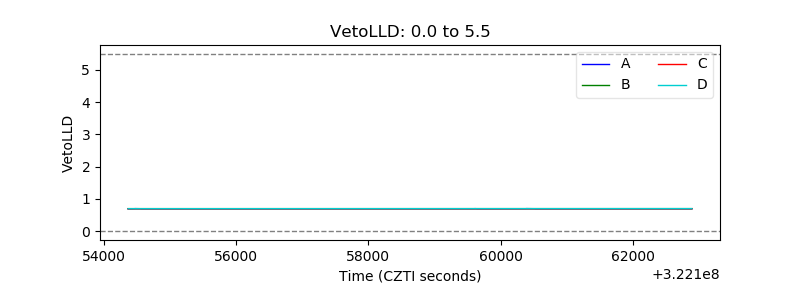 |
| Alpha Counter | 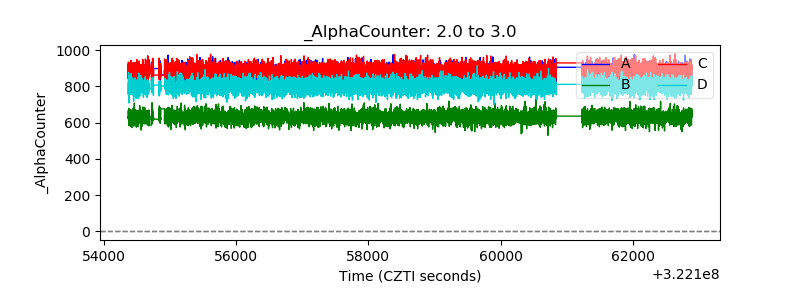 |
| _CPM_Rate | 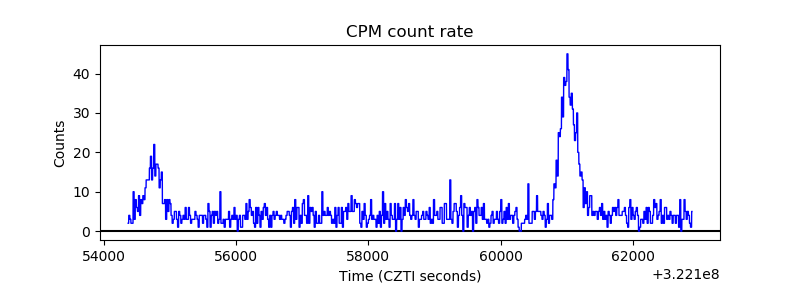 |
| CZT Counter | 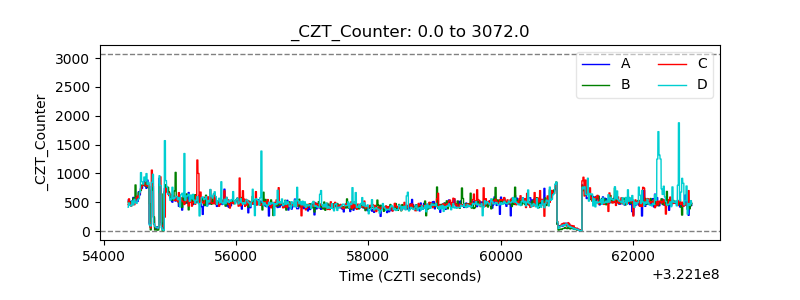 |
| +2.5 Volts monitor |  |
| +5 Volts monitor |  |
| _ROLL_ROT | 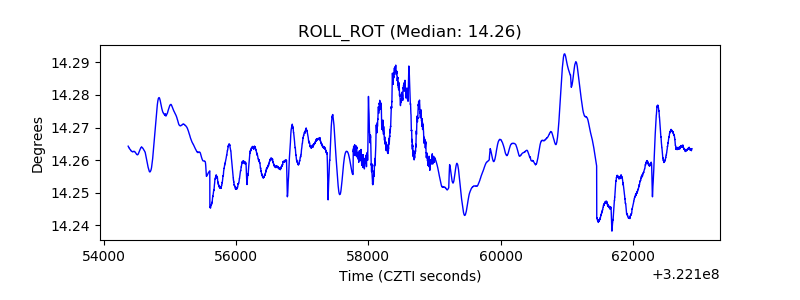 |
| _Roll_DEC | 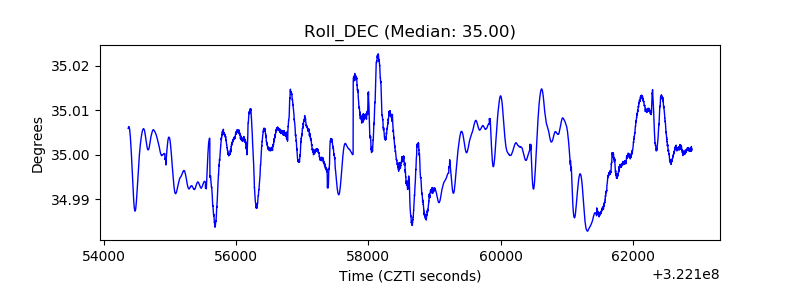 |
| _Roll_RA | 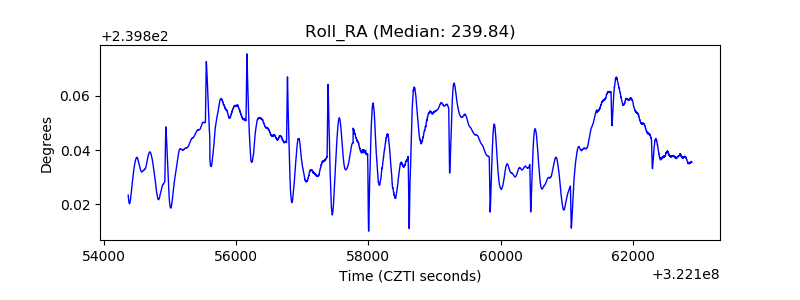 |
| Veto Counter | 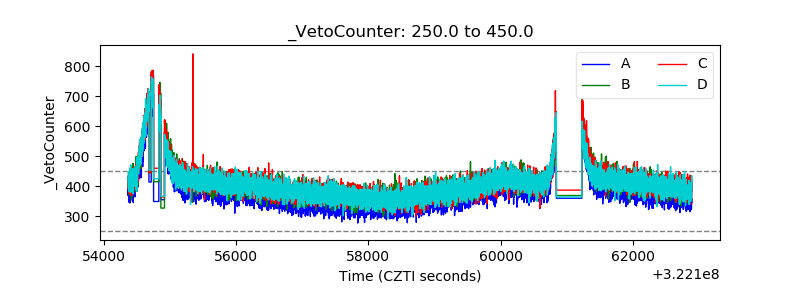 |