| Param | Original file | Final file |
|---|---|---|
| Filename | modeM0/AS1A07_067T01_9000003578_24166cztM0_level2.evt | modeM0/AS1A07_067T01_9000003578_24166cztM0_level2_quad_clean.evt |
| Size (bytes) | 1,129,190,400 | 170,945,280 |
| Size | 1.1 GB | 163.0 MB |
| Events in quadrant A | 6,276,153 | 1,092,126 |
| Events in quadrant B | 6,355,935 | 1,114,707 |
| Events in quadrant C | 6,493,845 | 1,078,201 |
| Events in quadrant D | 14,172,480 | 972,442 |
| Mode M9 | |||
|---|---|---|---|
| Quadrant | BADHDUFLAG | Total packets | Discarded packets |
| A | 0 | 16 | 0 |
| B | 0 | 16 | 0 |
| C | 0 | 16 | 0 |
| D | 0 | 16 | 0 |
| Mode SS | |||
|---|---|---|---|
| Quadrant | BADHDUFLAG | Total packets | Discarded packets |
| A | 0 | 274 | 0 |
| B | 0 | 274 | 0 |
| C | 0 | 274 | 0 |
| D | 0 | 274 | 0 |
| Mode M0 | |||
|---|---|---|---|
| Quadrant | BADHDUFLAG | Total packets | Discarded packets |
| A | 0 | 27323 | 3 |
| B | 0 | 27372 | 3 |
| C | 0 | 27727 | 3 |
| D | 0 | 51223 | 3 |
| Quadrant | Total seconds | Saturated seconds | Saturation percentage |
|---|---|---|---|
| A | 13302 | 94 | 0.706661% |
| B | 13302 | 138 | 1.037438% |
| C | 13303 | 227 | 1.706382% |
| D | 13303 | 2589 | 19.461776% |
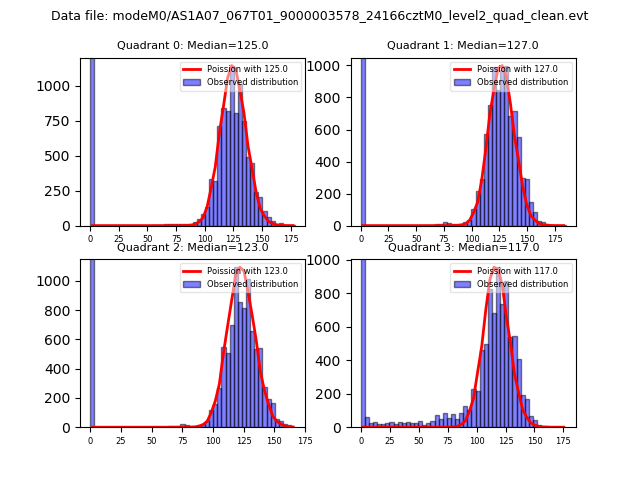
Noise dominated data is calculated using 1-second bins in cleaned event files. If a bin has >2000 counts, and if more than 50% of those come from <1% of pixels, then it is considered to be noise-dominated and hence unusable.
| Quadrant | # 1 sec bins | Bins with >0 counts | Bins with >2000 counts | High rate bins dominated by noise | Noise dominated (total time) | Noise dominated (detector-on time) | Marked lightcurve |
|---|---|---|---|---|---|---|---|
| A | 15002 | 13303 | 1 | 1 | 0.01% | 0.01% |  |
| B | 15002 | 13305 | 1 | 1 | 0.01% | 0.01% |  |
| C | 15003 | 13305 | 13 | 13 | 0.09% | 0.10% |  |
| D | 15003 | 13304 | 2149 | 2149 | 14.32% | 16.15% |  |
Top three noisy pixels from each quadrant. If the there are fewer than three noisy pixels in the level2.evt file, extra rows are filled as -1
| Pixel properties | Quadrant properties | ||||||
|---|---|---|---|---|---|---|---|
| Quadrant | DetID | PixID | Counts | Sigma | Mean | Median | Sigma |
| A | 13 | 254 | 21295 | 60.84 | 1620 | 1587 | 323.9 |
| A | 3 | 1 | 19349 | 54.83 | 1620 | 1587 | 323.9 |
| A | 3 | 137 | 14559 | 40.04 | 1620 | 1587 | 323.9 |
| B | 12 | 111 | 37716 | 117.34 | 1614 | 1570 | 308.0 |
| B | 11 | 111 | 33452 | 103.5 | 1614 | 1570 | 308.0 |
| B | 14 | 111 | 28890 | 88.69 | 1614 | 1570 | 308.0 |
| C | 14 | 238 | 246399 | 674.1 | 1554 | 1562 | 363.2 |
| C | 10 | 23 | 78391 | 211.53 | 1554 | 1562 | 363.2 |
| C | 10 | 9 | 38688 | 102.22 | 1554 | 1562 | 363.2 |
| D | 7 | 238 | 8193989 | 23288.4 | 1455 | 1410 | 351.8 |
| D | 8 | 195 | 289558 | 819.1 | 1455 | 1410 | 351.8 |
| D | 1 | 52 | 80325 | 224.33 | 1455 | 1410 | 351.8 |
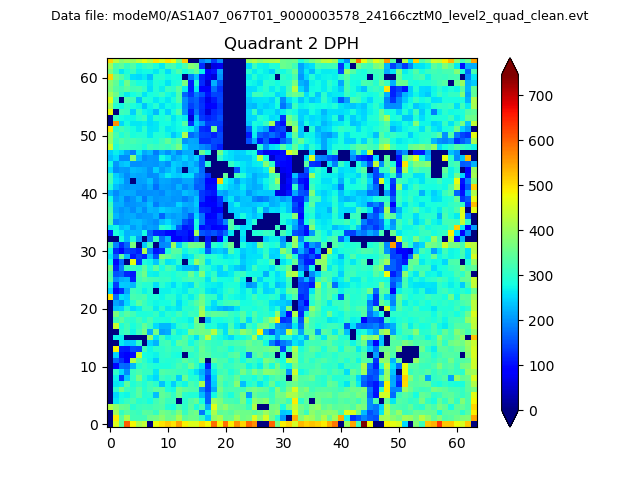
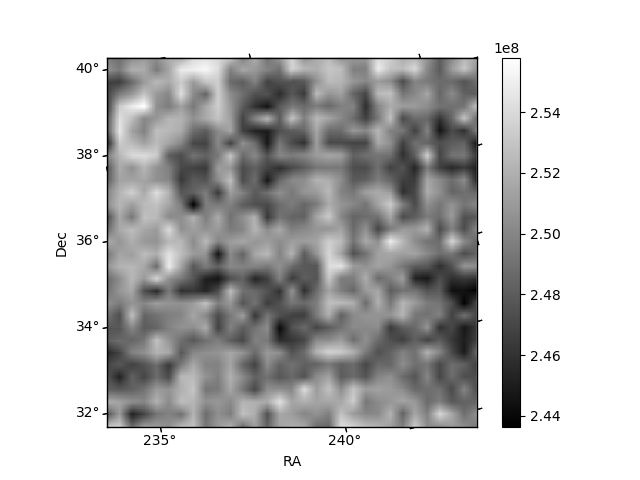
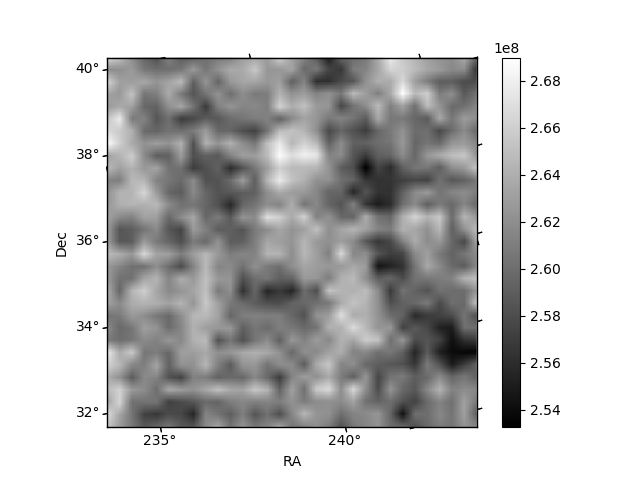
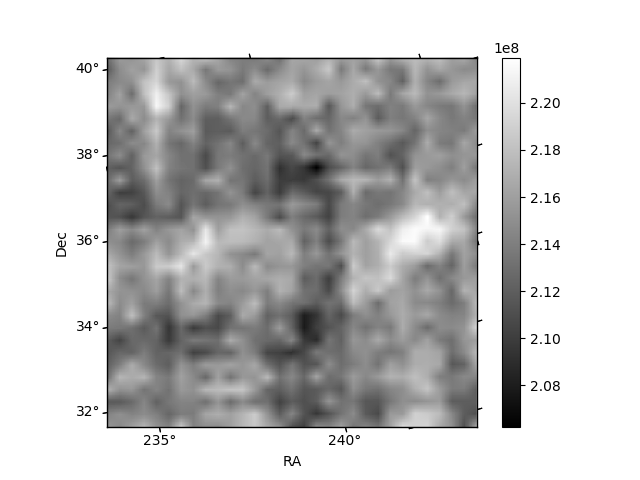
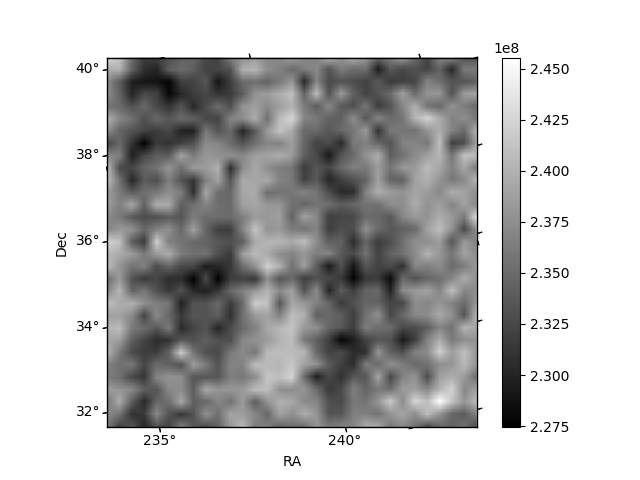
Histogram calculated using DETX and DETY for each event in the final _common_clean file
| Quadrant A | 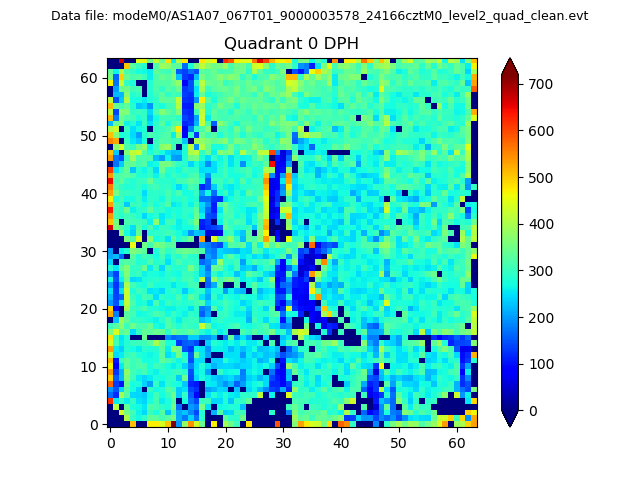 |
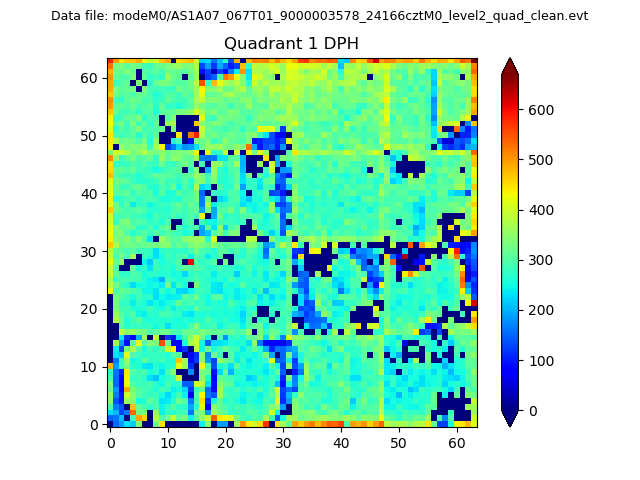 |
Quadrant B |
|---|---|---|---|
| Quadrant D | 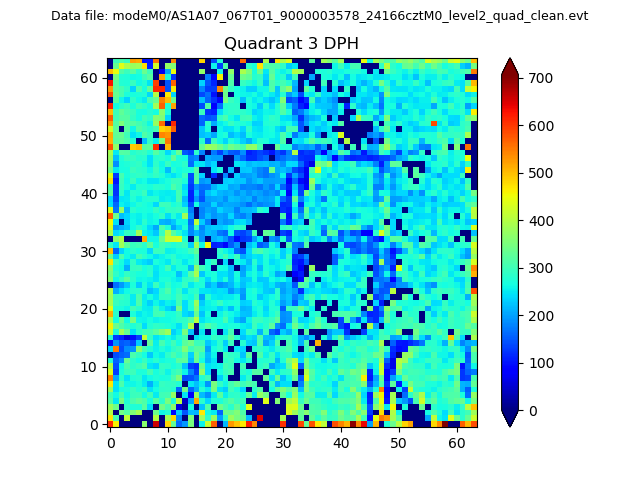 |
 |
Quadrant C |
| Plot type | Count rate plots | Images |
|---|---|---|
| Comparison with Poisson distribution Blue bars denote a histogram of data divided into 1 sec bins. Red curve is a Poisson curve with rate = median count rate of data. |
 |
 |
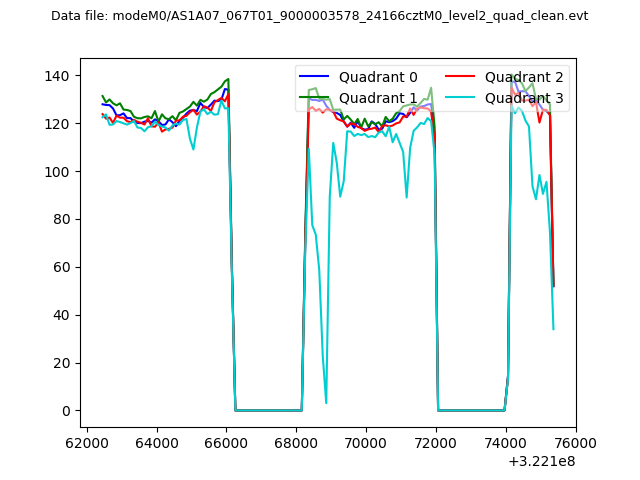
| Quadrant-wise count rates Data is divided into 100 sec bins |
 |
|
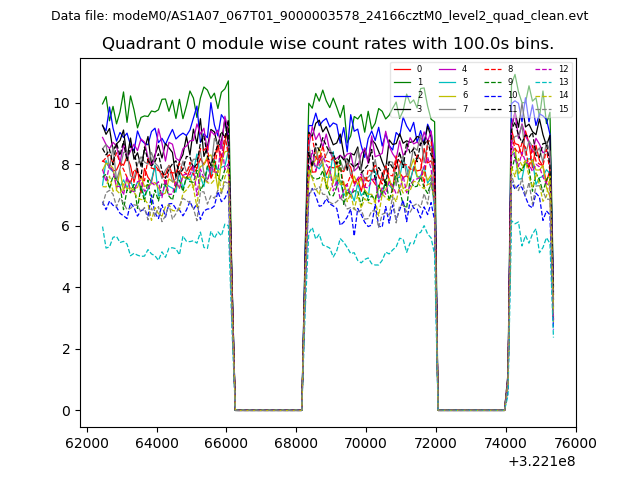
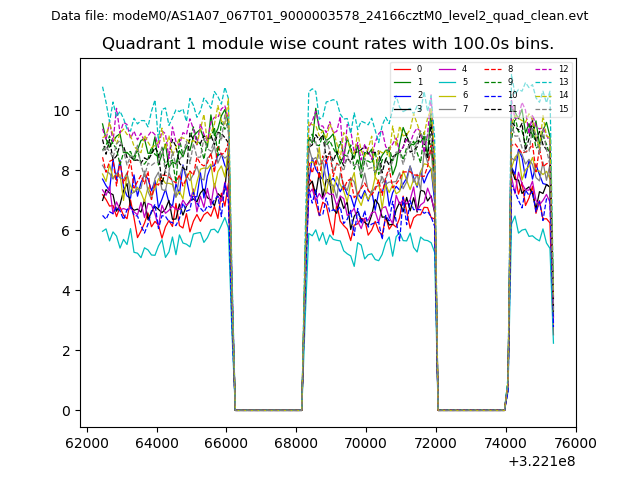
| Module-wise count rates for Quadrant A Data is divided into 100 sec bins |
 |
 |
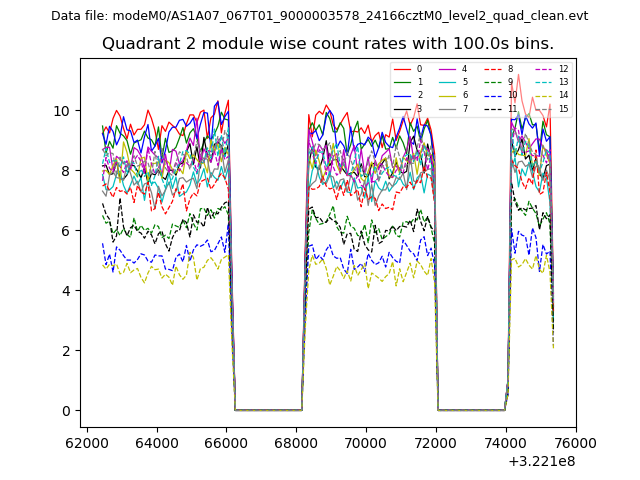
| Module-wise count rates for Quadrant B Data is divided into 100 sec bins |
 |
 |
| Module-wise count rates for Quadrant C Data is divided into 100 sec bins |
 |
 |
| Module-wise count rates for Quadrant D Data is divided into 100 sec bins |
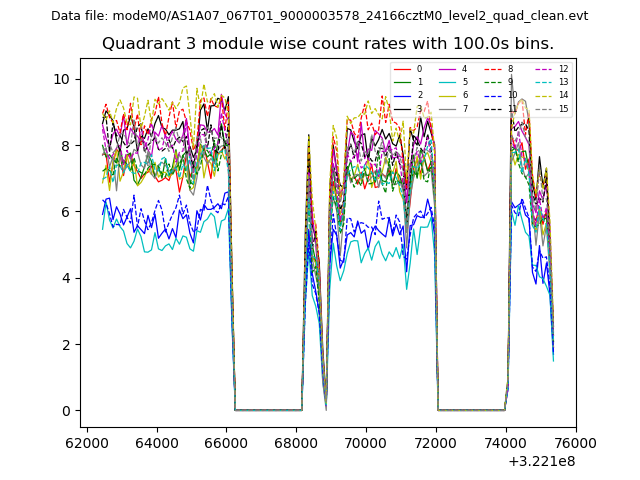 |
 |
| Parameter | Plot |
|---|---|
| CZT HV Monitor | 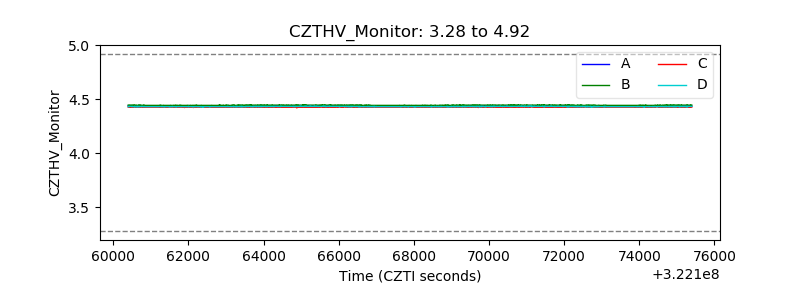 |
| D_VDD | 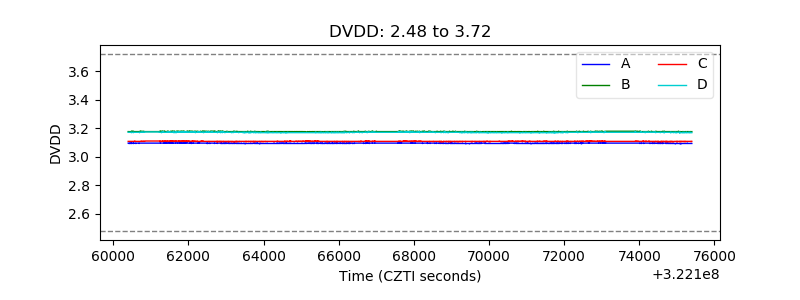 |
| Temperature 1 | 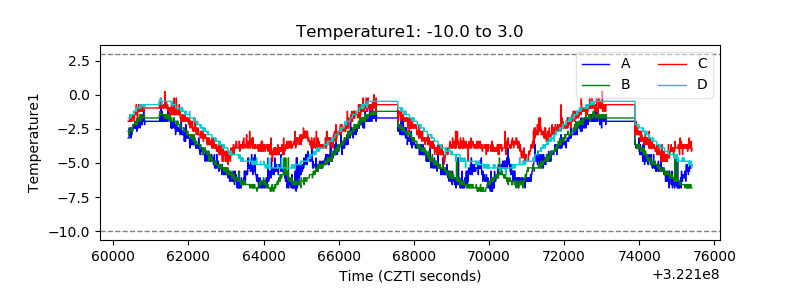 |
| Veto HV Monitor | 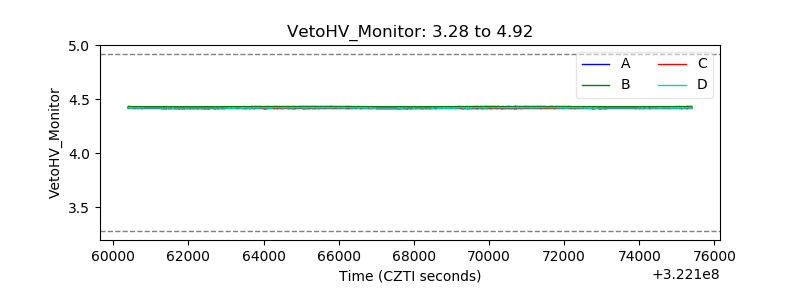 |
| Veto LLD | 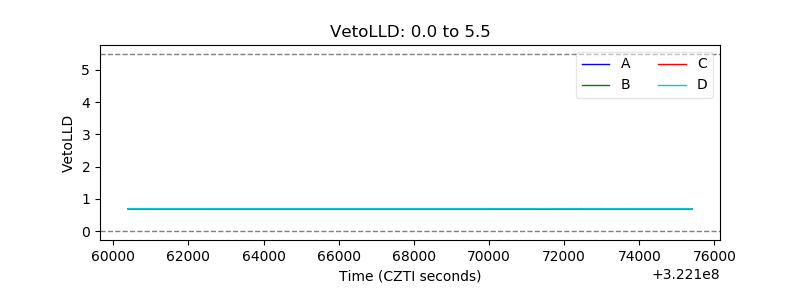 |
| Alpha Counter | 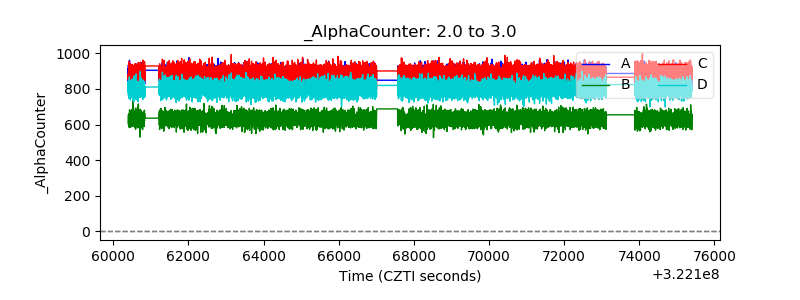 |
| _CPM_Rate | 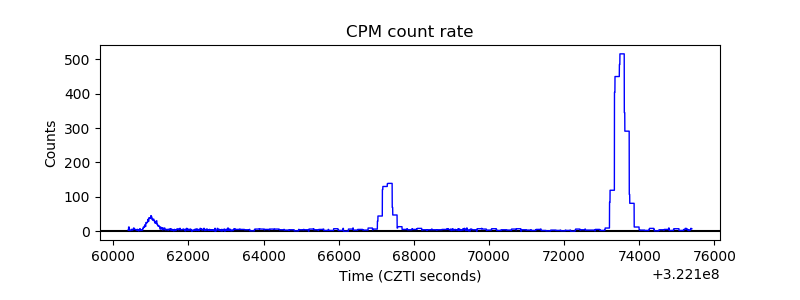 |
| CZT Counter | 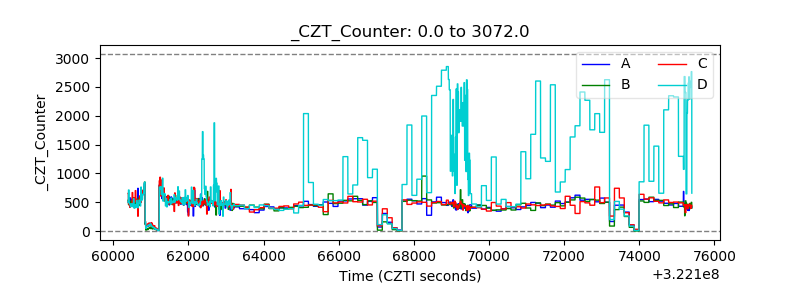 |
| +2.5 Volts monitor | 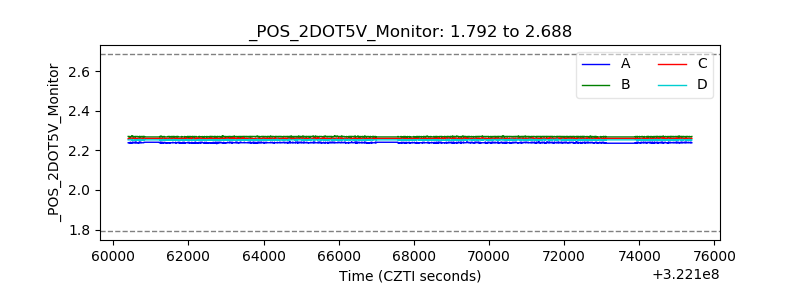 |
| +5 Volts monitor | 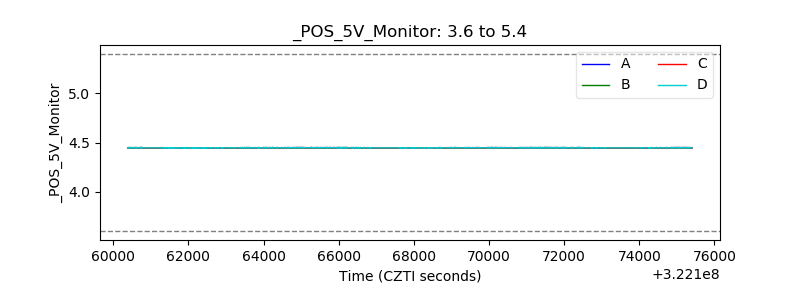 |
| _ROLL_ROT | 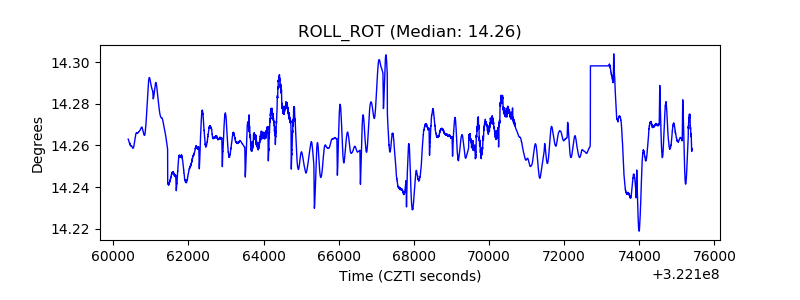 |
| _Roll_DEC | 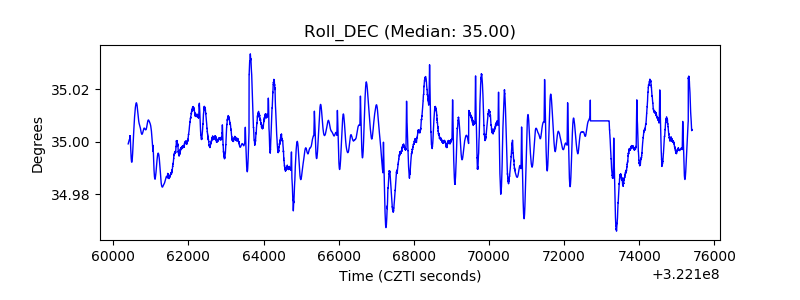 |
| _Roll_RA | 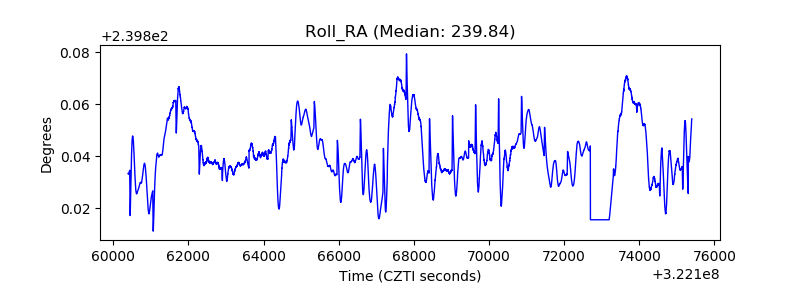 |
| Veto Counter | 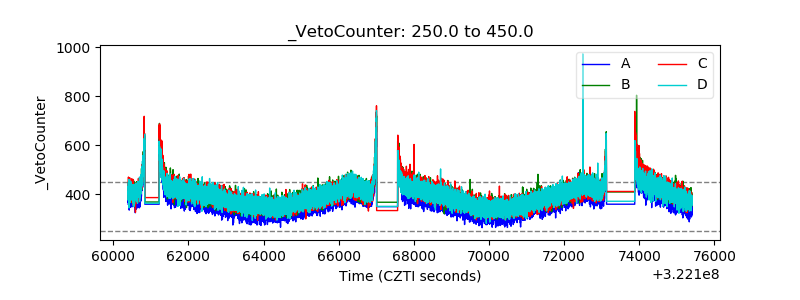 |