| Param | Original file | Final file |
|---|---|---|
| Filename | modeM0/AS1A07_067T01_9000003578_24167cztM0_level2.evt | modeM0/AS1A07_067T01_9000003578_24167cztM0_level2_quad_clean.evt |
| Size (bytes) | 747,889,920 | 96,719,040 |
| Size | 713.2 MB | 92.2 MB |
| Events in quadrant A | 3,167,087 | 657,656 |
| Events in quadrant B | 3,237,624 | 674,488 |
| Events in quadrant C | 3,364,200 | 649,720 |
| Events in quadrant D | 12,422,439 | 473,872 |
| Mode M9 | |||
|---|---|---|---|
| Quadrant | BADHDUFLAG | Total packets | Discarded packets |
| A | 0 | 10 | 0 |
| B | 0 | 11 | 0 |
| C | 0 | 11 | 0 |
| D | 0 | 11 | 0 |
| Mode SS | |||
|---|---|---|---|
| Quadrant | BADHDUFLAG | Total packets | Discarded packets |
| A | 0 | 138 | 0 |
| B | 0 | 138 | 0 |
| C | 0 | 138 | 0 |
| D | 0 | 138 | 0 |
| Mode M0 | |||
|---|---|---|---|
| Quadrant | BADHDUFLAG | Total packets | Discarded packets |
| A | 0 | 13890 | 2 |
| B | 0 | 13996 | 2 |
| C | 0 | 14357 | 2 |
| D | 0 | 41603 | 2 |
| Quadrant | Total seconds | Saturated seconds | Saturation percentage |
|---|---|---|---|
| A | 6774 | 25 | 0.369058% |
| B | 6774 | 47 | 0.693829% |
| C | 6774 | 100 | 1.476233% |
| D | 6774 | 3500 | 51.668143% |
Noise dominated data is calculated using 1-second bins in cleaned event files. If a bin has >2000 counts, and if more than 50% of those come from <1% of pixels, then it is considered to be noise-dominated and hence unusable.
| Quadrant | # 1 sec bins | Bins with >0 counts | Bins with >2000 counts | High rate bins dominated by noise | Noise dominated (total time) | Noise dominated (detector-on time) | Marked lightcurve |
|---|---|---|---|---|---|---|---|
| A | 7684 | 6775 | 1 | 1 | 0.01% | 0.01% | 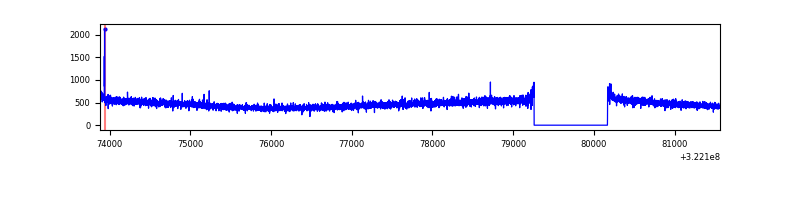 |
| B | 7684 | 6775 | 1 | 1 | 0.01% | 0.01% | 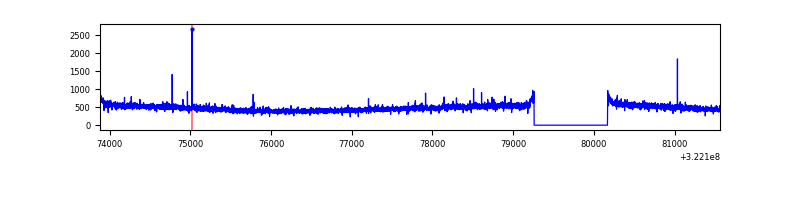 |
| C | 7684 | 6775 | 16 | 16 | 0.21% | 0.24% | 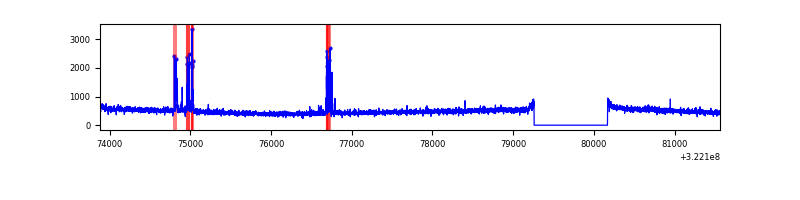 |
| D | 7683 | 6773 | 3128 | 3128 | 40.71% | 46.18% | 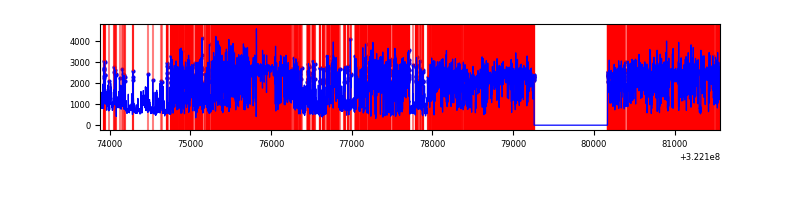 |
Top three noisy pixels from each quadrant. If the there are fewer than three noisy pixels in the level2.evt file, extra rows are filled as -1
| Pixel properties | Quadrant properties | ||||||
|---|---|---|---|---|---|---|---|
| Quadrant | DetID | PixID | Counts | Sigma | Mean | Median | Sigma |
| A | 13 | 254 | 10932 | 61.1 | 820 | 801 | 165.8 |
| A | 3 | 137 | 7436 | 40.02 | 820 | 801 | 165.8 |
| A | 0 | 226 | 6924 | 36.93 | 820 | 801 | 165.8 |
| B | 12 | 111 | 19382 | 117.71 | 823 | 802 | 157.8 |
| B | 11 | 111 | 16957 | 102.35 | 823 | 802 | 157.8 |
| B | 14 | 111 | 14864 | 89.09 | 823 | 802 | 157.8 |
| C | 14 | 238 | 125079 | 664.18 | 795 | 799 | 187.1 |
| C | 10 | 23 | 77819 | 411.61 | 795 | 799 | 187.1 |
| C | 10 | 9 | 52873 | 278.29 | 795 | 799 | 187.1 |
| D | 7 | 238 | 9761790 | 64380.38 | 619 | 599 | 151.6 |
| D | 8 | 195 | 252493 | 1661.38 | 619 | 599 | 151.6 |
| D | 1 | 52 | 47262 | 307.77 | 619 | 599 | 151.6 |
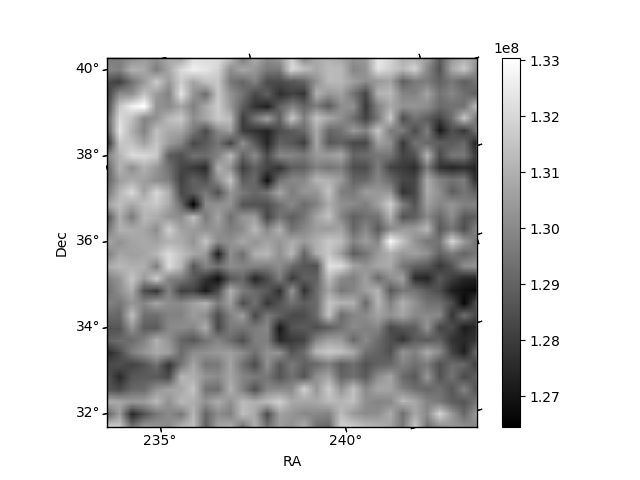
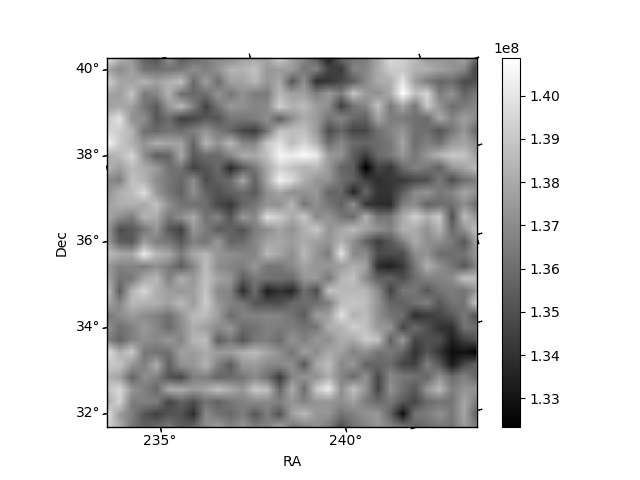
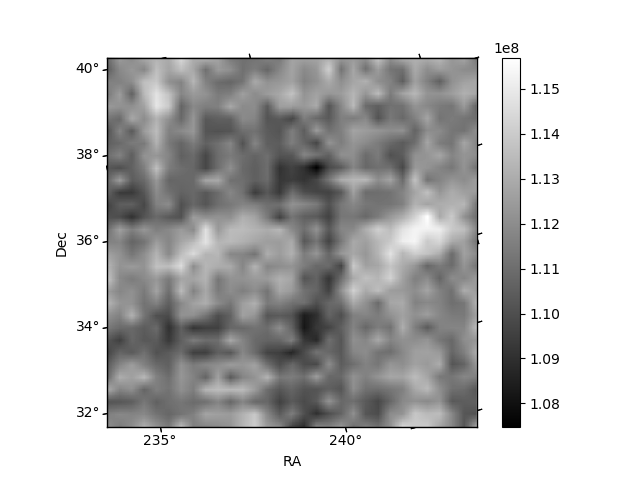
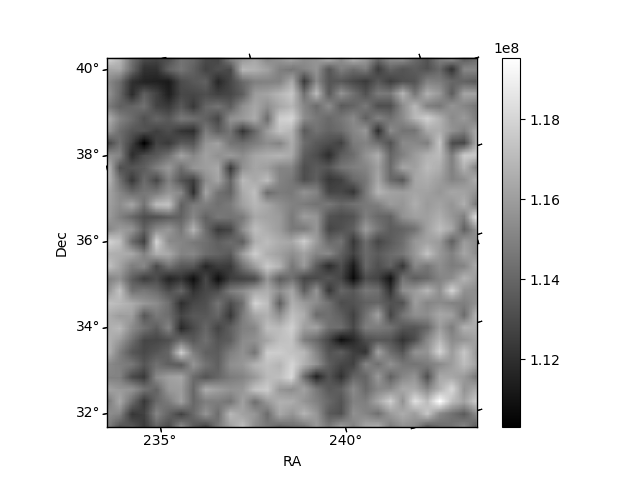
Histogram calculated using DETX and DETY for each event in the final _common_clean file
| Quadrant A | 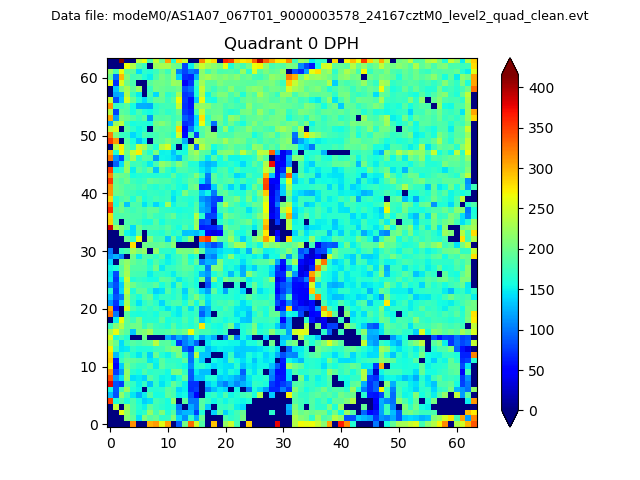 |
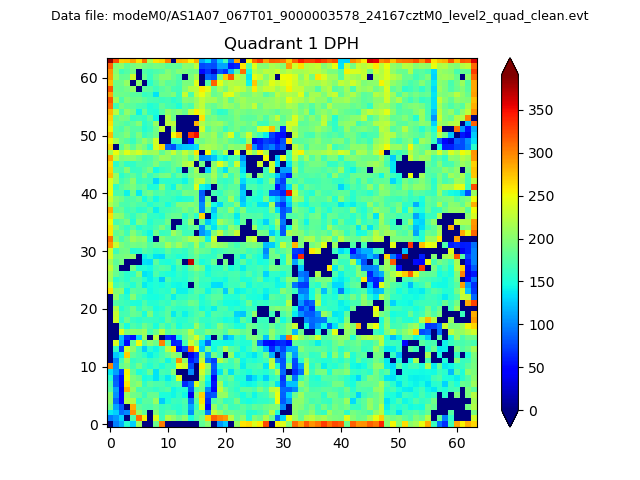 |
Quadrant B |
|---|---|---|---|
| Quadrant D | 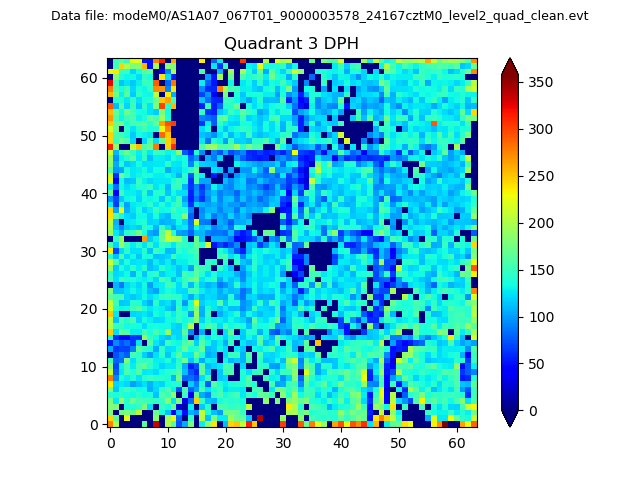 |
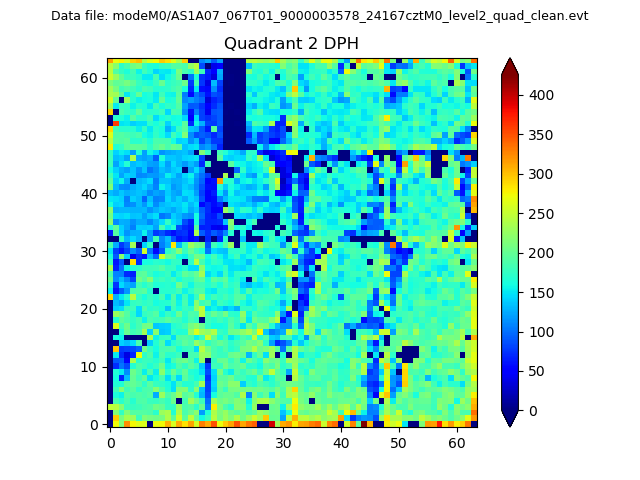 |
Quadrant C |
| Plot type | Count rate plots | Images |
|---|---|---|
| Comparison with Poisson distribution Blue bars denote a histogram of data divided into 1 sec bins. Red curve is a Poisson curve with rate = median count rate of data. |
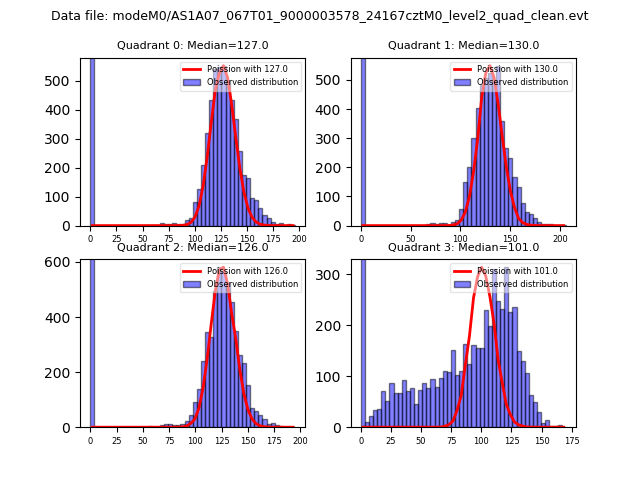 |
 |
| Quadrant-wise count rates Data is divided into 100 sec bins |
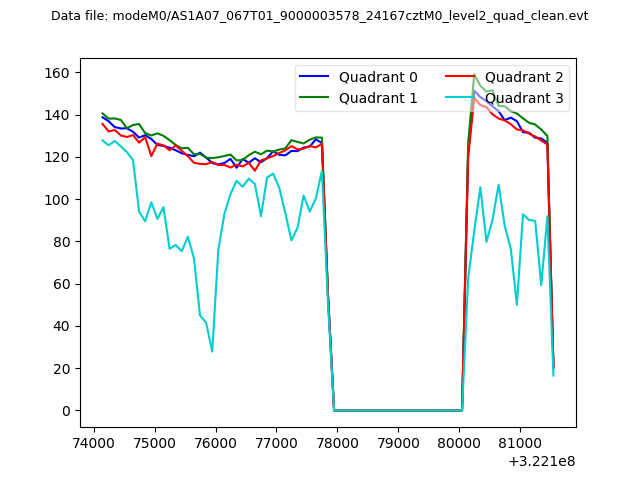 |
|
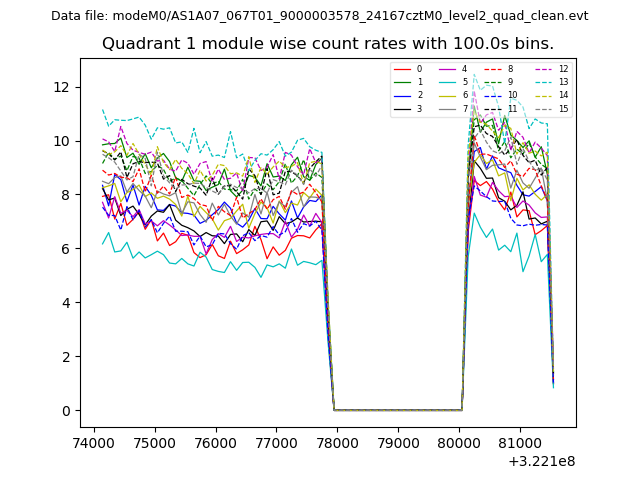
| Module-wise count rates for Quadrant A Data is divided into 100 sec bins |
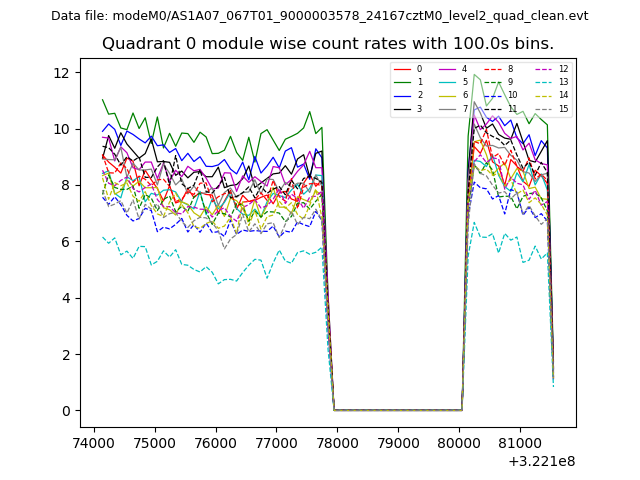 |
 |
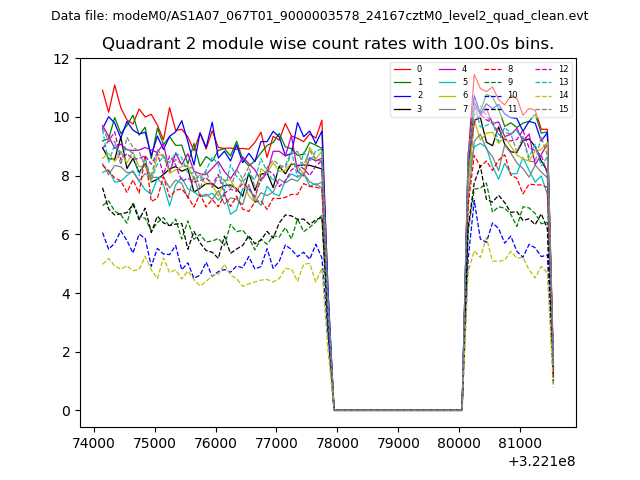
| Module-wise count rates for Quadrant B Data is divided into 100 sec bins |
 |
 |
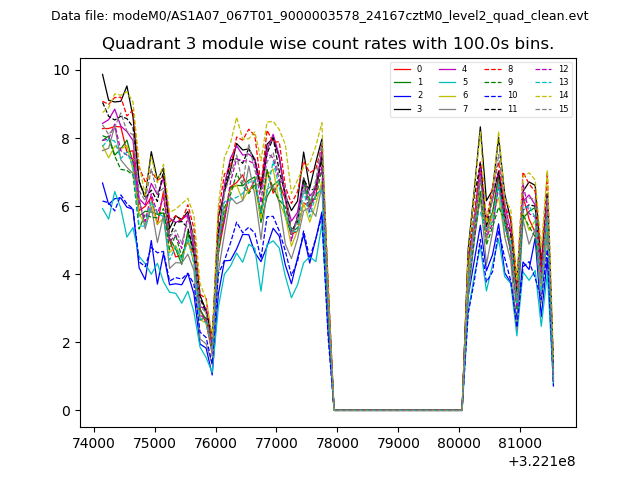
| Module-wise count rates for Quadrant C Data is divided into 100 sec bins |
 |
 |
| Module-wise count rates for Quadrant D Data is divided into 100 sec bins |
 |
 |
| Parameter | Plot |
|---|---|
| CZT HV Monitor | 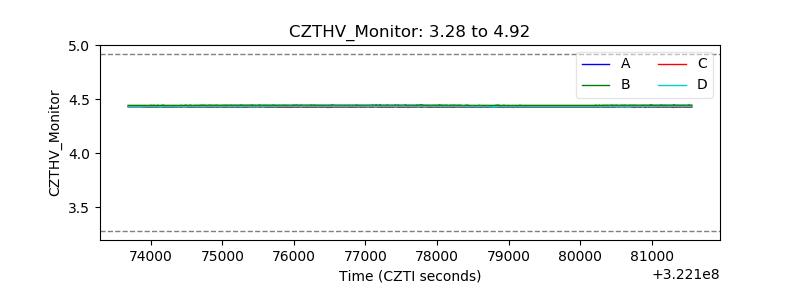 |
| D_VDD | 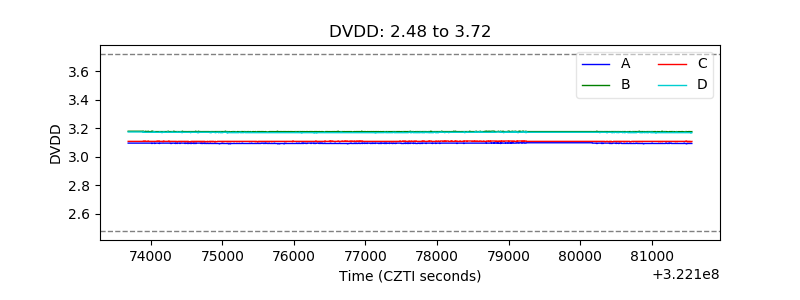 |
| Temperature 1 | 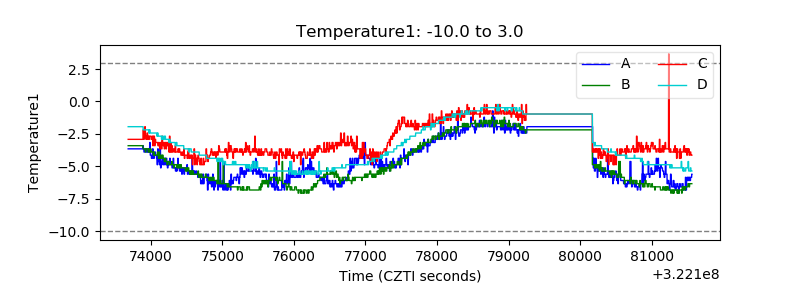 |
| Veto HV Monitor | 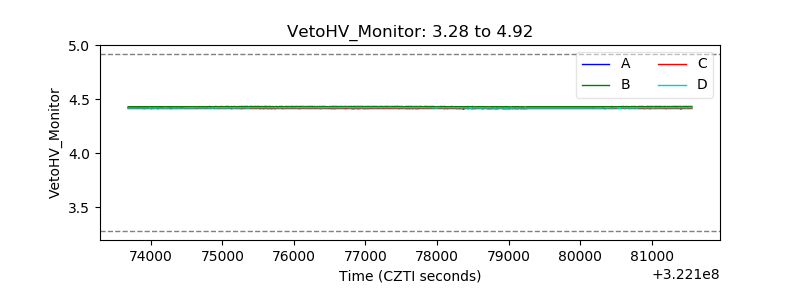 |
| Veto LLD | 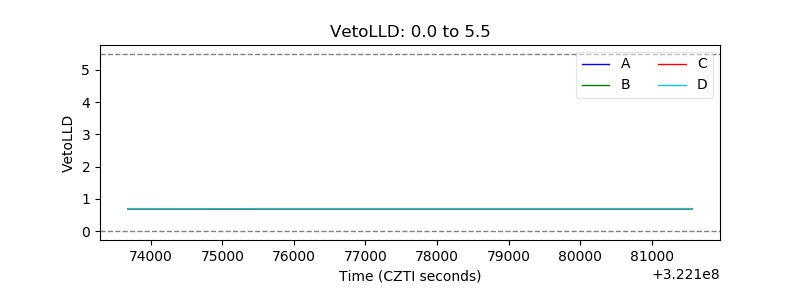 |
| Alpha Counter |  |
| _CPM_Rate | 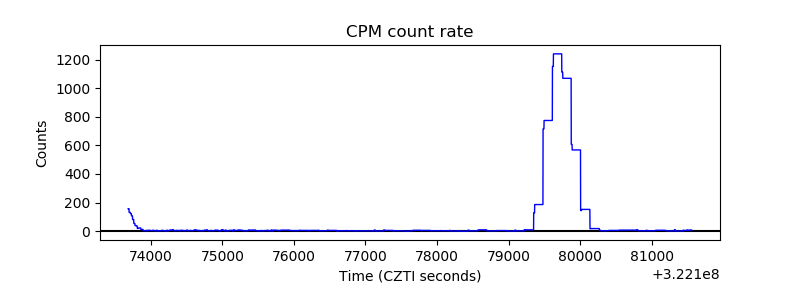 |
| CZT Counter | 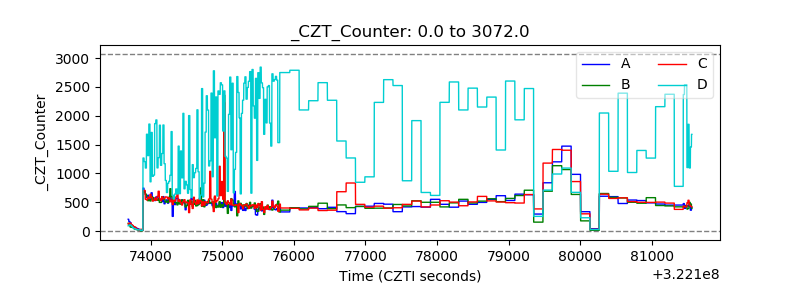 |
| +2.5 Volts monitor |  |
| +5 Volts monitor |  |
| _ROLL_ROT | 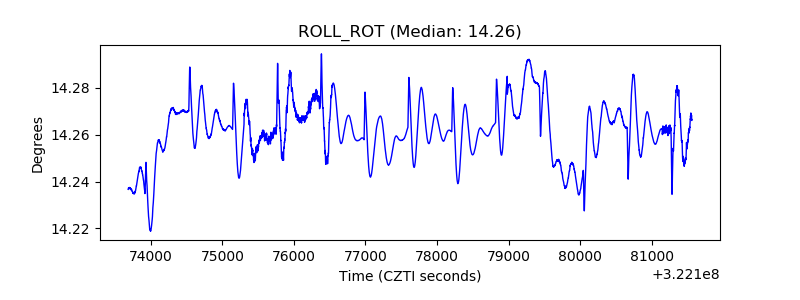 |
| _Roll_DEC | 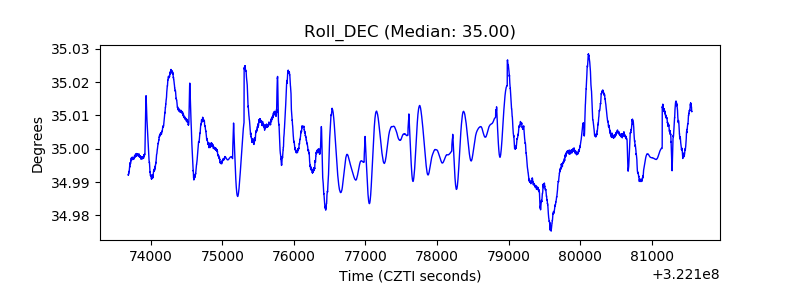 |
| _Roll_RA | 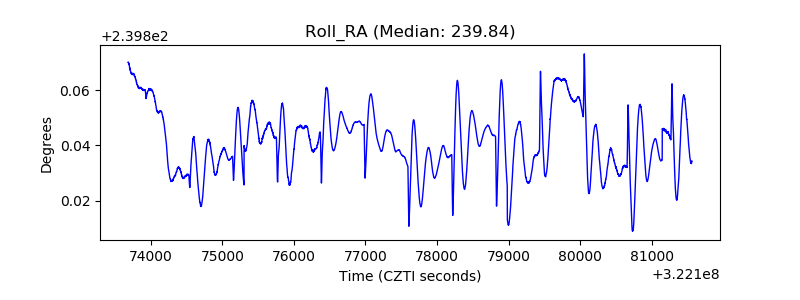 |
| Veto Counter | 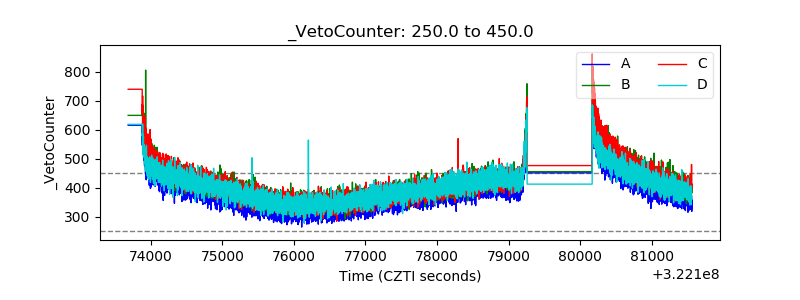 |