| Param | Original file | Final file |
|---|---|---|
| Filename | modeM0/AS1A07_067T01_9000003578_24168cztM0_level2.evt | modeM0/AS1A07_067T01_9000003578_24168cztM0_level2_quad_clean.evt |
| Size (bytes) | 728,893,440 | 92,157,120 |
| Size | 695.1 MB | 87.9 MB |
| Events in quadrant A | 3,053,445 | 644,429 |
| Events in quadrant B | 3,121,736 | 667,660 |
| Events in quadrant C | 3,125,386 | 640,000 |
| Events in quadrant D | 12,333,277 | 383,283 |
| Mode M9 | |||
|---|---|---|---|
| Quadrant | BADHDUFLAG | Total packets | Discarded packets |
| A | 0 | 10 | 0 |
| B | 0 | 10 | 0 |
| C | 0 | 10 | 0 |
| D | 0 | 10 | 0 |
| Mode SS | |||
|---|---|---|---|
| Quadrant | BADHDUFLAG | Total packets | Discarded packets |
| A | 0 | 134 | 0 |
| B | 0 | 134 | 0 |
| C | 0 | 134 | 0 |
| D | 0 | 134 | 0 |
| Mode M0 | |||
|---|---|---|---|
| Quadrant | BADHDUFLAG | Total packets | Discarded packets |
| A | 0 | 13352 | 1 |
| B | 0 | 13504 | 1 |
| C | 0 | 13536 | 1 |
| D | 0 | 41187 | 1 |
| Quadrant | Total seconds | Saturated seconds | Saturation percentage |
|---|---|---|---|
| A | 6500 | 20 | 0.307692% |
| B | 6501 | 38 | 0.584525% |
| C | 6501 | 68 | 1.045993% |
| D | 6501 | 3802 | 58.483310% |
Noise dominated data is calculated using 1-second bins in cleaned event files. If a bin has >2000 counts, and if more than 50% of those come from <1% of pixels, then it is considered to be noise-dominated and hence unusable.
| Quadrant | # 1 sec bins | Bins with >0 counts | Bins with >2000 counts | High rate bins dominated by noise | Noise dominated (total time) | Noise dominated (detector-on time) | Marked lightcurve |
|---|---|---|---|---|---|---|---|
| A | 7555 | 6501 | 0 | 0 | 0.00% | 0.00% | 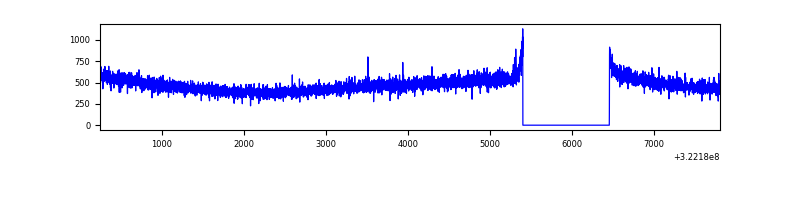 |
| B | 7556 | 6502 | 0 | 0 | 0.00% | 0.00% | 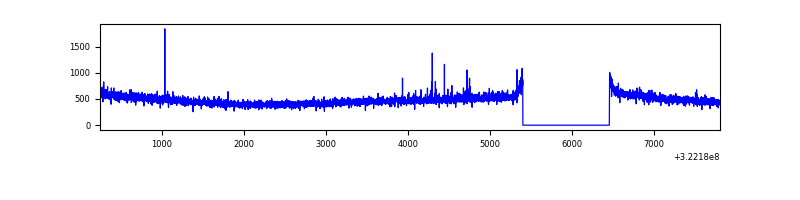 |
| C | 7556 | 6502 | 0 | 0 | 0.00% | 0.00% | 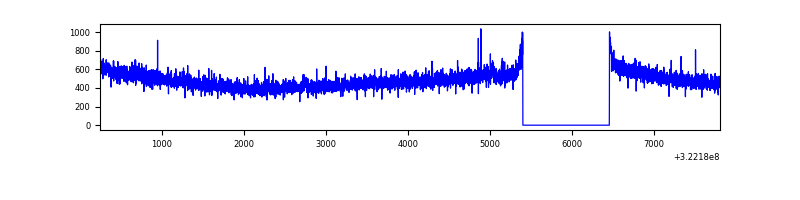 |
| D | 7556 | 6501 | 3549 | 3549 | 46.97% | 54.59% | 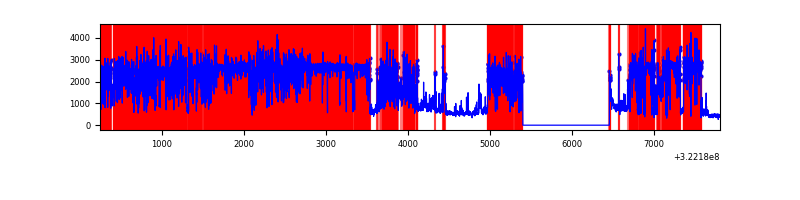 |
Top three noisy pixels from each quadrant. If the there are fewer than three noisy pixels in the level2.evt file, extra rows are filled as -1
| Pixel properties | Quadrant properties | ||||||
|---|---|---|---|---|---|---|---|
| Quadrant | DetID | PixID | Counts | Sigma | Mean | Median | Sigma |
| A | 13 | 254 | 10309 | 60.05 | 790 | 773 | 158.8 |
| A | 3 | 1 | 6748 | 37.63 | 790 | 773 | 158.8 |
| A | 0 | 226 | 6745 | 37.61 | 790 | 773 | 158.8 |
| B | 12 | 111 | 18440 | 117.29 | 795 | 775 | 150.6 |
| B | 11 | 111 | 15908 | 100.48 | 795 | 775 | 150.6 |
| B | 14 | 111 | 14019 | 87.94 | 795 | 775 | 150.6 |
| C | 14 | 238 | 121742 | 675.5 | 767 | 773 | 179.1 |
| C | 3 | 233 | 7480 | 37.45 | 767 | 773 | 179.1 |
| C | 13 | 61 | 5269 | 25.11 | 767 | 773 | 179.1 |
| D | 7 | 238 | 9921154 | 71816.53 | 567 | 550 | 138.1 |
| D | 8 | 195 | 214297 | 1547.34 | 567 | 550 | 138.1 |
| D | 1 | 52 | 45103 | 322.52 | 567 | 550 | 138.1 |
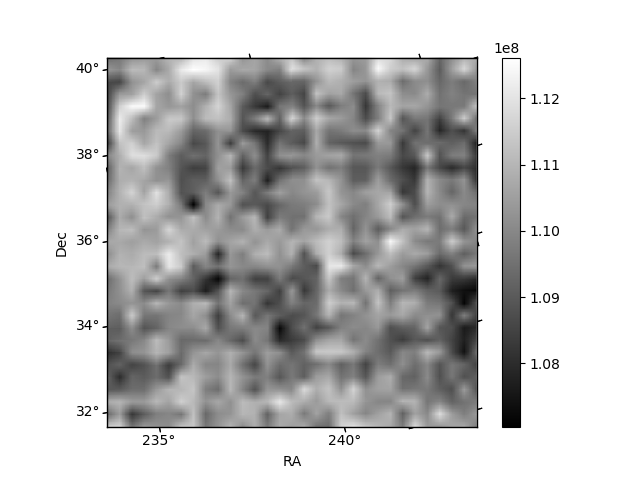
Histogram calculated using DETX and DETY for each event in the final _common_clean file
| Quadrant A | 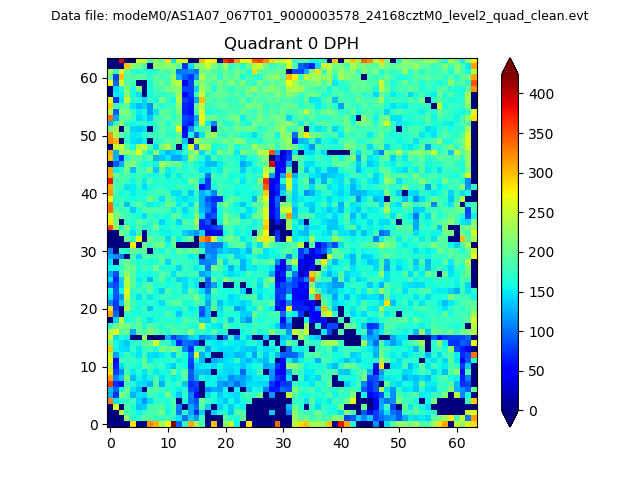 |
 |
Quadrant B |
|---|---|---|---|
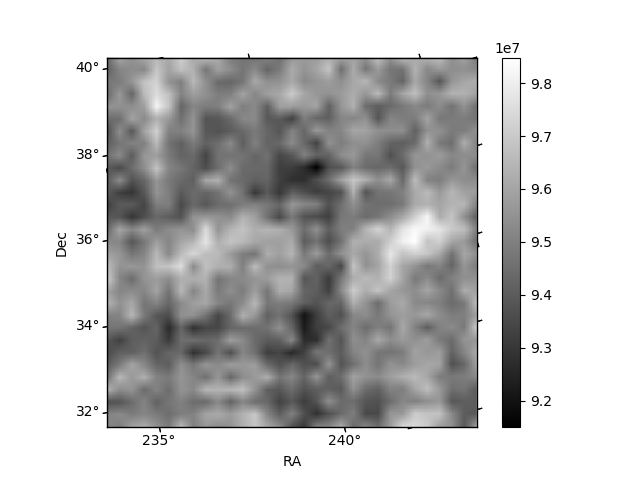
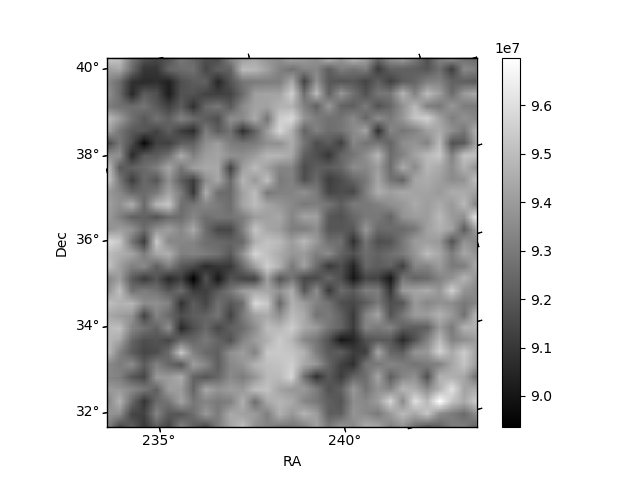
| Quadrant D | 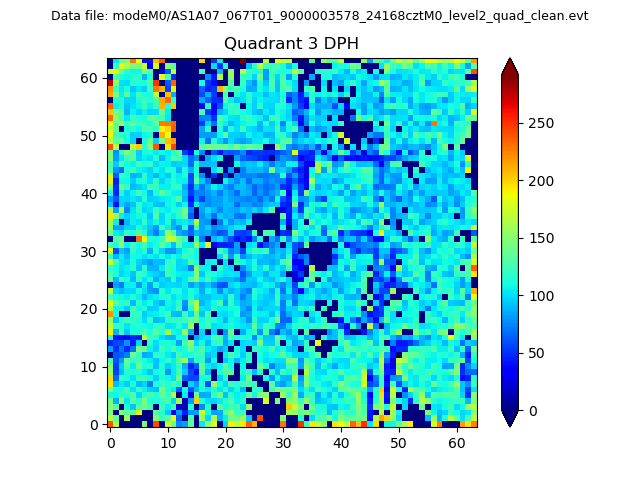 |
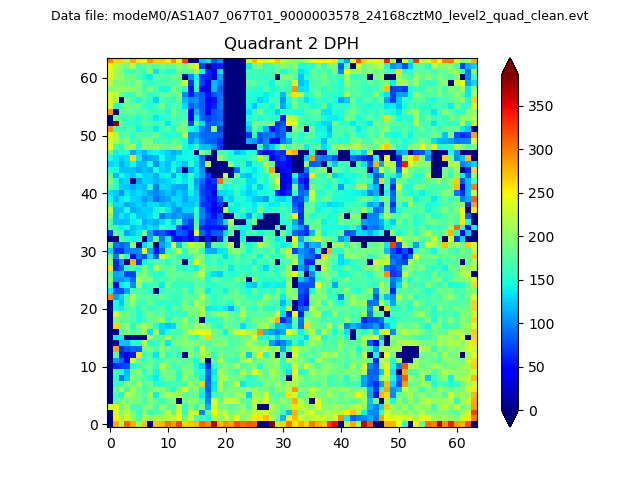 |
Quadrant C |
| Plot type | Count rate plots | Images |
|---|---|---|
| Comparison with Poisson distribution Blue bars denote a histogram of data divided into 1 sec bins. Red curve is a Poisson curve with rate = median count rate of data. |
 |
 |
| Quadrant-wise count rates Data is divided into 100 sec bins |
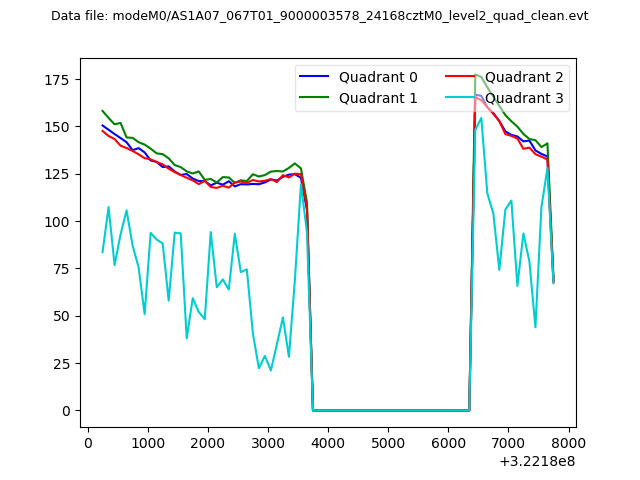 |
|
| Module-wise count rates for Quadrant A Data is divided into 100 sec bins |
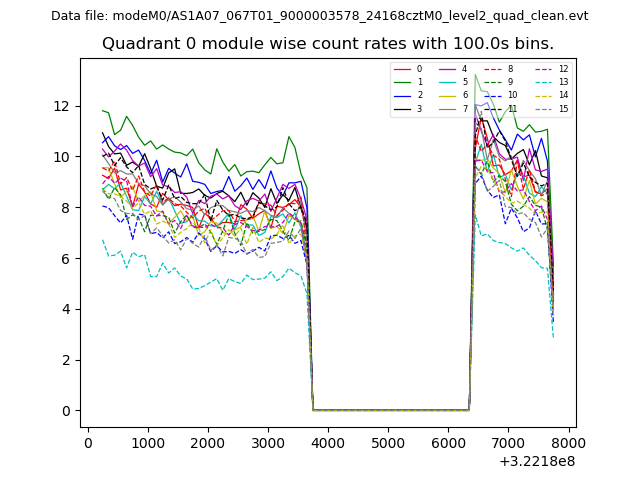 |
 |
| Module-wise count rates for Quadrant B Data is divided into 100 sec bins |
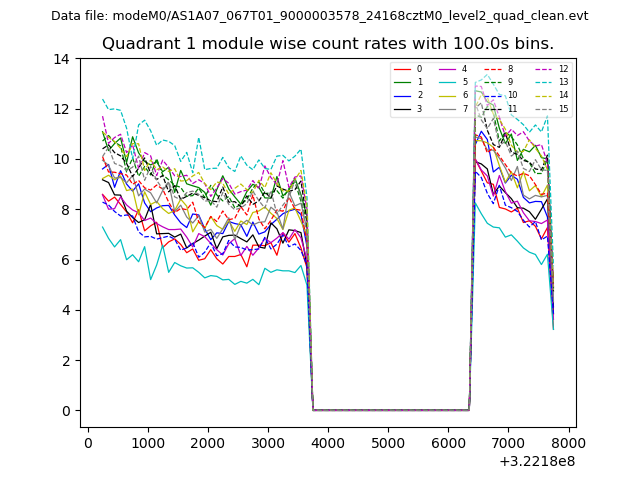 |
 |
| Module-wise count rates for Quadrant C Data is divided into 100 sec bins |
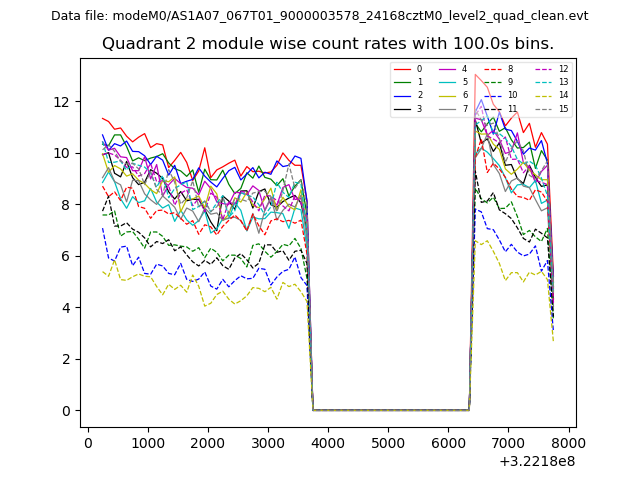 |
 |
| Module-wise count rates for Quadrant D Data is divided into 100 sec bins |
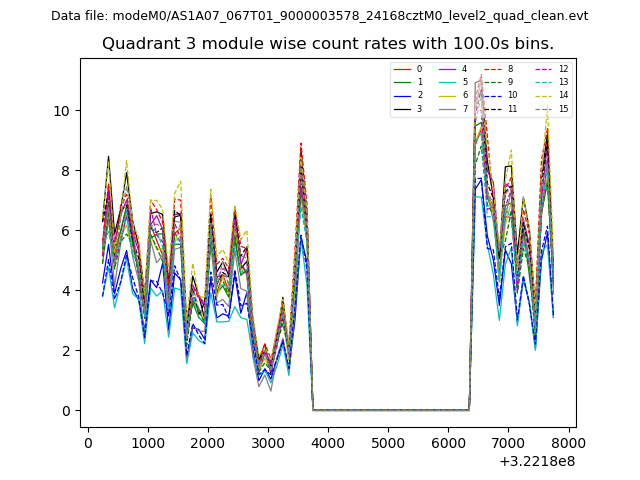 |
 |
| Parameter | Plot |
|---|---|
| CZT HV Monitor | 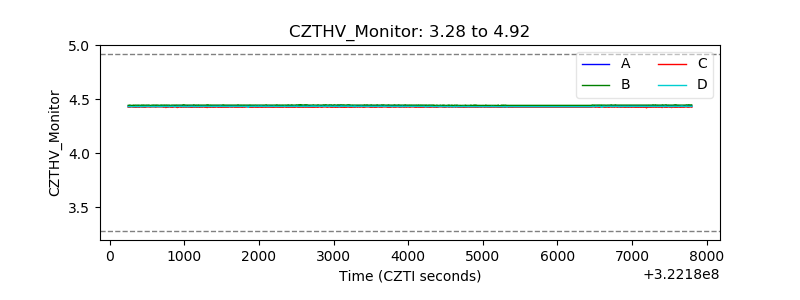 |
| D_VDD | 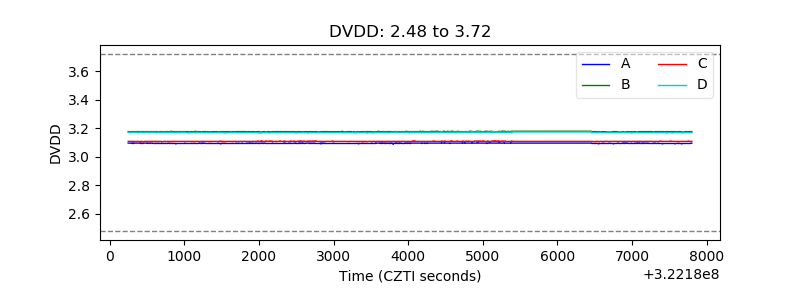 |
| Temperature 1 | 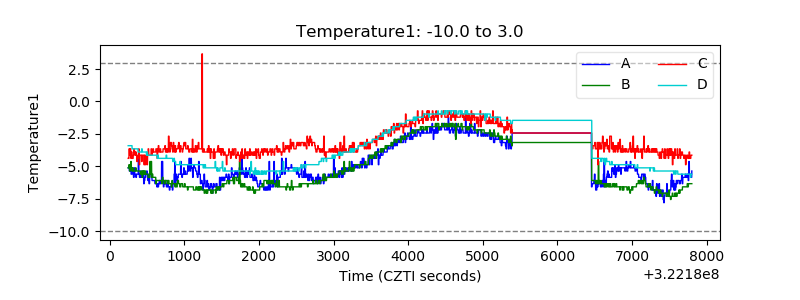 |
| Veto HV Monitor | 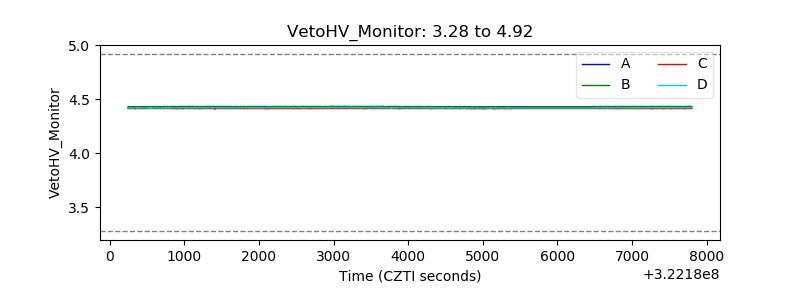 |
| Veto LLD | 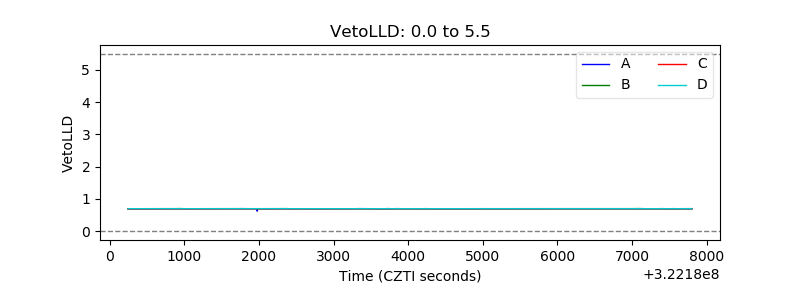 |
| Alpha Counter | 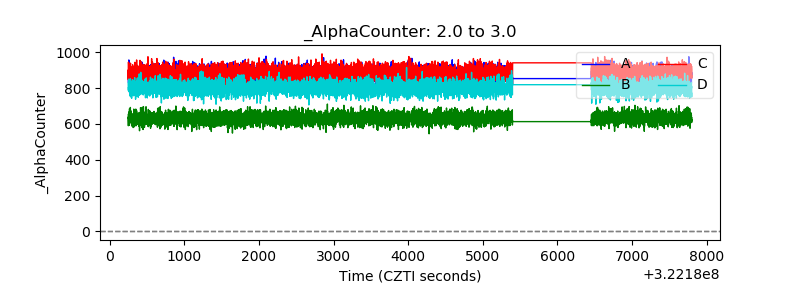 |
| _CPM_Rate | 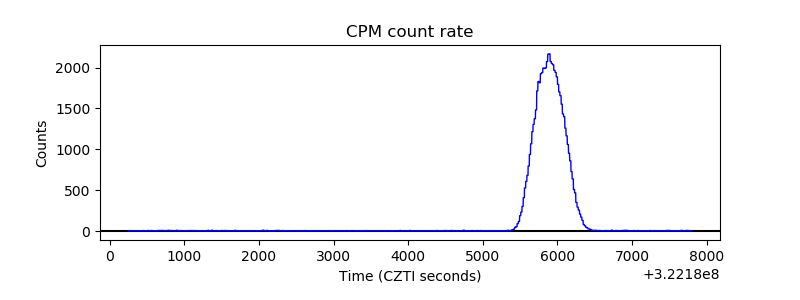 |
| CZT Counter | 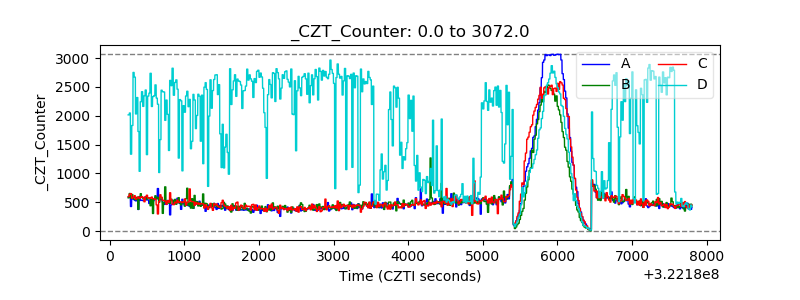 |
| +2.5 Volts monitor |  |
| +5 Volts monitor |  |
| _ROLL_ROT | 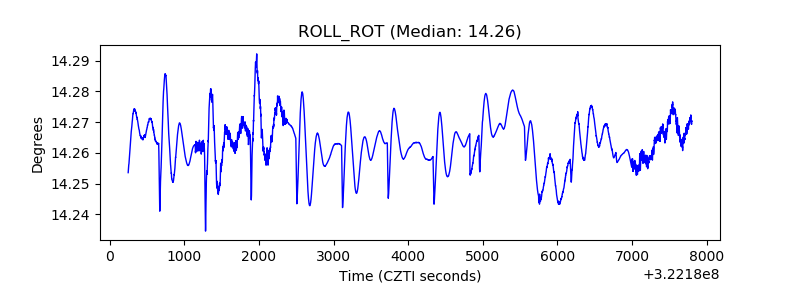 |
| _Roll_DEC | 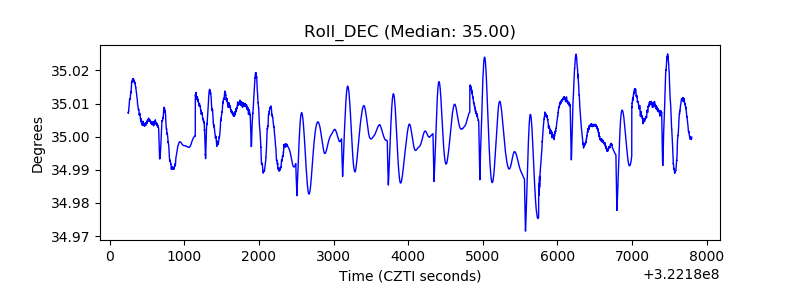 |
| _Roll_RA | 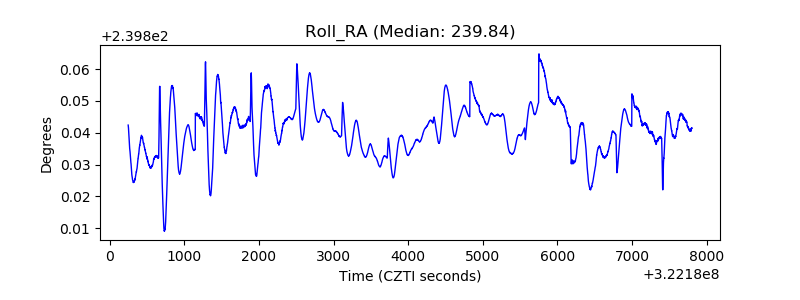 |
| Veto Counter | 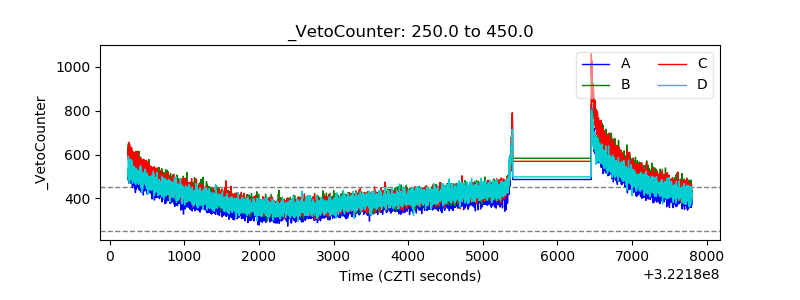 |