| Param | Original file | Final file |
|---|---|---|
| Filename | modeM0/AS1A07_067T01_9000003578_24170cztM0_level2.evt | modeM0/AS1A07_067T01_9000003578_24170cztM0_level2_quad_clean.evt |
| Size (bytes) | 568,169,280 | 95,785,920 |
| Size | 541.8 MB | 91.3 MB |
| Events in quadrant A | 3,071,897 | 633,610 |
| Events in quadrant B | 3,163,935 | 656,519 |
| Events in quadrant C | 3,130,329 | 623,435 |
| Events in quadrant D | 7,410,104 | 543,781 |
| Mode M9 | |||
|---|---|---|---|
| Quadrant | BADHDUFLAG | Total packets | Discarded packets |
| A | 0 | 12 | 0 |
| B | 0 | 13 | 0 |
| C | 0 | 13 | 0 |
| D | 0 | 13 | 0 |
| Mode SS | |||
|---|---|---|---|
| Quadrant | BADHDUFLAG | Total packets | Discarded packets |
| A | 0 | 130 | 0 |
| B | 0 | 130 | 0 |
| C | 0 | 130 | 0 |
| D | 0 | 130 | 0 |
| Mode M0 | |||
|---|---|---|---|
| Quadrant | BADHDUFLAG | Total packets | Discarded packets |
| A | 0 | 13180 | 2 |
| B | 0 | 13454 | 2 |
| C | 0 | 13360 | 2 |
| D | 0 | 26520 | 2 |
| Quadrant | Total seconds | Saturated seconds | Saturation percentage |
|---|---|---|---|
| A | 6347 | 17 | 0.267843% |
| B | 6347 | 29 | 0.456909% |
| C | 6347 | 50 | 0.787774% |
| D | 6347 | 1536 | 24.200410% |
Noise dominated data is calculated using 1-second bins in cleaned event files. If a bin has >2000 counts, and if more than 50% of those come from <1% of pixels, then it is considered to be noise-dominated and hence unusable.
| Quadrant | # 1 sec bins | Bins with >0 counts | Bins with >2000 counts | High rate bins dominated by noise | Noise dominated (total time) | Noise dominated (detector-on time) | Marked lightcurve |
|---|---|---|---|---|---|---|---|
| A | 7547 | 6348 | 0 | 0 | 0.00% | 0.00% | 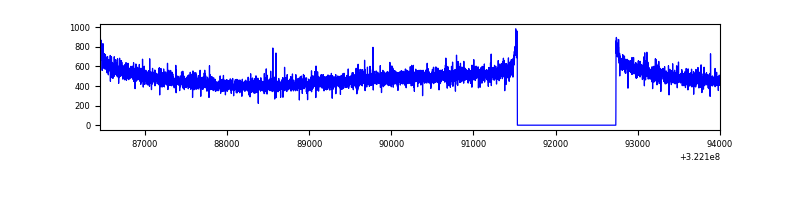 |
| B | 7547 | 6348 | 6 | 6 | 0.08% | 0.09% | 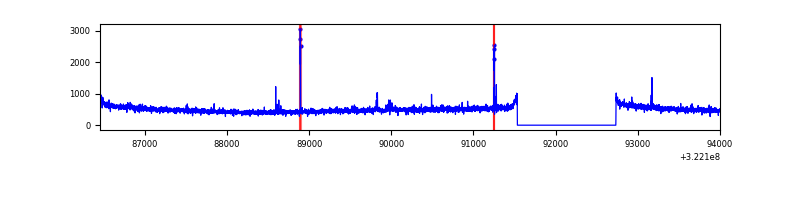 |
| C | 7547 | 6348 | 0 | 0 | 0.00% | 0.00% | 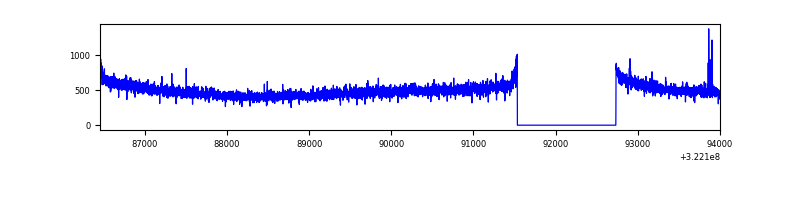 |
| D | 7547 | 6348 | 1304 | 1304 | 17.28% | 20.54% | 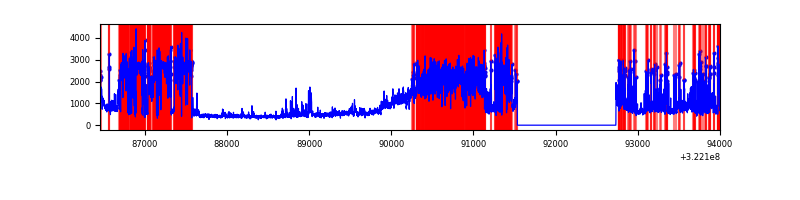 |
Top three noisy pixels from each quadrant. If the there are fewer than three noisy pixels in the level2.evt file, extra rows are filled as -1
| Pixel properties | Quadrant properties | ||||||
|---|---|---|---|---|---|---|---|
| Quadrant | DetID | PixID | Counts | Sigma | Mean | Median | Sigma |
| A | 13 | 254 | 9756 | 56.43 | 797 | 783 | 159.0 |
| A | 0 | 226 | 6734 | 37.42 | 797 | 783 | 159.0 |
| A | 3 | 137 | 6605 | 36.61 | 797 | 783 | 159.0 |
| B | 4 | 52 | 19196 | 121.89 | 801 | 782 | 151.1 |
| B | 12 | 111 | 17877 | 113.16 | 801 | 782 | 151.1 |
| B | 11 | 111 | 15419 | 96.89 | 801 | 782 | 151.1 |
| C | 14 | 238 | 123461 | 691.69 | 766 | 771 | 177.4 |
| C | 0 | 239 | 11530 | 60.66 | 766 | 771 | 177.4 |
| C | 7 | 247 | 7793 | 39.59 | 766 | 771 | 177.4 |
| D | 7 | 238 | 4504453 | 26708.66 | 698 | 678 | 168.6 |
| D | 8 | 195 | 212266 | 1254.78 | 698 | 678 | 168.6 |
| D | 1 | 52 | 53421 | 312.78 | 698 | 678 | 168.6 |
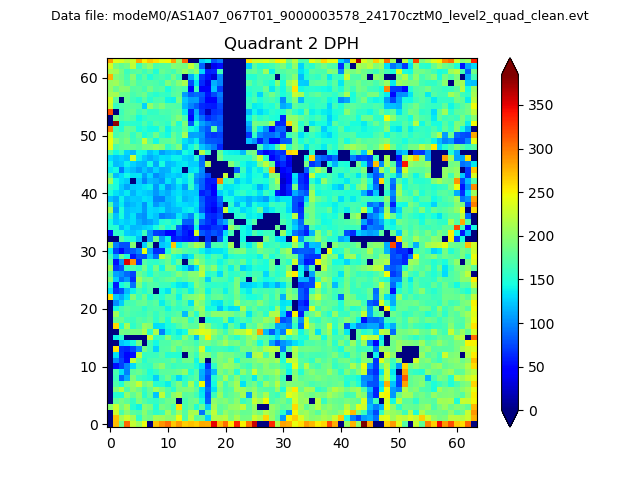
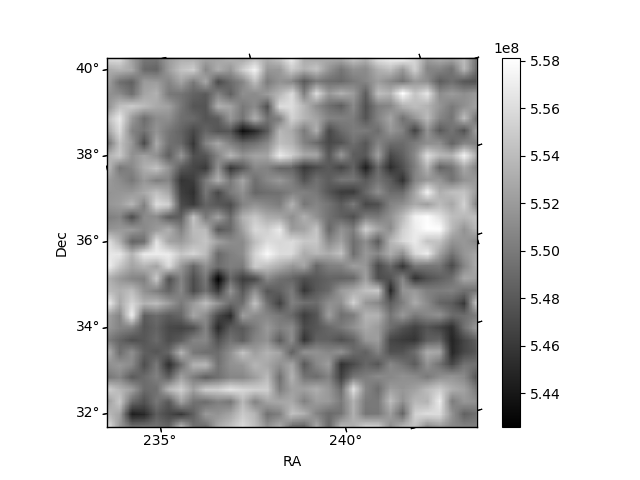
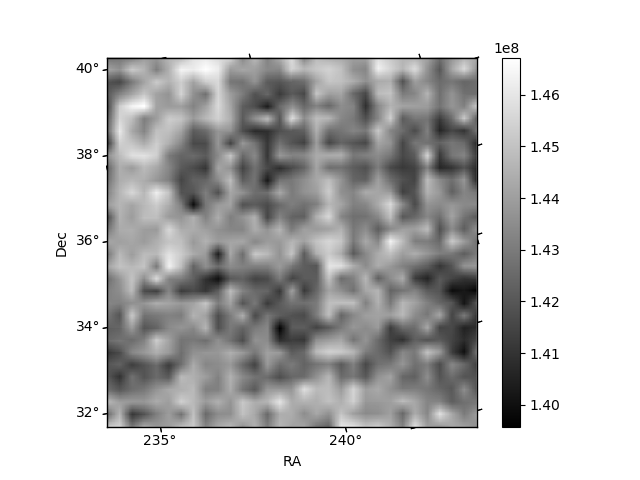
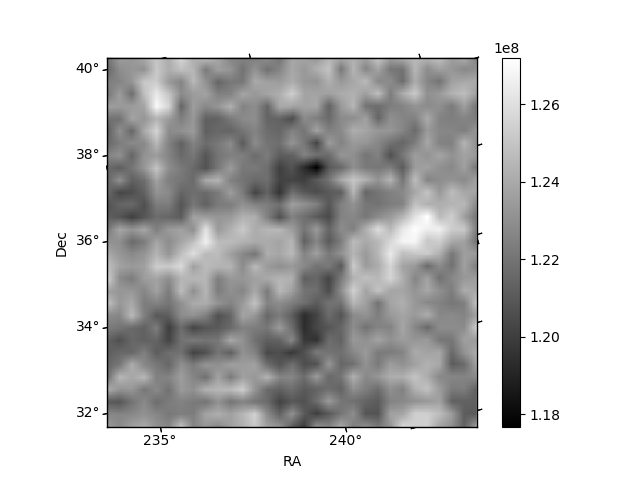
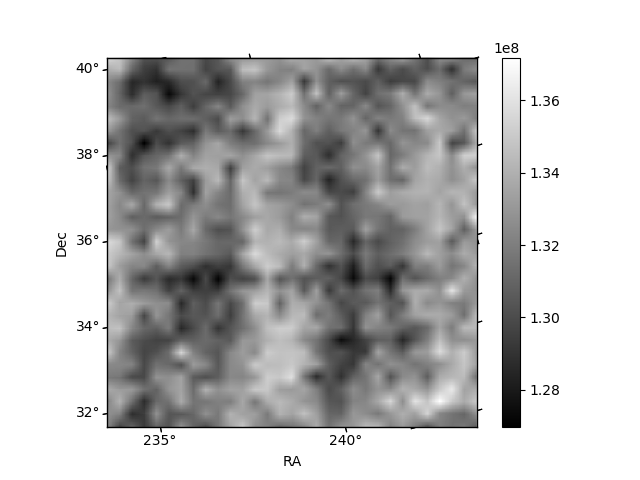
Histogram calculated using DETX and DETY for each event in the final _common_clean file
| Quadrant A | 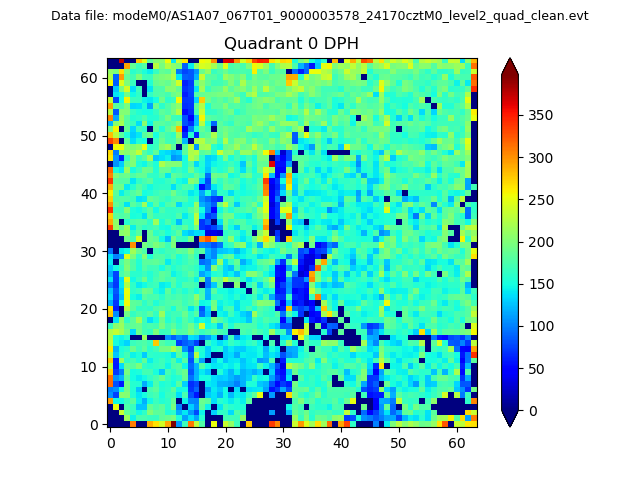 |
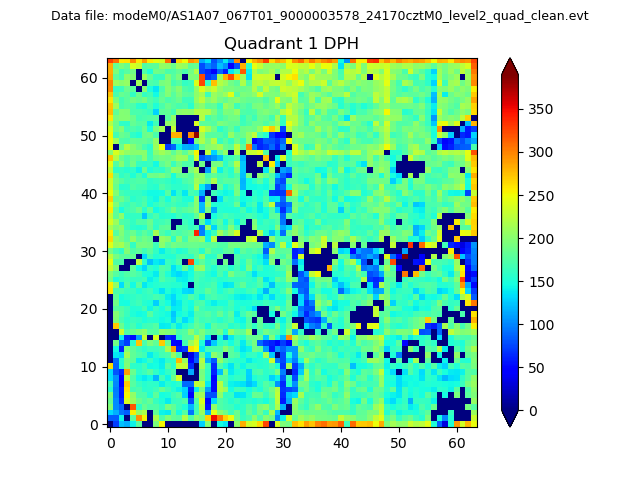 |
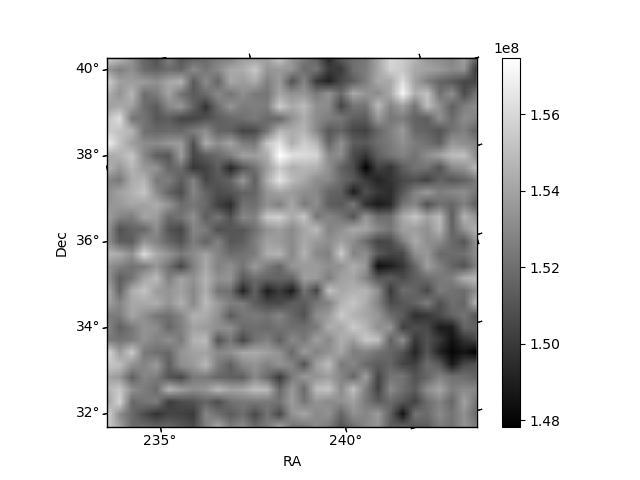
Quadrant B |
|---|---|---|---|
| Quadrant D | 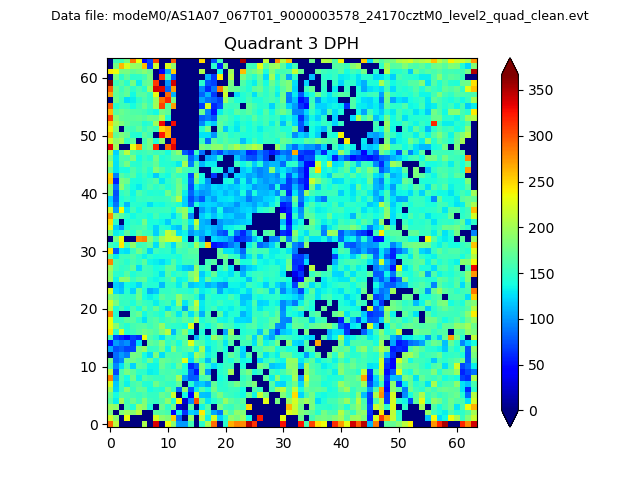 |
 |
Quadrant C |
| Plot type | Count rate plots | Images |
|---|---|---|
| Comparison with Poisson distribution Blue bars denote a histogram of data divided into 1 sec bins. Red curve is a Poisson curve with rate = median count rate of data. |
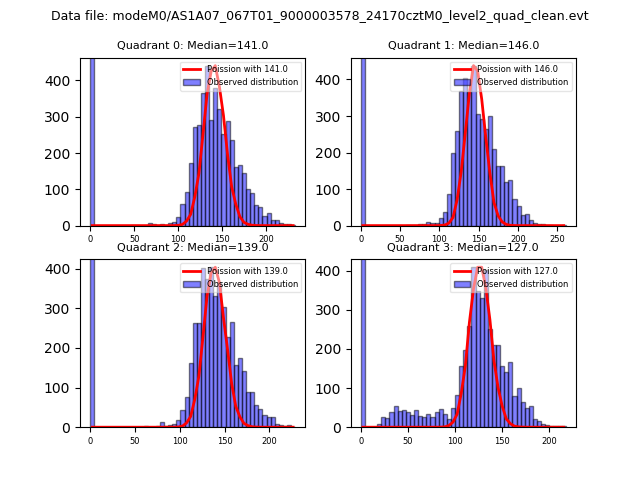 |
 |
| Quadrant-wise count rates Data is divided into 100 sec bins |
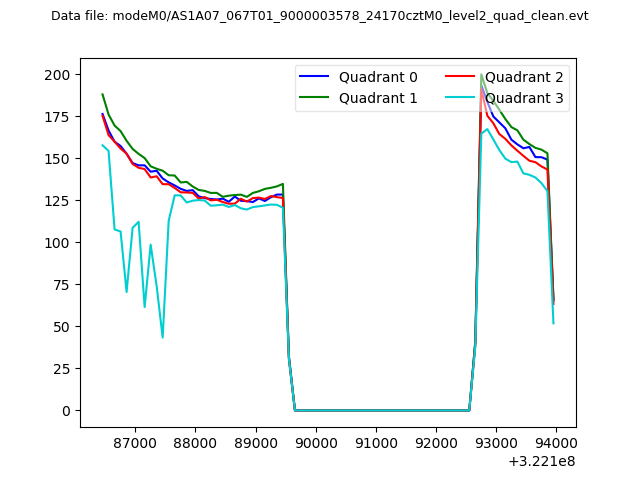 |
|
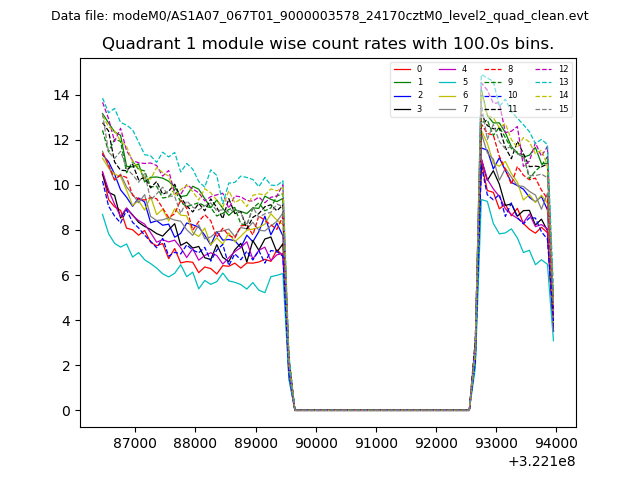
| Module-wise count rates for Quadrant A Data is divided into 100 sec bins |
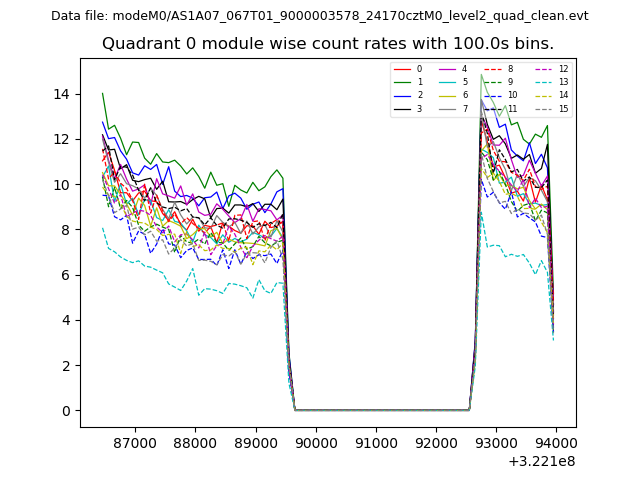 |
 |
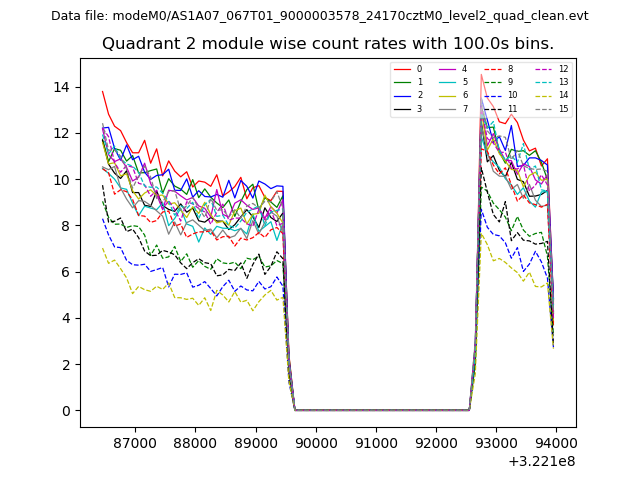
| Module-wise count rates for Quadrant B Data is divided into 100 sec bins |
 |
 |
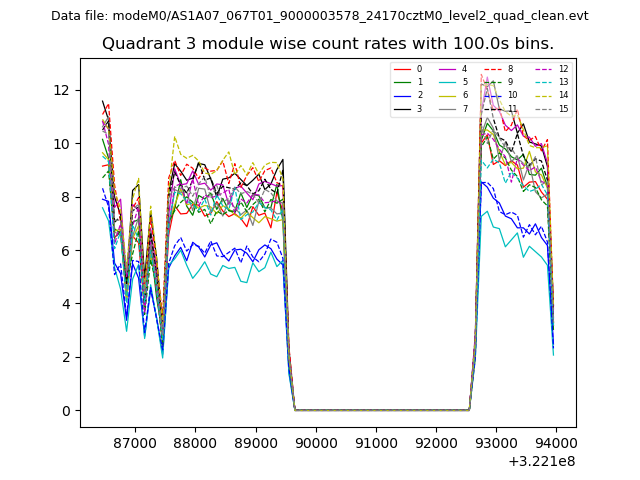
| Module-wise count rates for Quadrant C Data is divided into 100 sec bins |
 |
 |
| Module-wise count rates for Quadrant D Data is divided into 100 sec bins |
 |
 |
| Parameter | Plot |
|---|---|
| CZT HV Monitor | 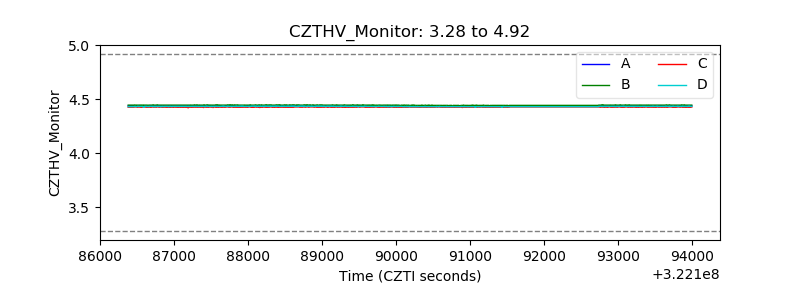 |
| D_VDD | 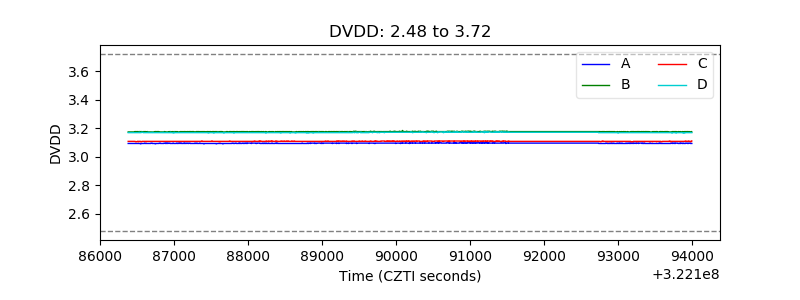 |
| Temperature 1 | 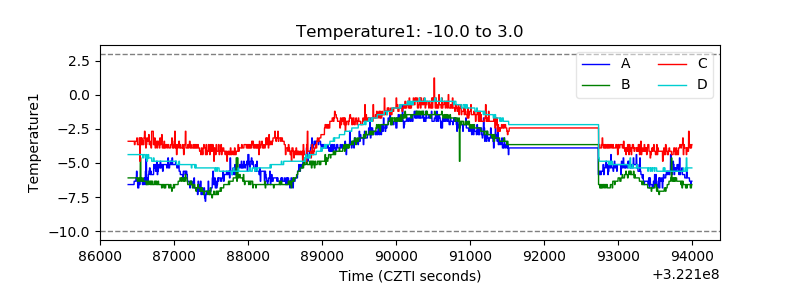 |
| Veto HV Monitor | 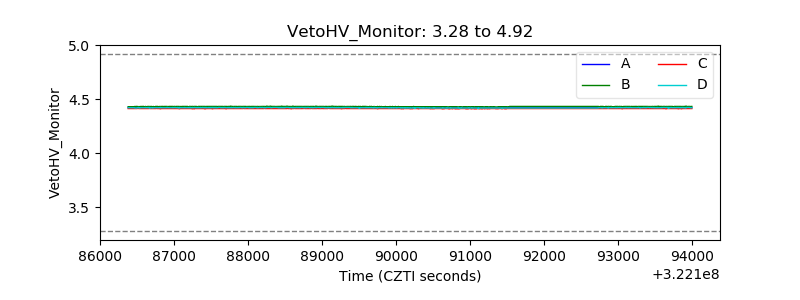 |
| Veto LLD | 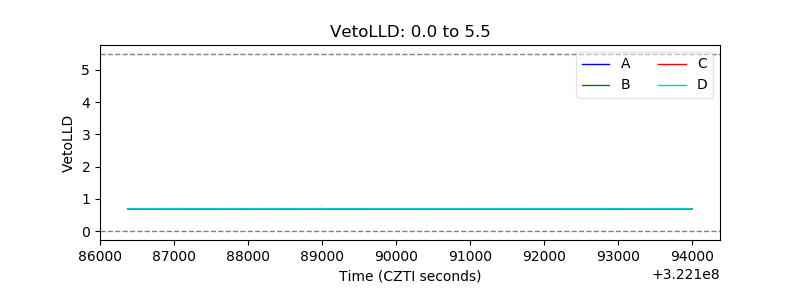 |
| Alpha Counter | 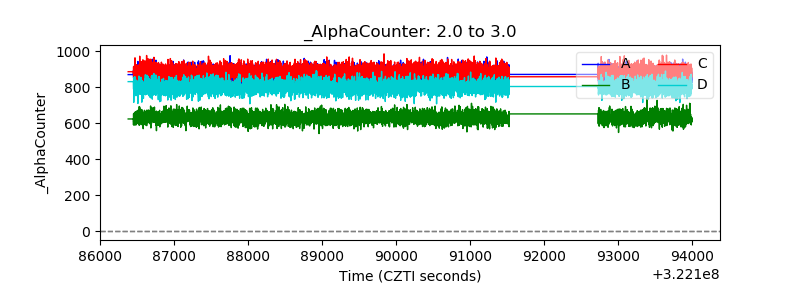 |
| _CPM_Rate | 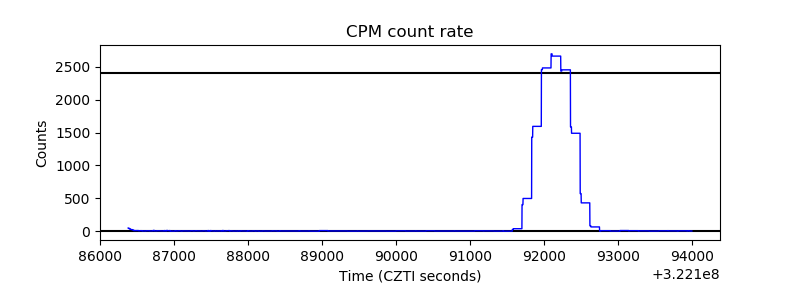 |
| CZT Counter | 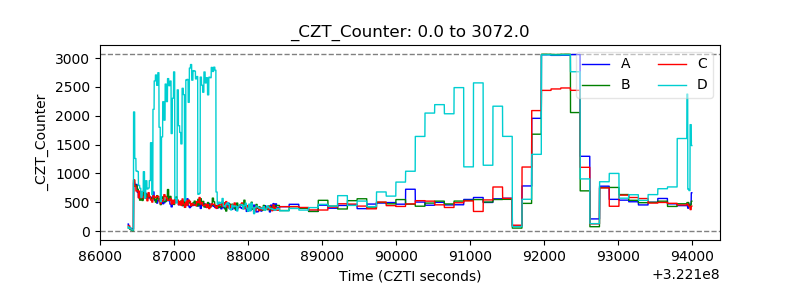 |
| +2.5 Volts monitor |  |
| +5 Volts monitor | 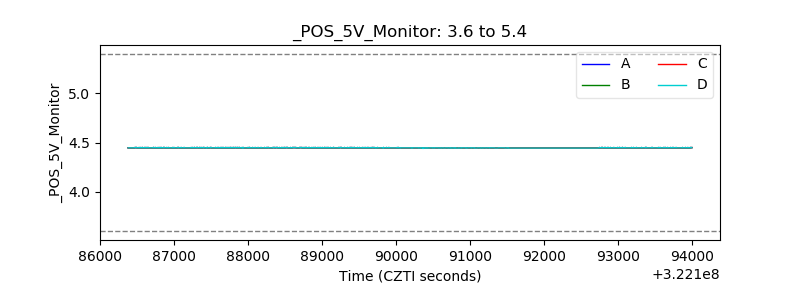 |
| _ROLL_ROT | 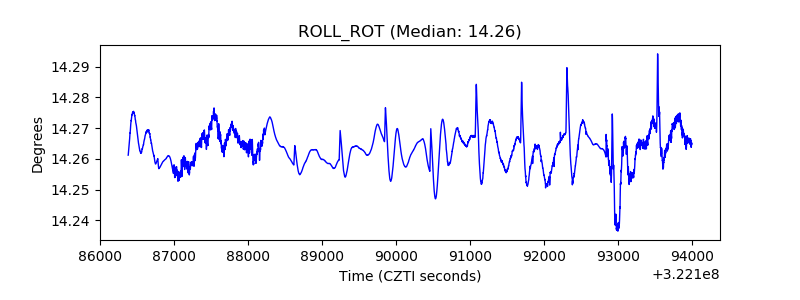 |
| _Roll_DEC | 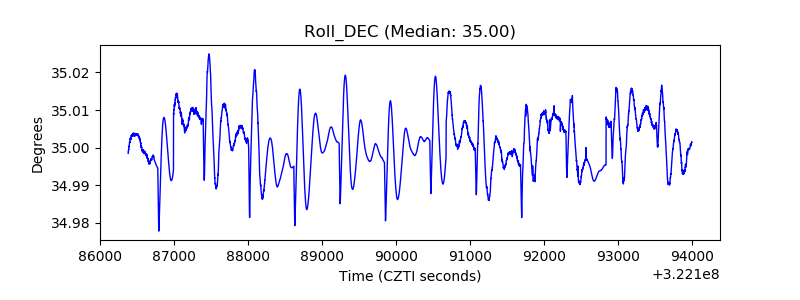 |
| _Roll_RA | 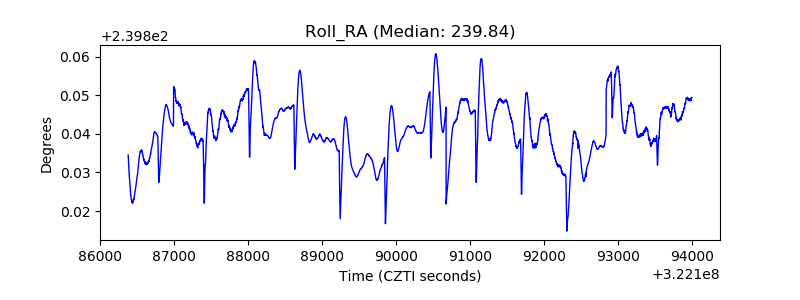 |
| Veto Counter |  |