| Param | Original file | Final file |
|---|---|---|
| Filename | modeM0/AS1A07_067T01_9000003578_24171cztM0_level2.evt | modeM0/AS1A07_067T01_9000003578_24171cztM0_level2_quad_clean.evt |
| Size (bytes) | 638,665,920 | 95,924,160 |
| Size | 609.1 MB | 91.5 MB |
| Events in quadrant A | 3,130,269 | 647,709 |
| Events in quadrant B | 3,185,342 | 669,016 |
| Events in quadrant C | 3,238,156 | 628,031 |
| Events in quadrant D | 9,365,992 | 524,501 |
| Mode M9 | |||
|---|---|---|---|
| Quadrant | BADHDUFLAG | Total packets | Discarded packets |
| A | 0 | 22 | 0 |
| B | 0 | 23 | 0 |
| C | 0 | 23 | 0 |
| D | 0 | 23 | 0 |
| Mode SS | |||
|---|---|---|---|
| Quadrant | BADHDUFLAG | Total packets | Discarded packets |
| A | 0 | 126 | 0 |
| B | 0 | 126 | 0 |
| C | 0 | 126 | 0 |
| D | 0 | 126 | 0 |
| Mode M0 | |||
|---|---|---|---|
| Quadrant | BADHDUFLAG | Total packets | Discarded packets |
| A | 0 | 13061 | 2 |
| B | 0 | 13216 | 2 |
| C | 0 | 13458 | 2 |
| D | 0 | 32176 | 7 |
| Quadrant | Total seconds | Saturated seconds | Saturation percentage |
|---|---|---|---|
| A | 6240 | 9 | 0.144231% |
| B | 6240 | 17 | 0.272436% |
| C | 6240 | 84 | 1.346154% |
| D | 6239 | 2266 | 36.319923% |
Noise dominated data is calculated using 1-second bins in cleaned event files. If a bin has >2000 counts, and if more than 50% of those come from <1% of pixels, then it is considered to be noise-dominated and hence unusable.
| Quadrant | # 1 sec bins | Bins with >0 counts | Bins with >2000 counts | High rate bins dominated by noise | Noise dominated (total time) | Noise dominated (detector-on time) | Marked lightcurve |
|---|---|---|---|---|---|---|---|
| A | 7560 | 6241 | 0 | 0 | 0.00% | 0.00% | 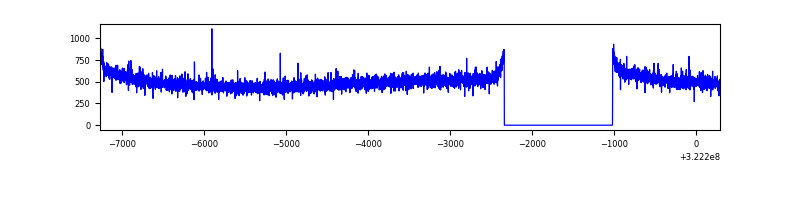 |
| B | 7560 | 6241 | 0 | 0 | 0.00% | 0.00% | 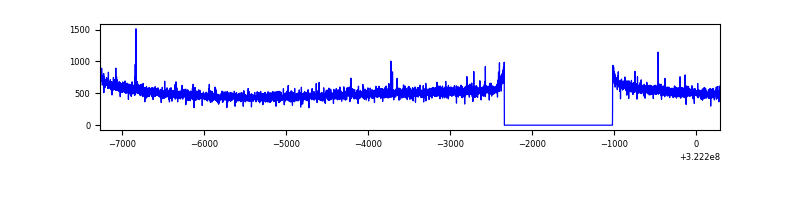 |
| C | 7560 | 6241 | 15 | 15 | 0.20% | 0.24% |  |
| D | 7559 | 6240 | 1996 | 1996 | 26.41% | 31.99% | 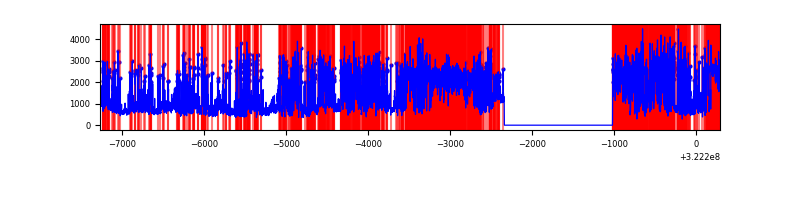 |
Top three noisy pixels from each quadrant. If the there are fewer than three noisy pixels in the level2.evt file, extra rows are filled as -1
| Pixel properties | Quadrant properties | ||||||
|---|---|---|---|---|---|---|---|
| Quadrant | DetID | PixID | Counts | Sigma | Mean | Median | Sigma |
| A | 13 | 254 | 9617 | 54.76 | 812 | 797 | 161.1 |
| A | 0 | 226 | 7266 | 40.17 | 812 | 797 | 161.1 |
| A | 3 | 137 | 6567 | 35.83 | 812 | 797 | 161.1 |
| B | 12 | 111 | 17467 | 110.26 | 813 | 796 | 151.2 |
| B | 11 | 111 | 15267 | 95.71 | 813 | 796 | 151.2 |
| B | 14 | 111 | 13513 | 84.11 | 813 | 796 | 151.2 |
| C | 14 | 238 | 126210 | 707.11 | 773 | 778 | 177.4 |
| C | 0 | 239 | 84220 | 470.4 | 773 | 778 | 177.4 |
| C | 10 | 9 | 7892 | 40.1 | 773 | 778 | 177.4 |
| D | 7 | 238 | 6152271 | 37793.47 | 671 | 654 | 162.8 |
| D | 8 | 195 | 571103 | 3504.65 | 671 | 654 | 162.8 |
| D | 1 | 52 | 73291 | 446.26 | 671 | 654 | 162.8 |
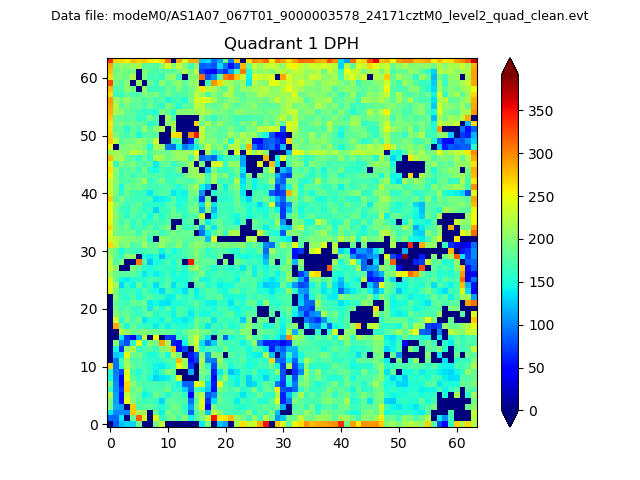
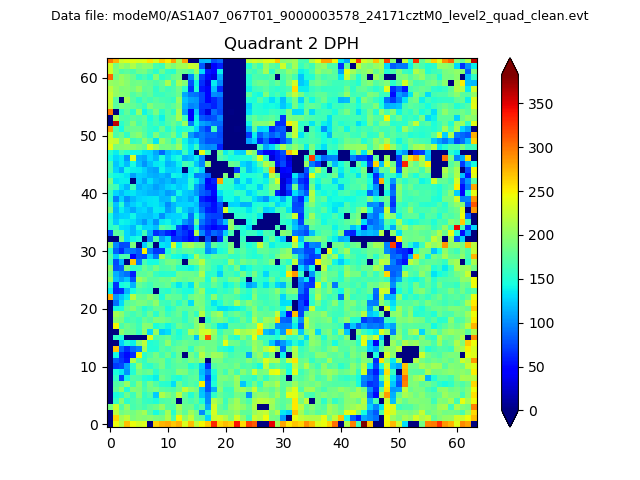
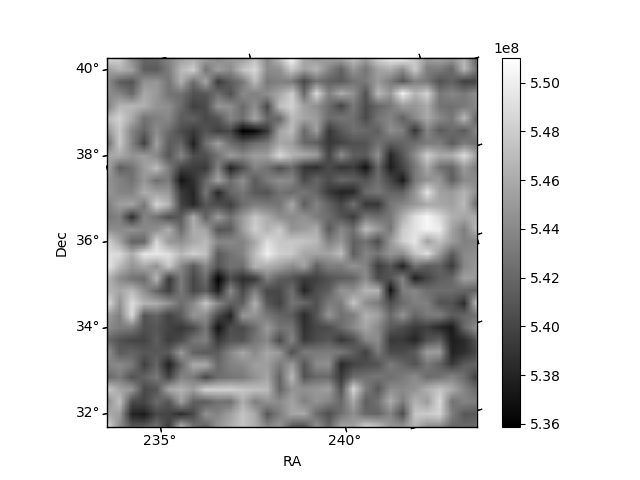
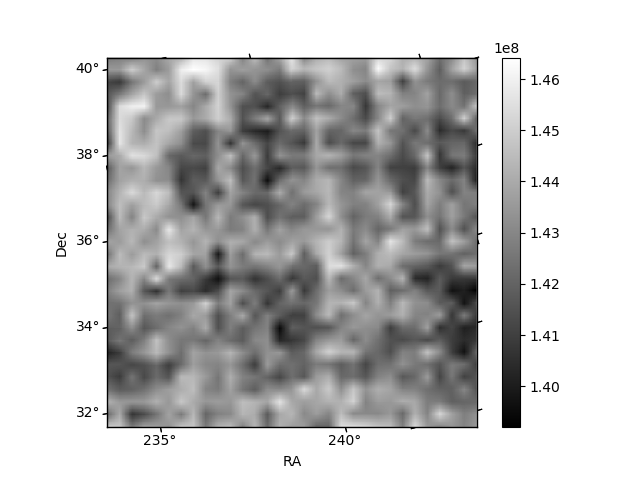
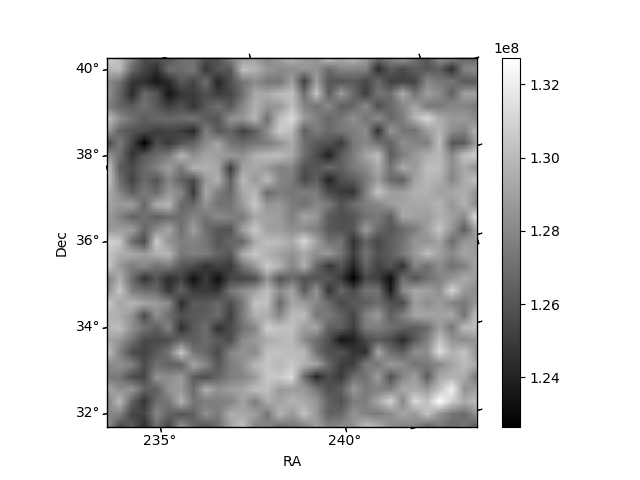
Histogram calculated using DETX and DETY for each event in the final _common_clean file
| Quadrant A | 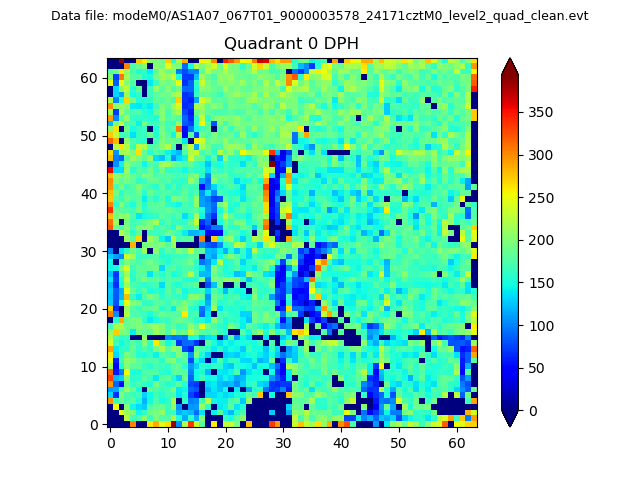 |
 |
Quadrant B |
|---|---|---|---|
| Quadrant D | 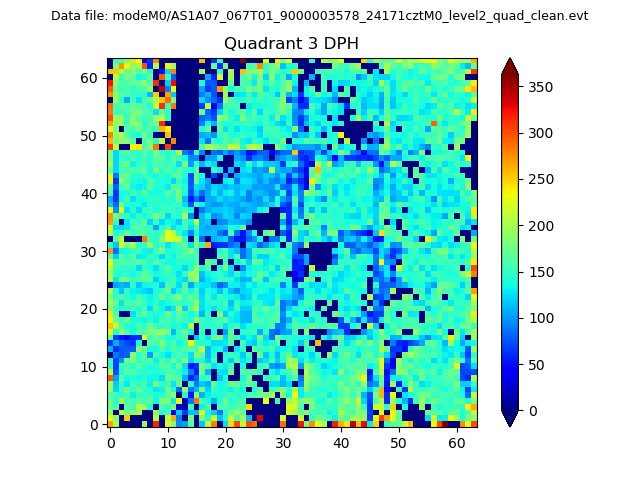 |
 |
Quadrant C |
| Plot type | Count rate plots | Images |
|---|---|---|
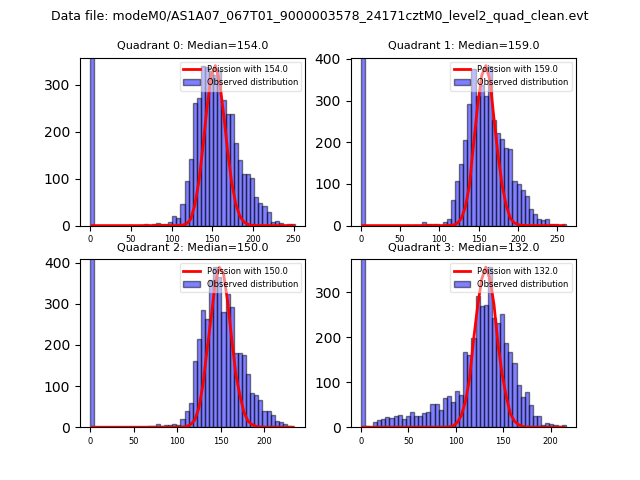
| Comparison with Poisson distribution Blue bars denote a histogram of data divided into 1 sec bins. Red curve is a Poisson curve with rate = median count rate of data. |
 |
 |
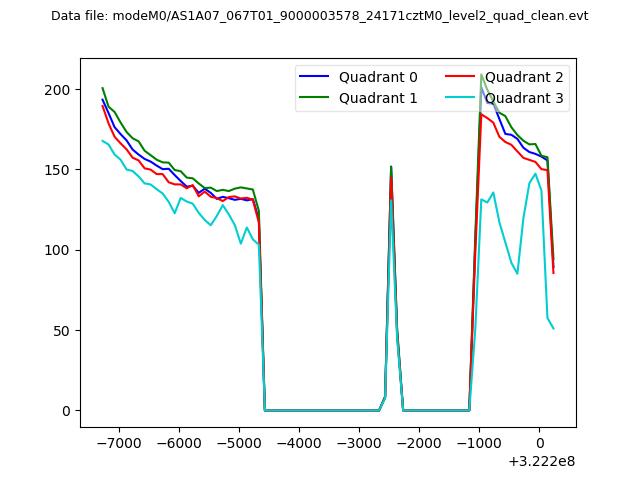
| Quadrant-wise count rates Data is divided into 100 sec bins |
 |
|
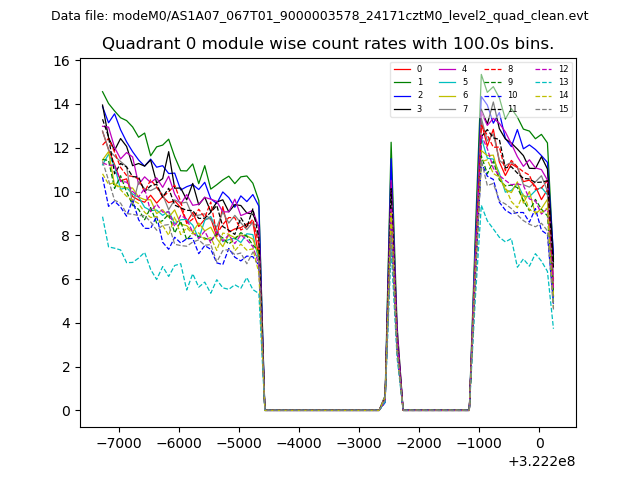
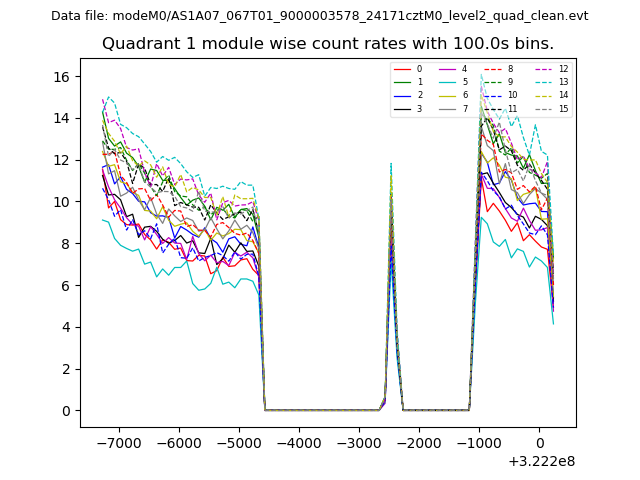
| Module-wise count rates for Quadrant A Data is divided into 100 sec bins |
 |
 |
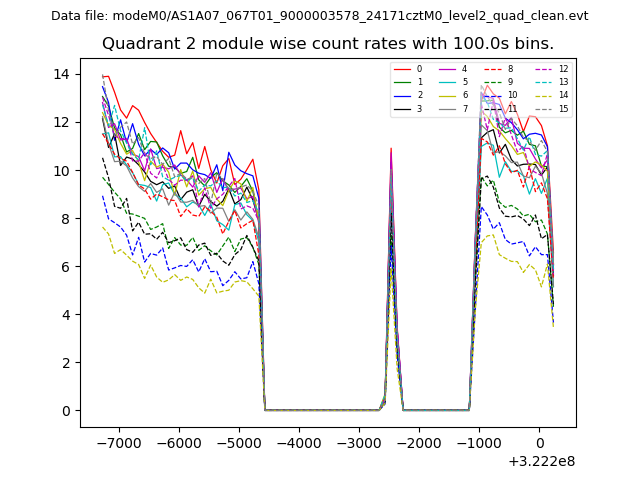
| Module-wise count rates for Quadrant B Data is divided into 100 sec bins |
 |
 |
| Module-wise count rates for Quadrant C Data is divided into 100 sec bins |
 |
 |
| Module-wise count rates for Quadrant D Data is divided into 100 sec bins |
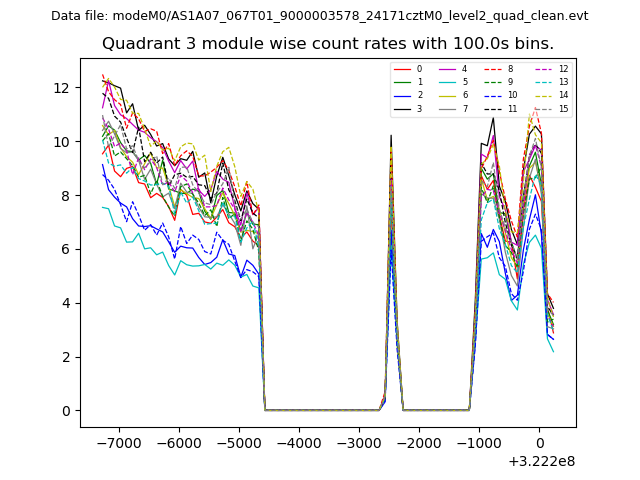 |
 |
| Parameter | Plot |
|---|---|
| CZT HV Monitor | 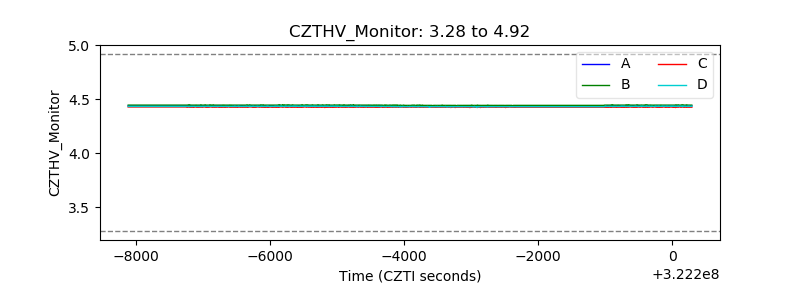 |
| D_VDD | 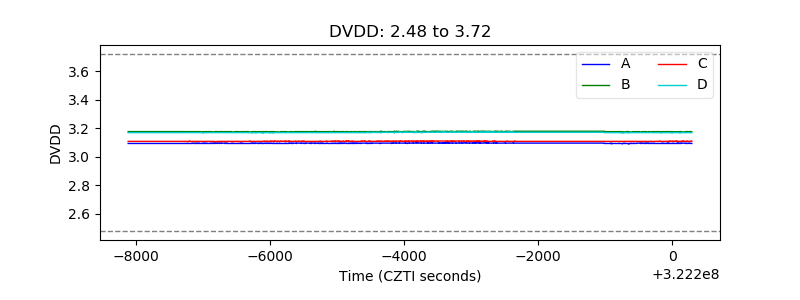 |
| Temperature 1 | 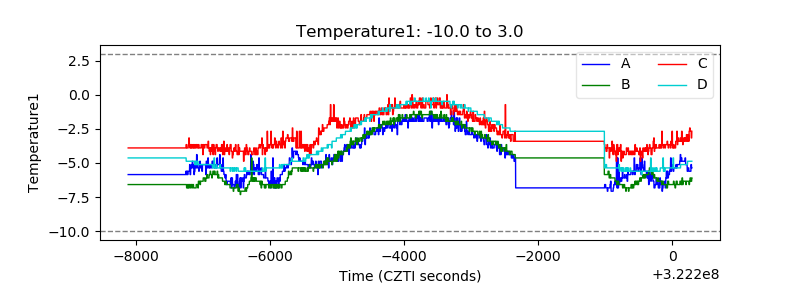 |
| Veto HV Monitor | 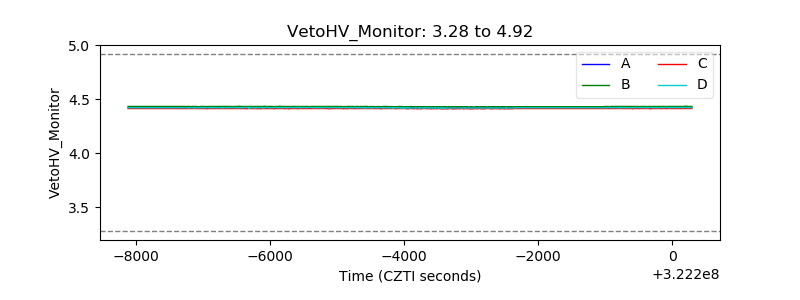 |
| Veto LLD | 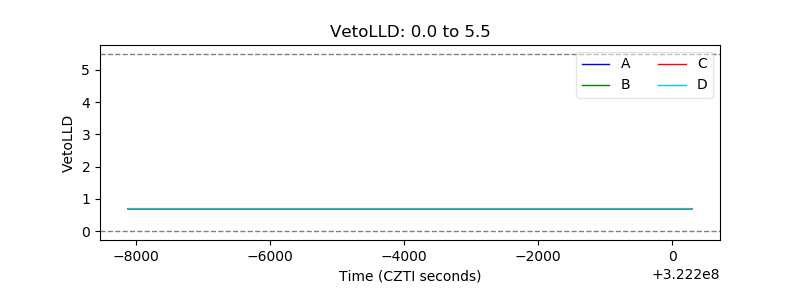 |
| Alpha Counter | 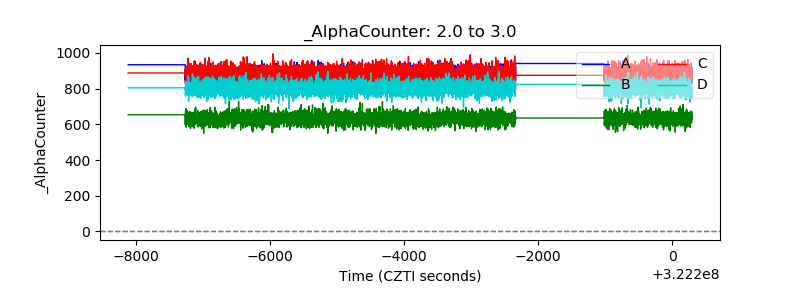 |
| _CPM_Rate | 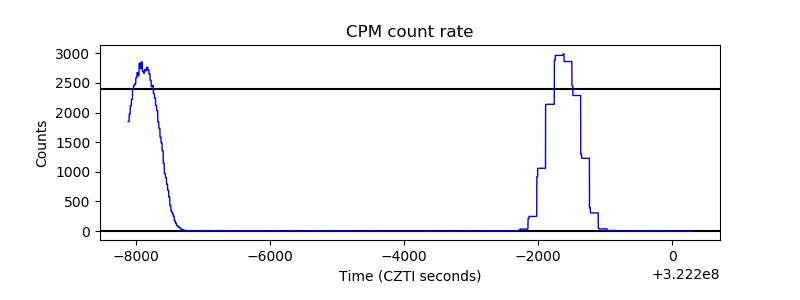 |
| CZT Counter | 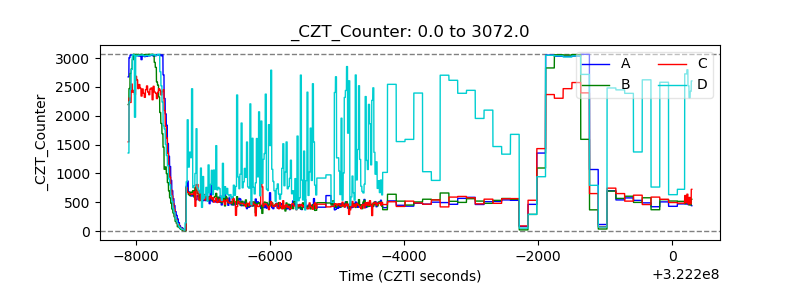 |
| +2.5 Volts monitor | 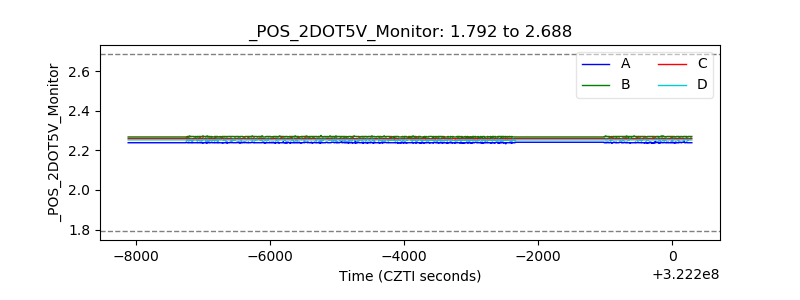 |
| +5 Volts monitor | 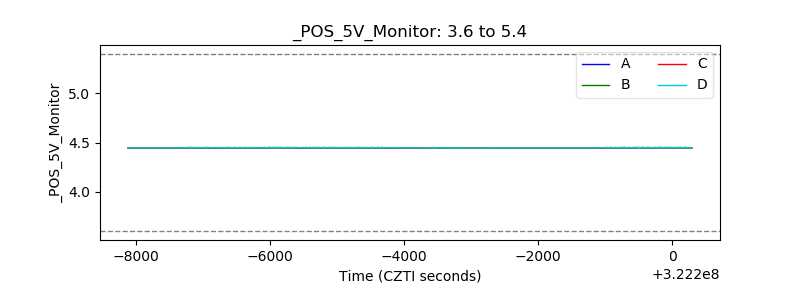 |
| _ROLL_ROT | 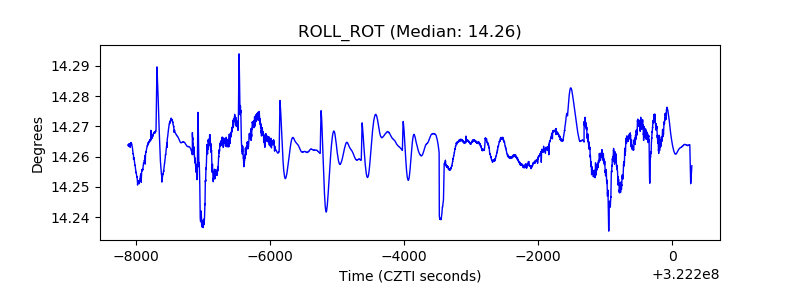 |
| _Roll_DEC | 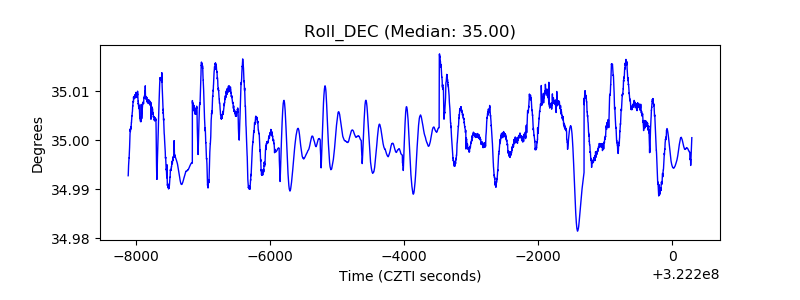 |
| _Roll_RA | 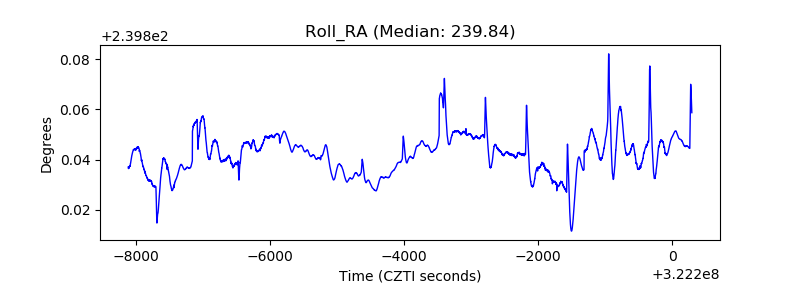 |
| Veto Counter | 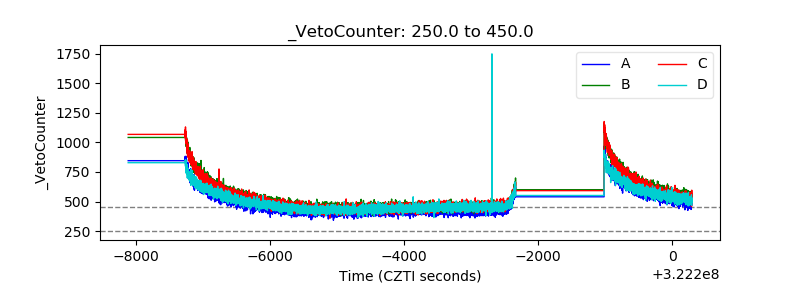 |