| Param | Original file | Final file |
|---|---|---|
| Filename | modeM0/AS1A07_067T01_9000003578_24173cztM0_level2.evt | modeM0/AS1A07_067T01_9000003578_24173cztM0_level2_quad_clean.evt |
| Size (bytes) | 570,585,600 | 90,365,760 |
| Size | 544.2 MB | 86.2 MB |
| Events in quadrant A | 3,080,144 | 610,851 |
| Events in quadrant B | 3,072,831 | 617,225 |
| Events in quadrant C | 3,211,965 | 576,786 |
| Events in quadrant D | 7,516,151 | 519,260 |
| Mode M9 | |||
|---|---|---|---|
| Quadrant | BADHDUFLAG | Total packets | Discarded packets |
| A | 0 | 13 | 0 |
| B | 0 | 13 | 0 |
| C | 0 | 13 | 0 |
| D | 0 | 13 | 0 |
| Mode SS | |||
|---|---|---|---|
| Quadrant | BADHDUFLAG | Total packets | Discarded packets |
| A | 0 | 122 | 0 |
| B | 0 | 122 | 0 |
| C | 0 | 122 | 0 |
| D | 0 | 122 | 0 |
| Mode M0 | |||
|---|---|---|---|
| Quadrant | BADHDUFLAG | Total packets | Discarded packets |
| A | 0 | 12335 | 1 |
| B | 0 | 12347 | 1 |
| C | 0 | 12862 | 1 |
| D | 0 | 26519 | 1 |
| Quadrant | Total seconds | Saturated seconds | Saturation percentage |
|---|---|---|---|
| A | 5891 | 40 | 0.679002% |
| B | 5892 | 60 | 1.018330% |
| C | 5892 | 124 | 2.104549% |
| D | 5892 | 909 | 15.427699% |
Noise dominated data is calculated using 1-second bins in cleaned event files. If a bin has >2000 counts, and if more than 50% of those come from <1% of pixels, then it is considered to be noise-dominated and hence unusable.
| Quadrant | # 1 sec bins | Bins with >0 counts | Bins with >2000 counts | High rate bins dominated by noise | Noise dominated (total time) | Noise dominated (detector-on time) | Marked lightcurve |
|---|---|---|---|---|---|---|---|
| A | 7236 | 5892 | 0 | 0 | 0.00% | 0.00% | 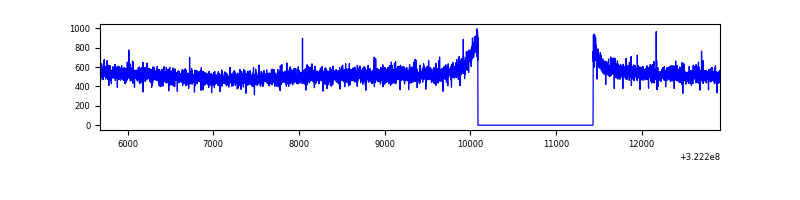 |
| B | 7237 | 5893 | 0 | 0 | 0.00% | 0.00% | 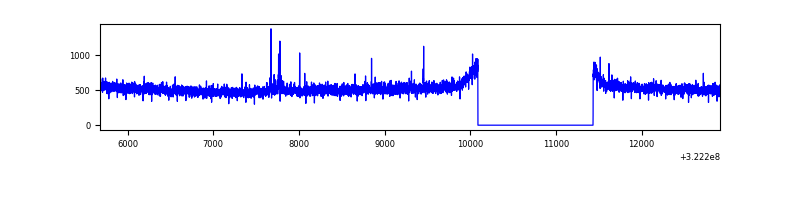 |
| C | 7237 | 5893 | 27 | 27 | 0.37% | 0.46% | 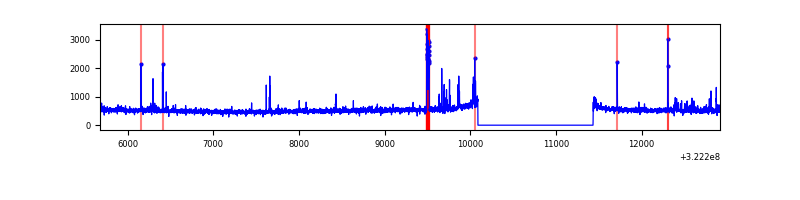 |
| D | 7237 | 5893 | 860 | 860 | 11.88% | 14.59% | 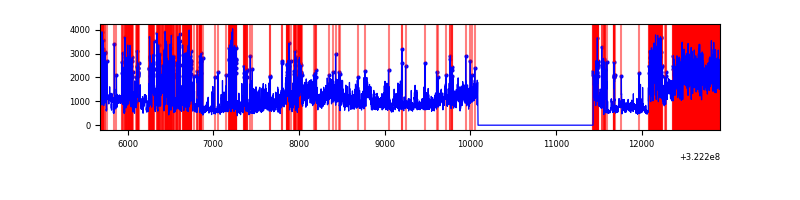 |
Top three noisy pixels from each quadrant. If the there are fewer than three noisy pixels in the level2.evt file, extra rows are filled as -1
| Pixel properties | Quadrant properties | ||||||
|---|---|---|---|---|---|---|---|
| Quadrant | DetID | PixID | Counts | Sigma | Mean | Median | Sigma |
| A | 13 | 254 | 8145 | 46.54 | 798 | 784 | 158.2 |
| A | 0 | 226 | 7157 | 40.29 | 798 | 784 | 158.2 |
| A | 3 | 137 | 6439 | 35.75 | 798 | 784 | 158.2 |
| B | 12 | 111 | 16871 | 109.77 | 782 | 766 | 146.7 |
| B | 11 | 111 | 15101 | 97.7 | 782 | 766 | 146.7 |
| B | 0 | 190 | 14834 | 95.88 | 782 | 766 | 146.7 |
| C | 0 | 239 | 124179 | 722.56 | 744 | 749 | 170.8 |
| C | 14 | 238 | 121141 | 704.78 | 744 | 749 | 170.8 |
| C | 2 | 16 | 49194 | 283.6 | 744 | 749 | 170.8 |
| D | 7 | 238 | 3514210 | 20084.28 | 729 | 706 | 174.9 |
| D | 8 | 195 | 707055 | 4037.71 | 729 | 706 | 174.9 |
| D | 12 | 218 | 306423 | 1747.57 | 729 | 706 | 174.9 |
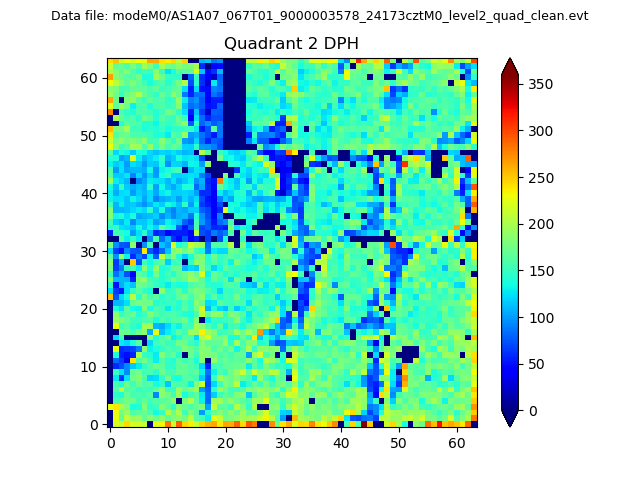
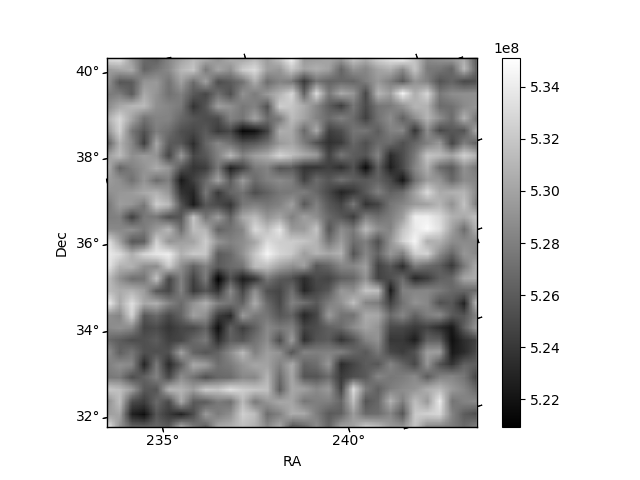
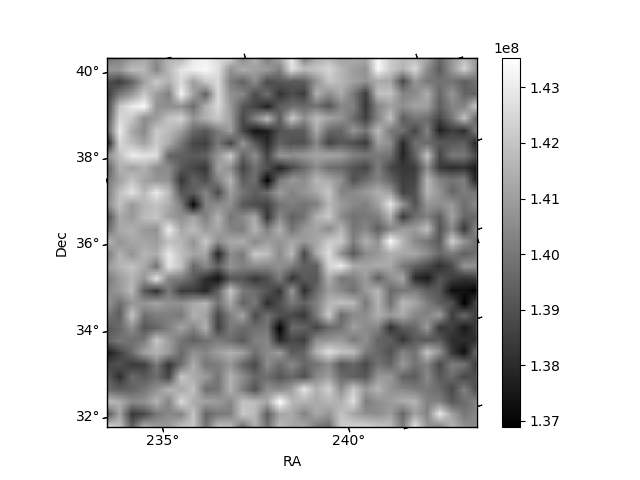
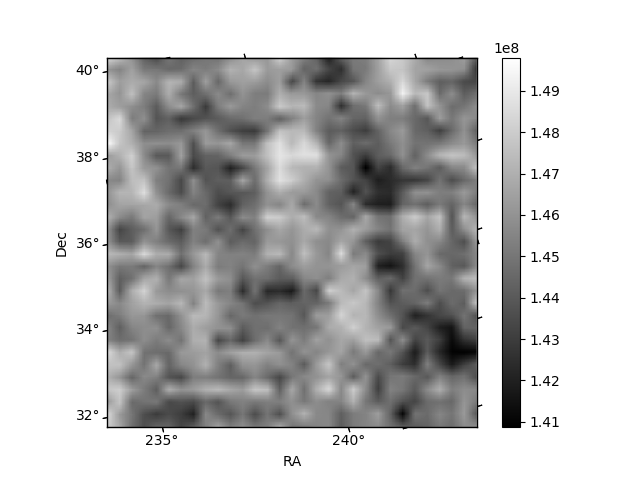
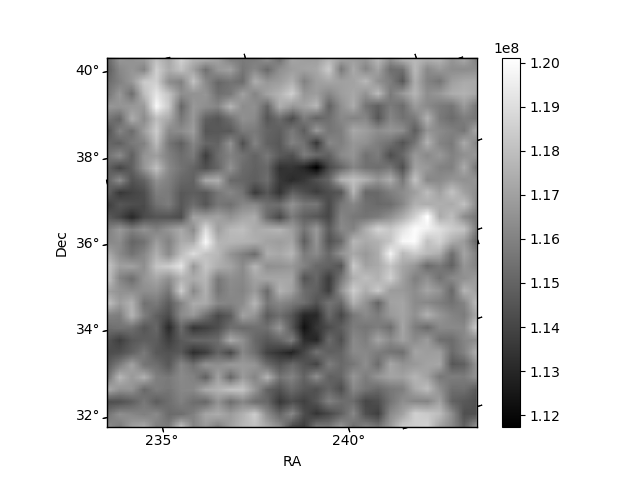
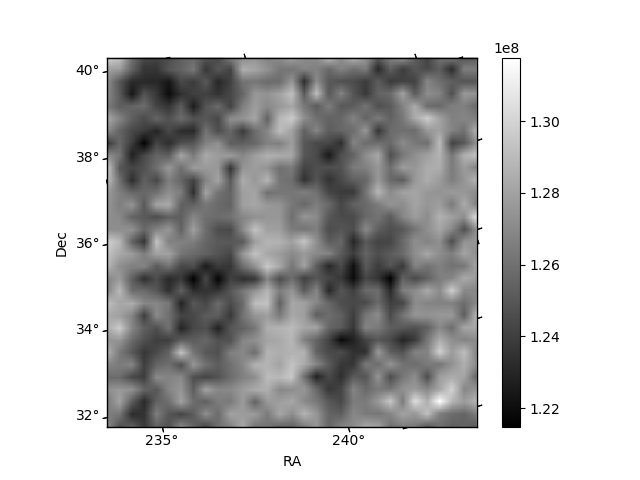
Histogram calculated using DETX and DETY for each event in the final _common_clean file
| Quadrant A | 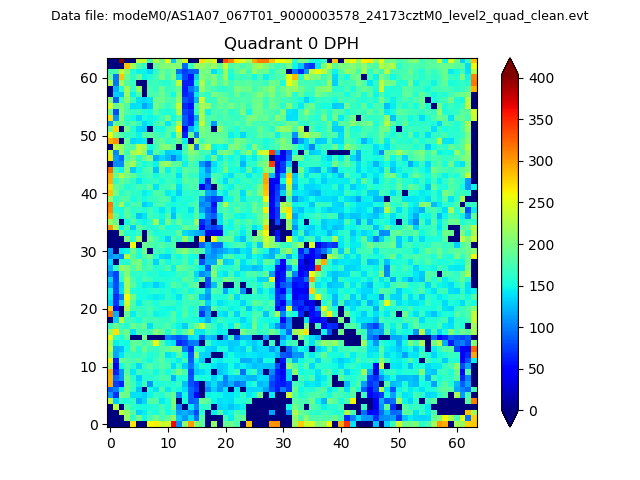 |
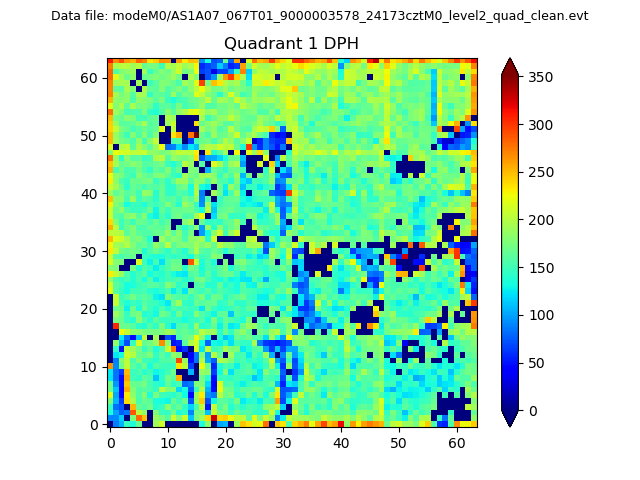 |
Quadrant B |
|---|---|---|---|
| Quadrant D | 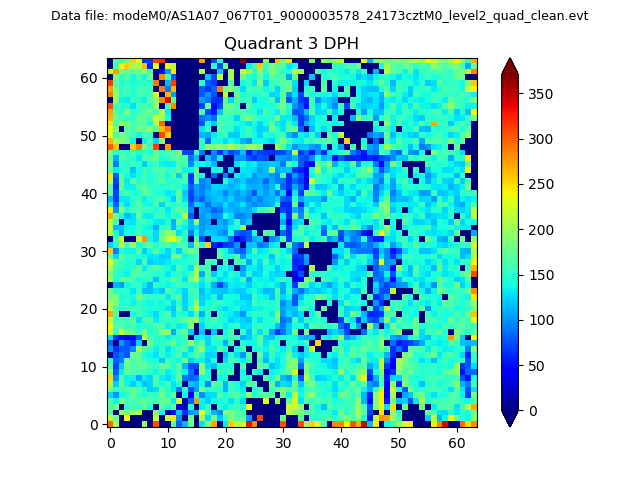 |
 |
Quadrant C |
| Plot type | Count rate plots | Images |
|---|---|---|
| Comparison with Poisson distribution Blue bars denote a histogram of data divided into 1 sec bins. Red curve is a Poisson curve with rate = median count rate of data. |
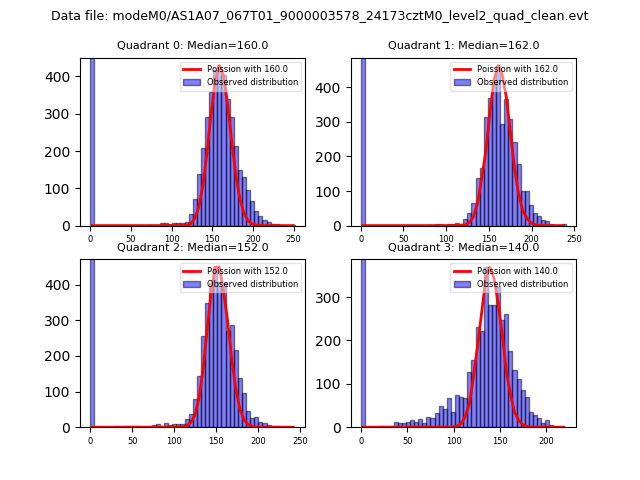 |
 |
| Quadrant-wise count rates Data is divided into 100 sec bins |
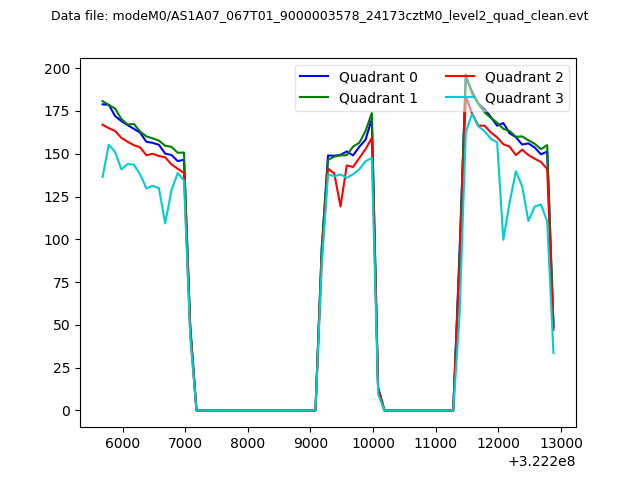 |
|
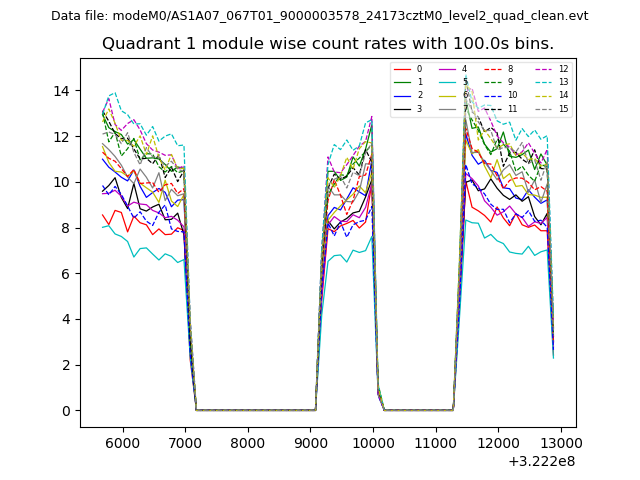
| Module-wise count rates for Quadrant A Data is divided into 100 sec bins |
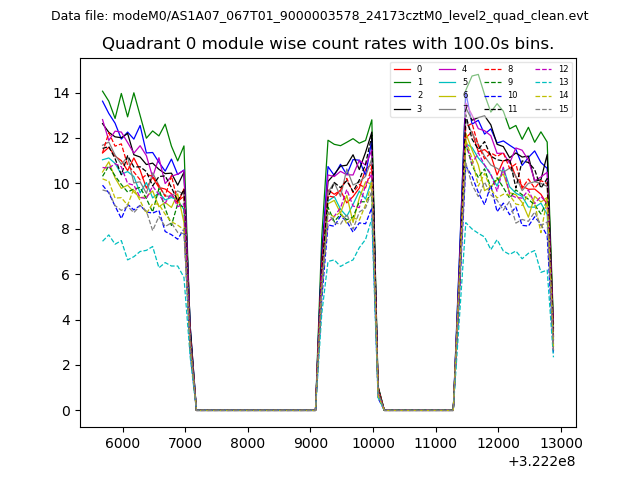 |
 |
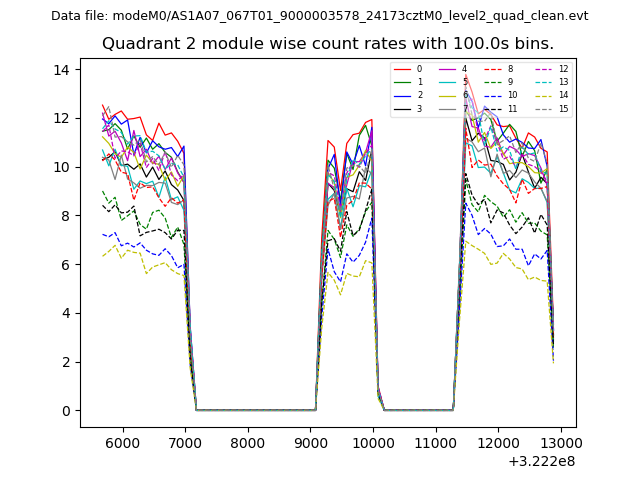
| Module-wise count rates for Quadrant B Data is divided into 100 sec bins |
 |
 |
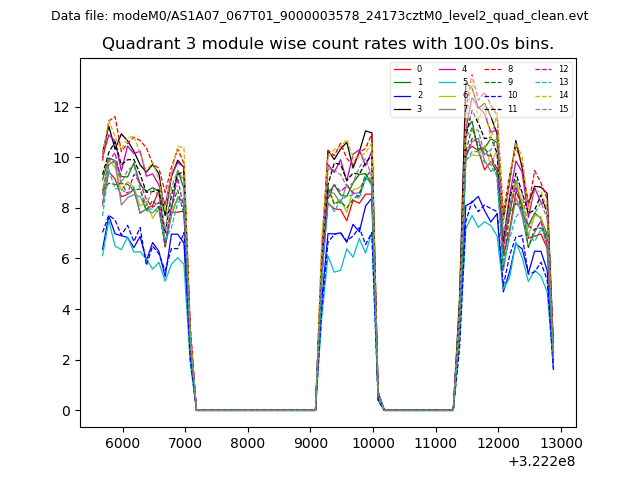
| Module-wise count rates for Quadrant C Data is divided into 100 sec bins |
 |
 |
| Module-wise count rates for Quadrant D Data is divided into 100 sec bins |
 |
 |
| Parameter | Plot |
|---|---|
| CZT HV Monitor | 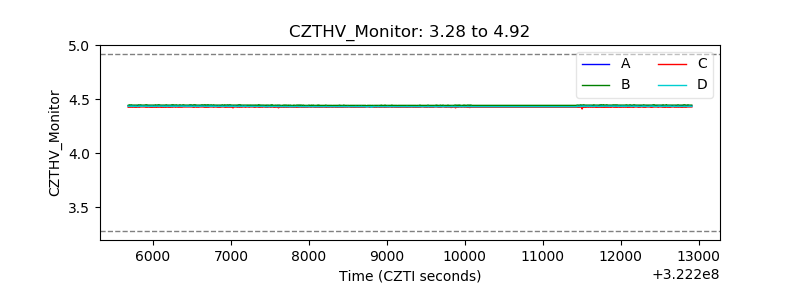 |
| D_VDD | 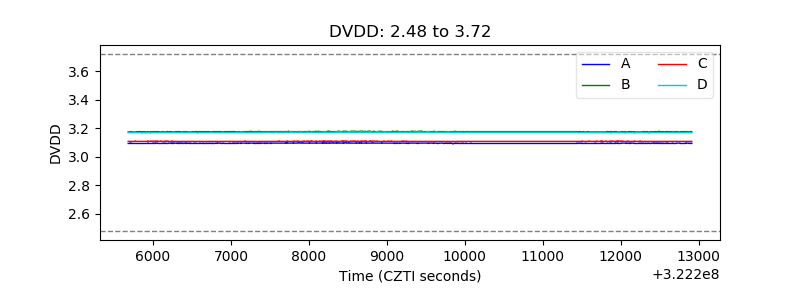 |
| Temperature 1 | 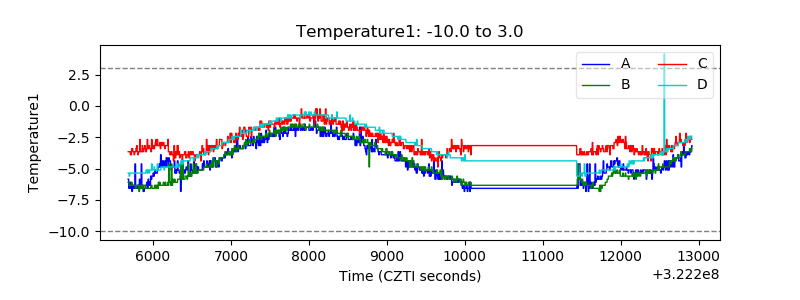 |
| Veto HV Monitor | 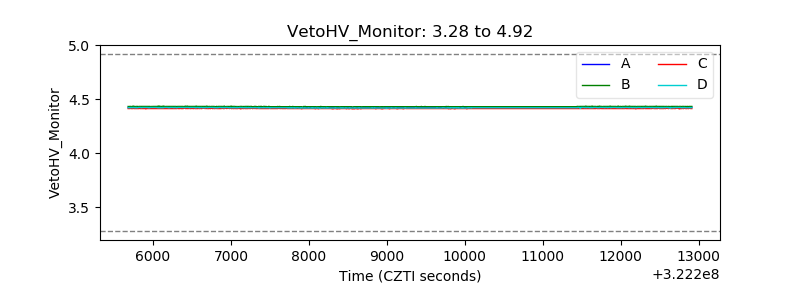 |
| Veto LLD | 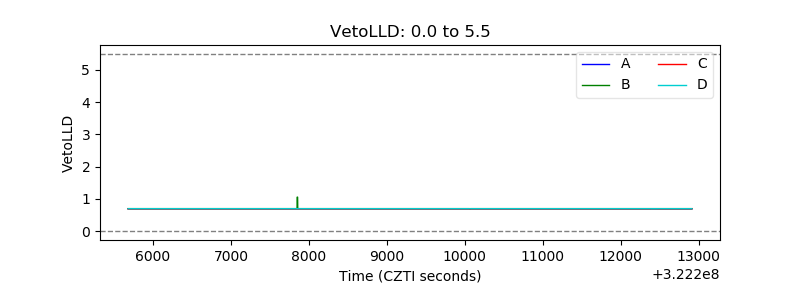 |
| Alpha Counter | 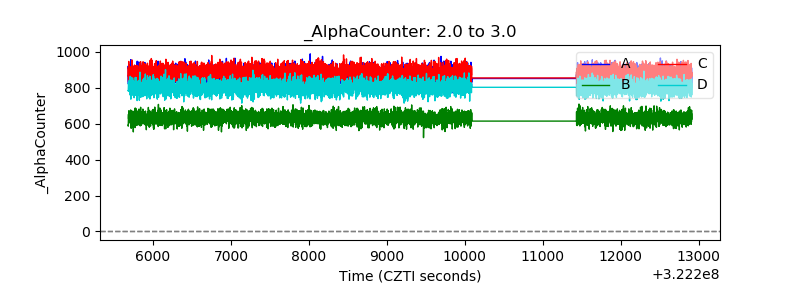 |
| _CPM_Rate | 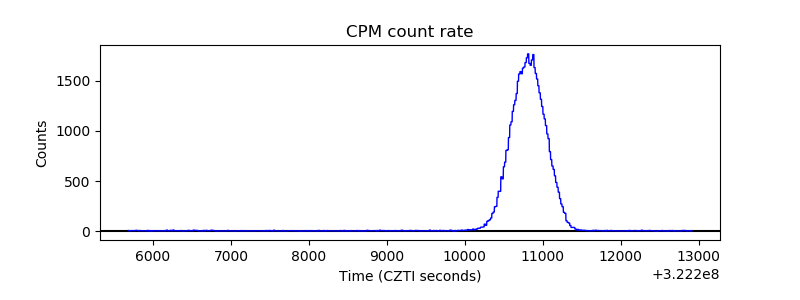 |
| CZT Counter |  |
| +2.5 Volts monitor |  |
| +5 Volts monitor |  |
| _ROLL_ROT | 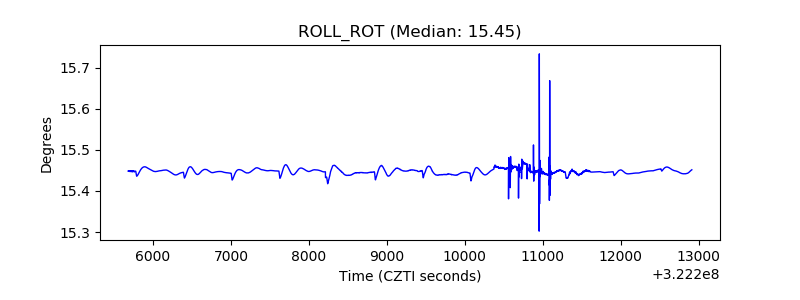 |
| _Roll_DEC | 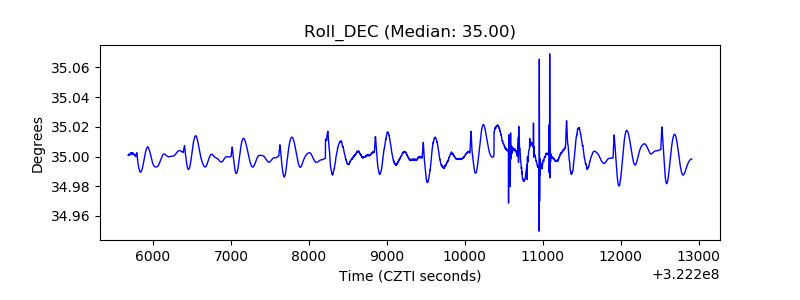 |
| _Roll_RA | 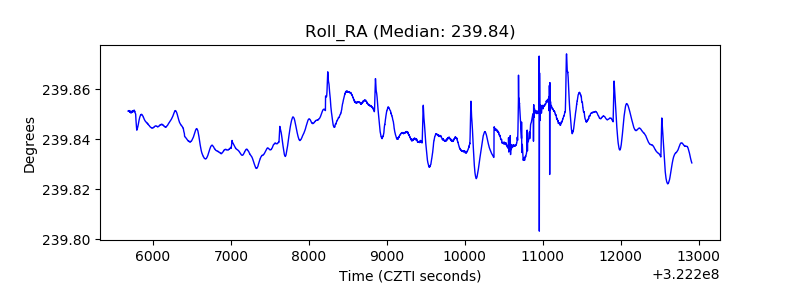 |
| Veto Counter | 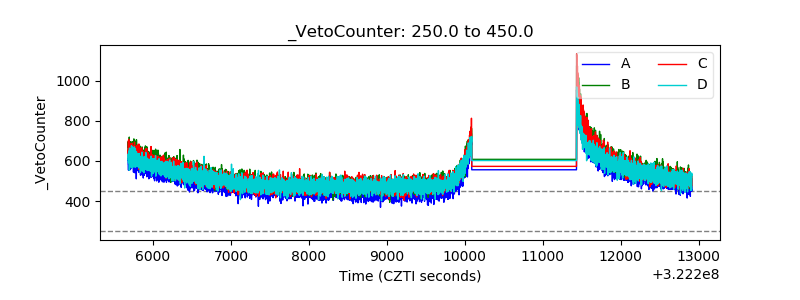 |