| Param | Original file | Final file |
|---|---|---|
| Filename | modeM0/AS1A07_067T01_9000003578_24174cztM0_level2.evt | modeM0/AS1A07_067T01_9000003578_24174cztM0_level2_quad_clean.evt |
| Size (bytes) | 701,176,320 | 76,325,760 |
| Size | 668.7 MB | 72.8 MB |
| Events in quadrant A | 2,989,832 | 523,128 |
| Events in quadrant B | 2,966,108 | 529,587 |
| Events in quadrant C | 3,371,407 | 496,490 |
| Events in quadrant D | 11,514,709 | 354,973 |
| Mode M9 | |||
|---|---|---|---|
| Quadrant | BADHDUFLAG | Total packets | Discarded packets |
| A | 0 | 13 | 0 |
| B | 0 | 13 | 0 |
| C | 0 | 13 | 0 |
| D | 0 | 13 | 0 |
| Mode SS | |||
|---|---|---|---|
| Quadrant | BADHDUFLAG | Total packets | Discarded packets |
| A | 0 | 116 | 0 |
| B | 0 | 116 | 0 |
| C | 0 | 116 | 0 |
| D | 0 | 116 | 0 |
| Mode M0 | |||
|---|---|---|---|
| Quadrant | BADHDUFLAG | Total packets | Discarded packets |
| A | 0 | 12059 | 1 |
| B | 0 | 12072 | 1 |
| C | 0 | 13402 | 1 |
| D | 0 | 38223 | 4 |
| Quadrant | Total seconds | Saturated seconds | Saturation percentage |
|---|---|---|---|
| A | 5816 | 75 | 1.289546% |
| B | 5817 | 85 | 1.461234% |
| C | 5817 | 210 | 3.610108% |
| D | 5816 | 3487 | 59.955296% |
Noise dominated data is calculated using 1-second bins in cleaned event files. If a bin has >2000 counts, and if more than 50% of those come from <1% of pixels, then it is considered to be noise-dominated and hence unusable.
| Quadrant | # 1 sec bins | Bins with >0 counts | Bins with >2000 counts | High rate bins dominated by noise | Noise dominated (total time) | Noise dominated (detector-on time) | Marked lightcurve |
|---|---|---|---|---|---|---|---|
| A | 7056 | 5817 | 0 | 0 | 0.00% | 0.00% | 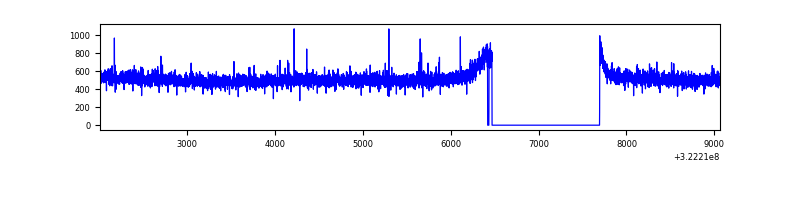 |
| B | 7057 | 5818 | 1 | 1 | 0.01% | 0.02% | 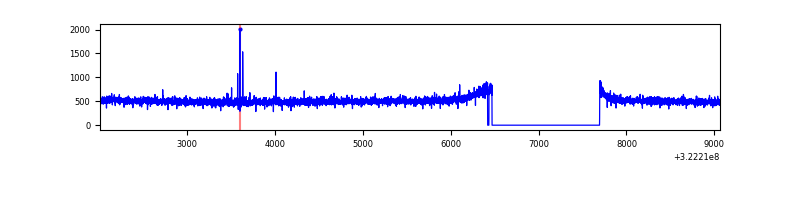 |
| C | 7057 | 5819 | 79 | 79 | 1.12% | 1.36% | 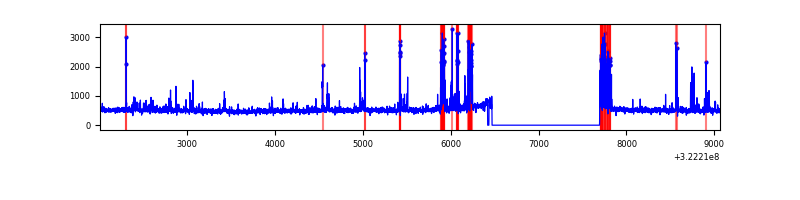 |
| D | 7056 | 5816 | 3353 | 3353 | 47.52% | 57.65% | 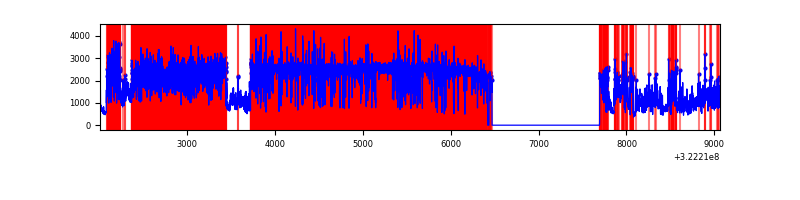 |
Top three noisy pixels from each quadrant. If the there are fewer than three noisy pixels in the level2.evt file, extra rows are filled as -1
| Pixel properties | Quadrant properties | ||||||
|---|---|---|---|---|---|---|---|
| Quadrant | DetID | PixID | Counts | Sigma | Mean | Median | Sigma |
| A | 13 | 254 | 9024 | 54.02 | 774 | 759 | 153.0 |
| A | 0 | 226 | 7036 | 41.02 | 774 | 759 | 153.0 |
| A | 3 | 137 | 6321 | 36.35 | 774 | 759 | 153.0 |
| B | 12 | 111 | 16769 | 112.34 | 757 | 741 | 142.7 |
| B | 11 | 111 | 14844 | 98.85 | 757 | 741 | 142.7 |
| B | 14 | 111 | 13102 | 86.64 | 757 | 741 | 142.7 |
| C | 0 | 239 | 350005 | 2128.04 | 719 | 724 | 164.1 |
| C | 14 | 238 | 115264 | 697.85 | 719 | 724 | 164.1 |
| C | 2 | 16 | 78374 | 473.09 | 719 | 724 | 164.1 |
| D | 7 | 238 | 8758901 | 69442.95 | 523 | 509 | 126.1 |
| D | 1 | 52 | 266776 | 2111.16 | 523 | 509 | 126.1 |
| D | 8 | 195 | 264266 | 2091.25 | 523 | 509 | 126.1 |
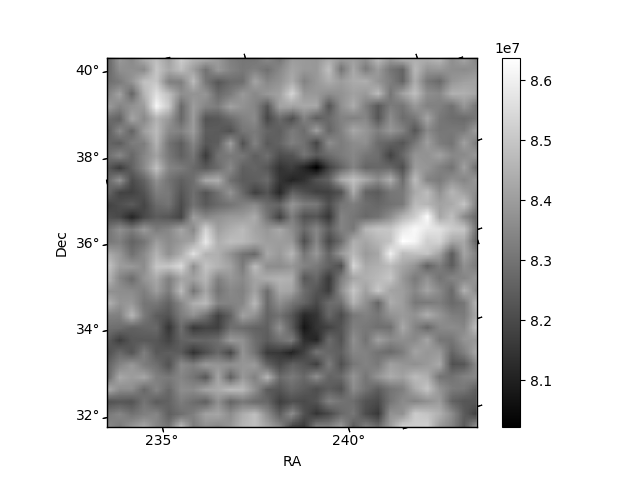
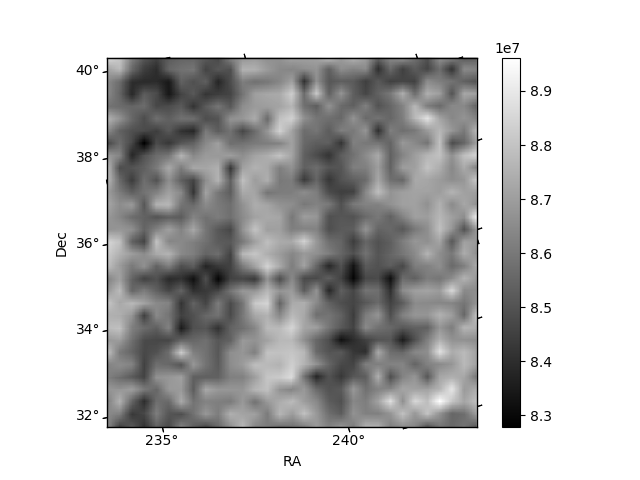
Histogram calculated using DETX and DETY for each event in the final _common_clean file
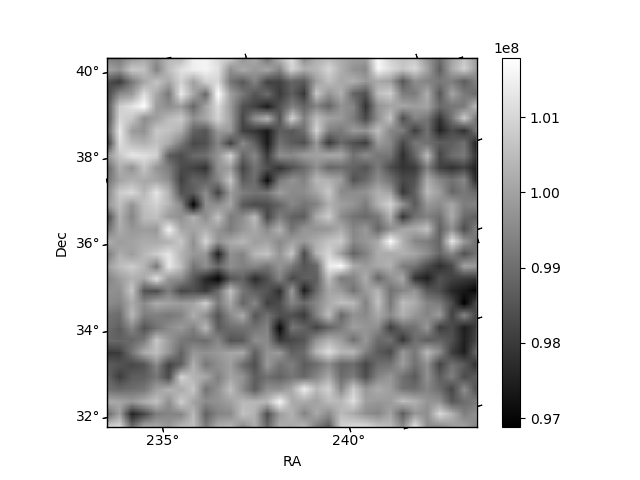
| Quadrant A | 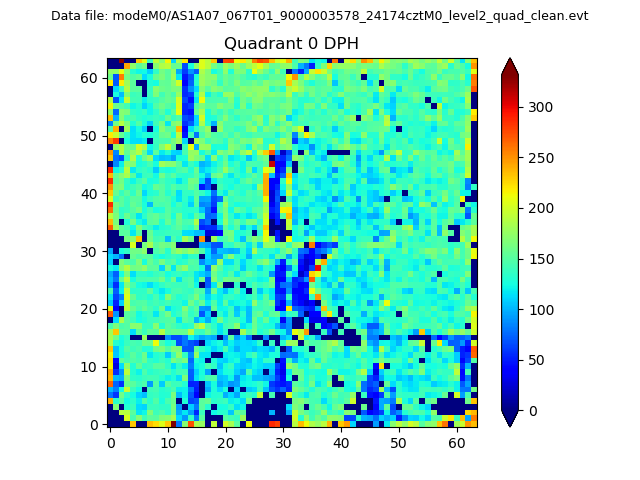 |
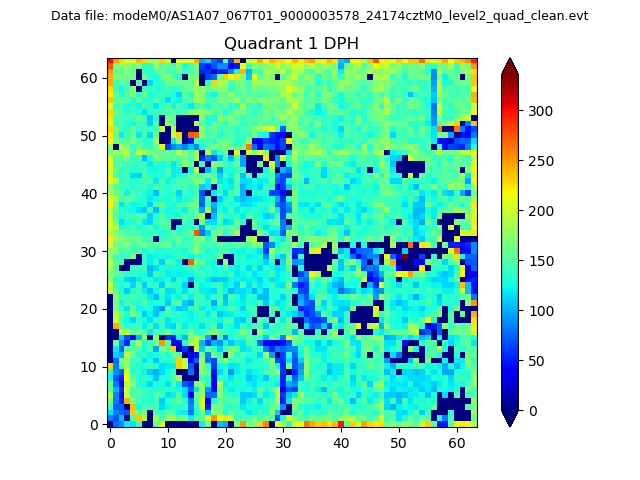 |
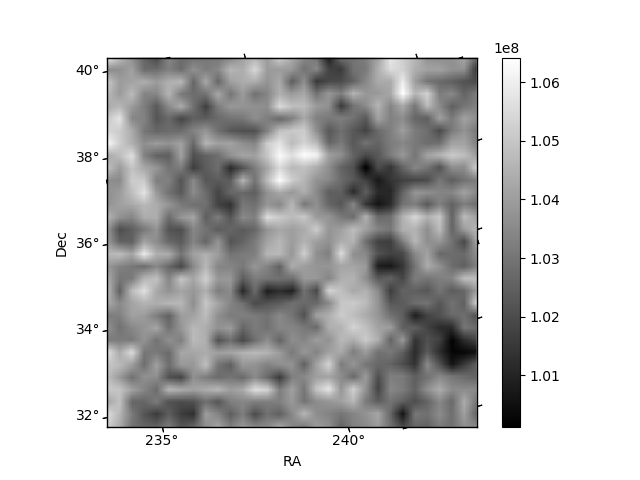
Quadrant B |
|---|---|---|---|
| Quadrant D | 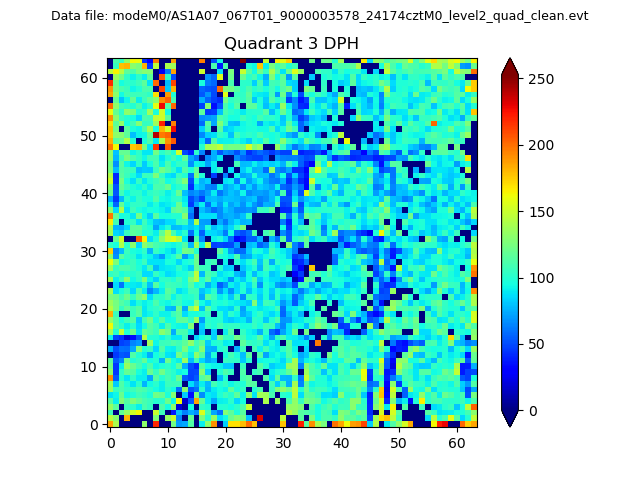 |
 |
Quadrant C |
| Plot type | Count rate plots | Images |
|---|---|---|
| Comparison with Poisson distribution Blue bars denote a histogram of data divided into 1 sec bins. Red curve is a Poisson curve with rate = median count rate of data. |
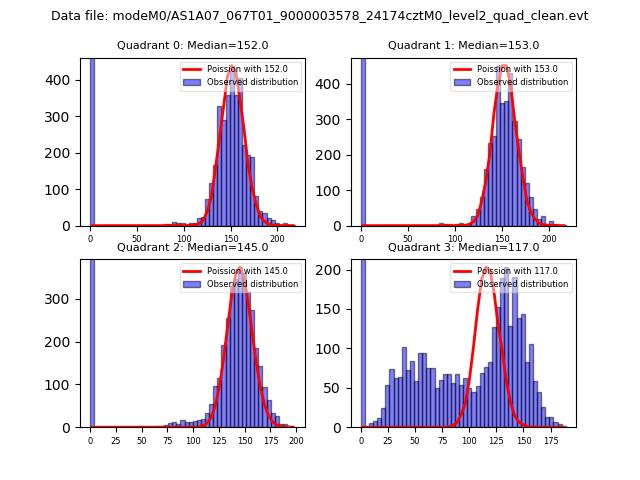 |
 |
| Quadrant-wise count rates Data is divided into 100 sec bins |
 |
|
| Module-wise count rates for Quadrant A Data is divided into 100 sec bins |
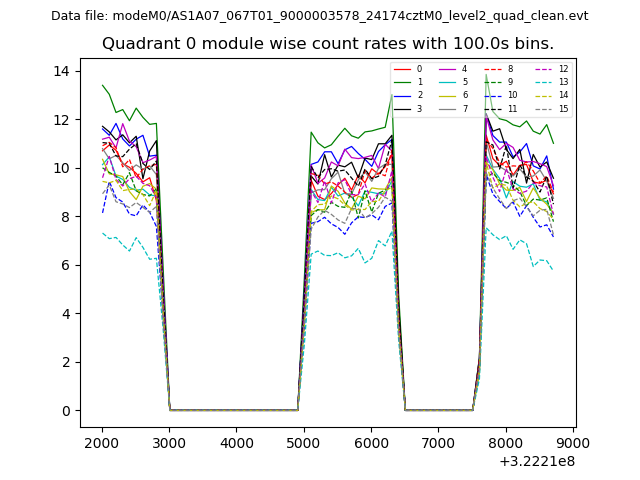 |
 |
| Module-wise count rates for Quadrant B Data is divided into 100 sec bins |
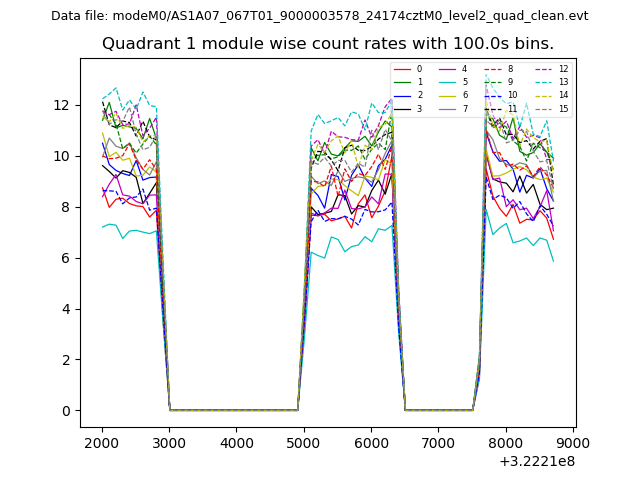 |
 |
| Module-wise count rates for Quadrant C Data is divided into 100 sec bins |
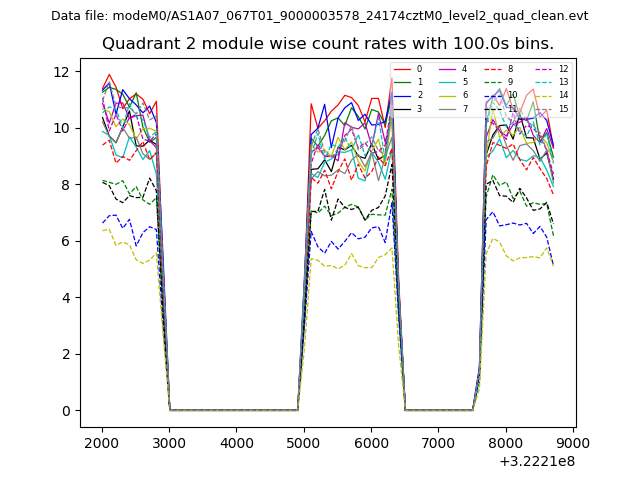 |
 |
| Module-wise count rates for Quadrant D Data is divided into 100 sec bins |
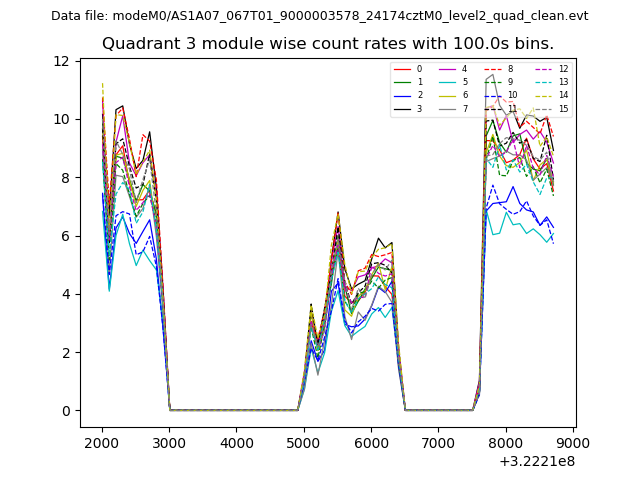 |
 |
| Parameter | Plot |
|---|---|
| CZT HV Monitor | 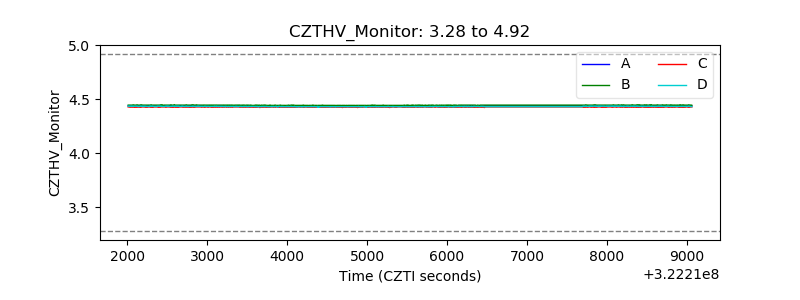 |
| D_VDD | 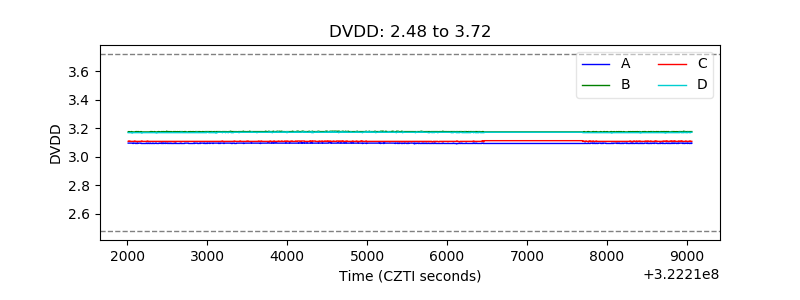 |
| Temperature 1 | 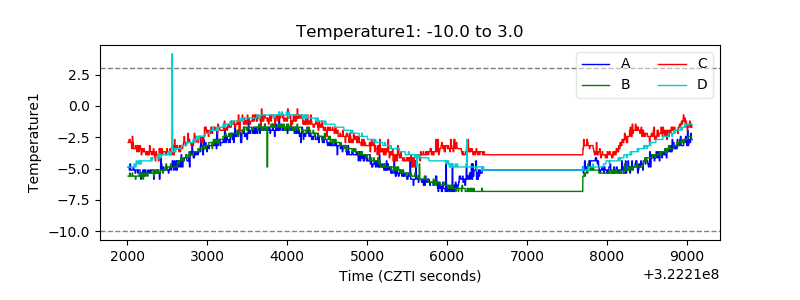 |
| Veto HV Monitor | 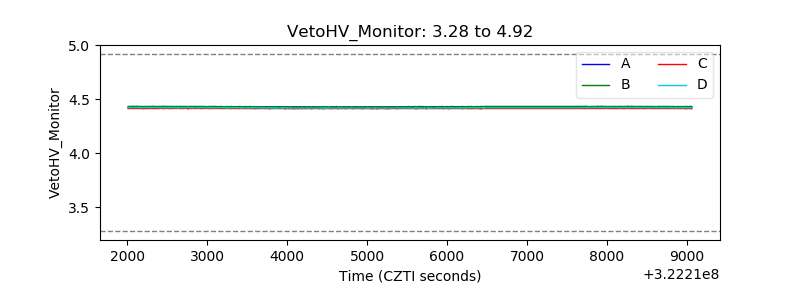 |
| Veto LLD | 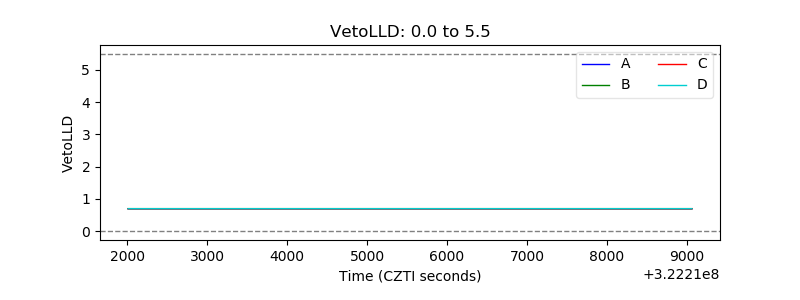 |
| Alpha Counter | 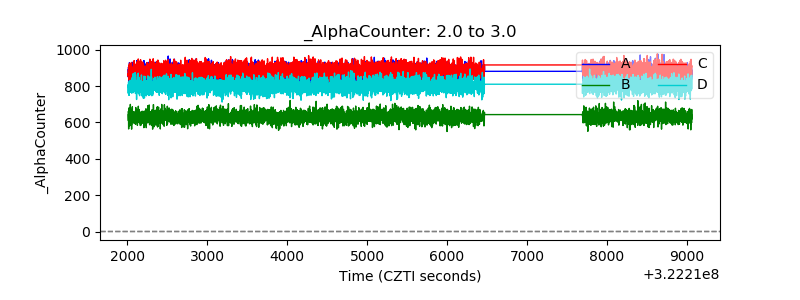 |
| _CPM_Rate | 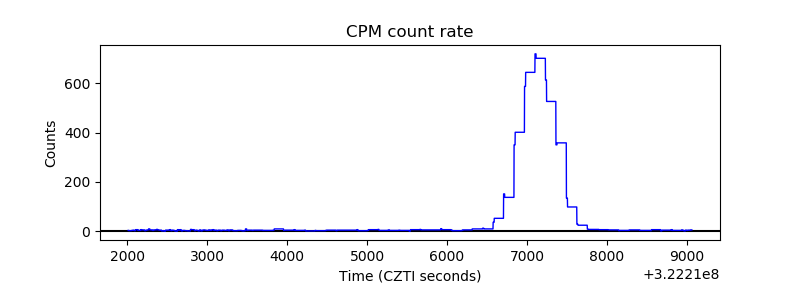 |
| CZT Counter | 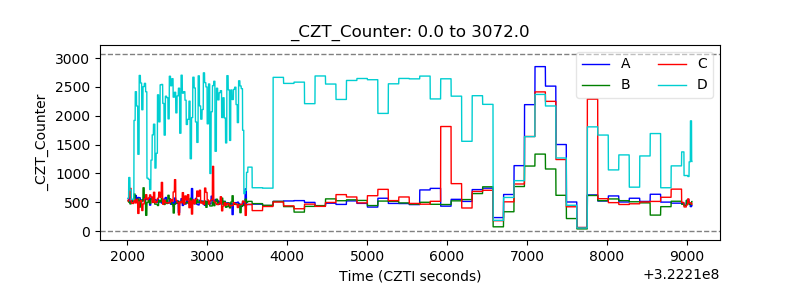 |
| +2.5 Volts monitor |  |
| +5 Volts monitor |  |
| _ROLL_ROT | 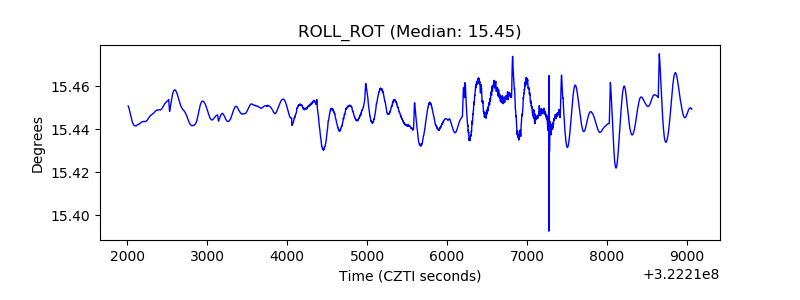 |
| _Roll_DEC | 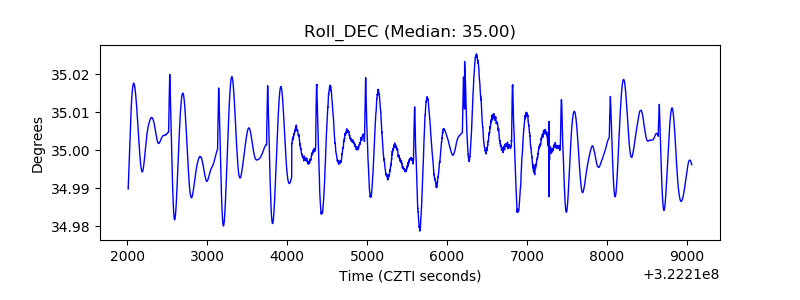 |
| _Roll_RA |  |
| Veto Counter | 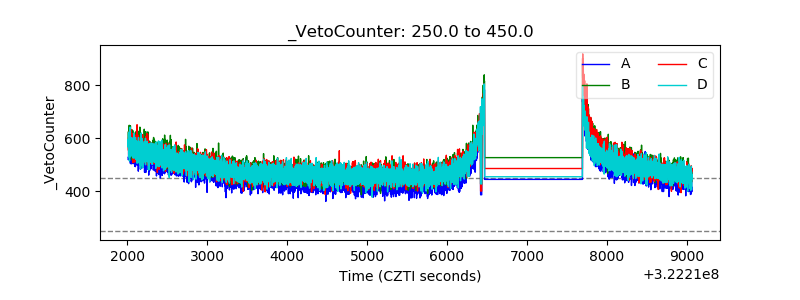 |