| Param | Original file | Final file |
|---|---|---|
| Filename | modeM0/AS1A07_067T01_9000003578_24175cztM0_level2.evt | modeM0/AS1A07_067T01_9000003578_24175cztM0_level2_quad_clean.evt |
| Size (bytes) | 782,948,160 | 73,814,400 |
| Size | 746.7 MB | 70.4 MB |
| Events in quadrant A | 3,198,104 | 484,474 |
| Events in quadrant B | 3,223,899 | 490,467 |
| Events in quadrant C | 3,610,918 | 465,988 |
| Events in quadrant D | 13,239,406 | 340,062 |
| Mode M9 | |||
|---|---|---|---|
| Quadrant | BADHDUFLAG | Total packets | Discarded packets |
| A | 0 | 10 | 0 |
| B | 0 | 10 | 0 |
| C | 0 | 10 | 0 |
| D | 0 | 10 | 0 |
| Mode SS | |||
|---|---|---|---|
| Quadrant | BADHDUFLAG | Total packets | Discarded packets |
| A | 0 | 132 | 0 |
| B | 0 | 132 | 0 |
| C | 0 | 132 | 0 |
| D | 0 | 132 | 0 |
| Mode M0 | |||
|---|---|---|---|
| Quadrant | BADHDUFLAG | Total packets | Discarded packets |
| A | 0 | 13313 | 1 |
| B | 0 | 13356 | 1 |
| C | 0 | 14565 | 1 |
| D | 0 | 43802 | 1 |
| Quadrant | Total seconds | Saturated seconds | Saturation percentage |
|---|---|---|---|
| A | 6496 | 91 | 1.400862% |
| B | 6496 | 108 | 1.662562% |
| C | 6495 | 212 | 3.264049% |
| D | 6496 | 3951 | 60.822044% |
Noise dominated data is calculated using 1-second bins in cleaned event files. If a bin has >2000 counts, and if more than 50% of those come from <1% of pixels, then it is considered to be noise-dominated and hence unusable.
| Quadrant | # 1 sec bins | Bins with >0 counts | Bins with >2000 counts | High rate bins dominated by noise | Noise dominated (total time) | Noise dominated (detector-on time) | Marked lightcurve |
|---|---|---|---|---|---|---|---|
| A | 7421 | 6496 | 0 | 0 | 0.00% | 0.00% |  |
| B | 7421 | 6497 | 1 | 1 | 0.01% | 0.02% |  |
| C | 7420 | 6495 | 67 | 67 | 0.90% | 1.03% | 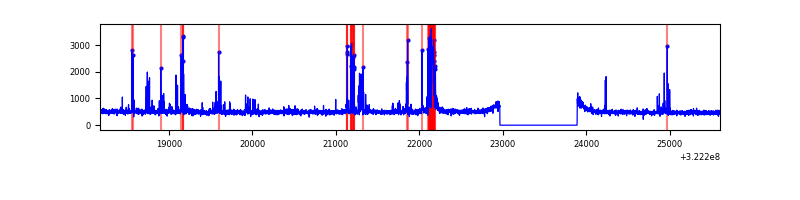 |
| D | 7420 | 6495 | 3614 | 3614 | 48.71% | 55.64% |  |
Top three noisy pixels from each quadrant. If the there are fewer than three noisy pixels in the level2.evt file, extra rows are filled as -1
| Pixel properties | Quadrant properties | ||||||
|---|---|---|---|---|---|---|---|
| Quadrant | DetID | PixID | Counts | Sigma | Mean | Median | Sigma |
| A | 13 | 254 | 10000 | 54.79 | 830 | 811 | 167.7 |
| A | 0 | 226 | 7264 | 38.47 | 830 | 811 | 167.7 |
| A | 3 | 137 | 7122 | 37.63 | 830 | 811 | 167.7 |
| B | 12 | 111 | 18365 | 112.78 | 817 | 796 | 155.8 |
| B | 11 | 111 | 16333 | 99.73 | 817 | 796 | 155.8 |
| B | 14 | 111 | 14290 | 86.62 | 817 | 796 | 155.8 |
| C | 0 | 239 | 423949 | 2341.94 | 780 | 786 | 180.7 |
| C | 14 | 238 | 124138 | 682.68 | 780 | 786 | 180.7 |
| C | 2 | 16 | 14418 | 75.44 | 780 | 786 | 180.7 |
| D | 7 | 238 | 8174251 | 55487.98 | 602 | 585 | 147.3 |
| D | 1 | 52 | 1648932 | 11190.02 | 602 | 585 | 147.3 |
| D | 12 | 218 | 582658 | 3951.48 | 602 | 585 | 147.3 |
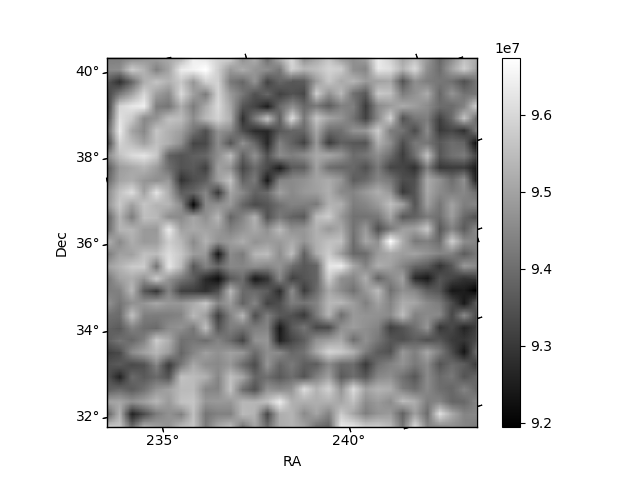
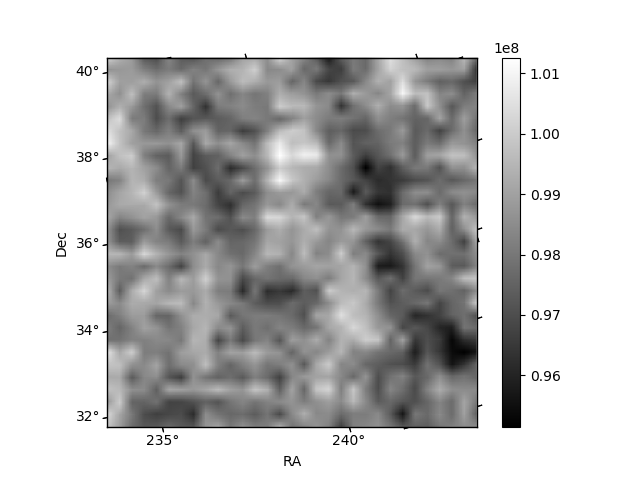
Histogram calculated using DETX and DETY for each event in the final _common_clean file
| Quadrant A | 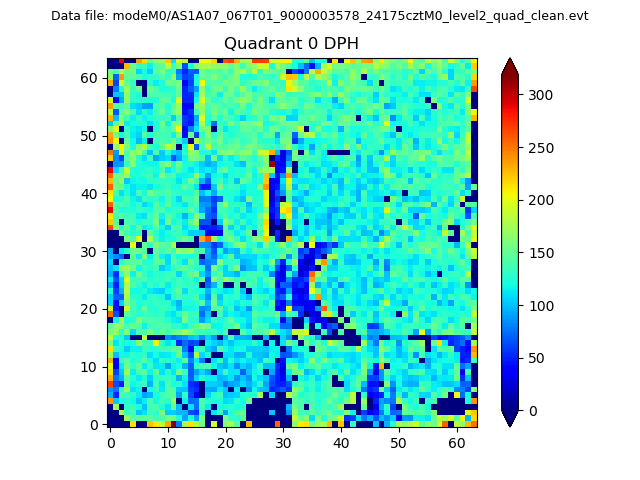 |
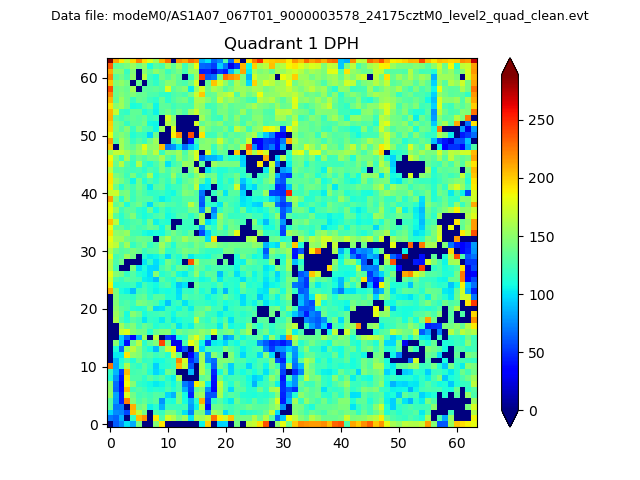 |
Quadrant B |
|---|---|---|---|
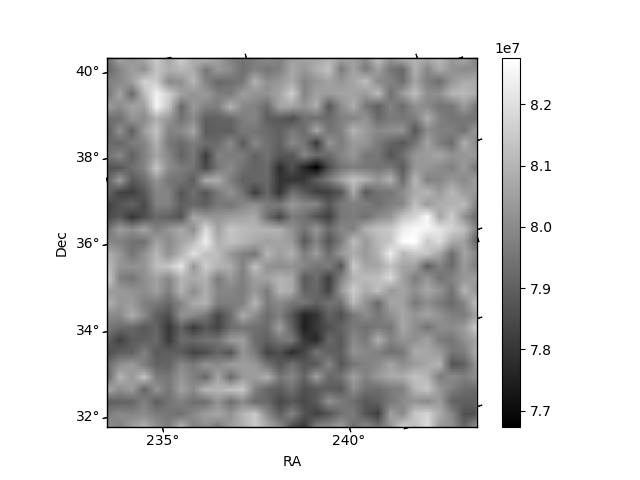
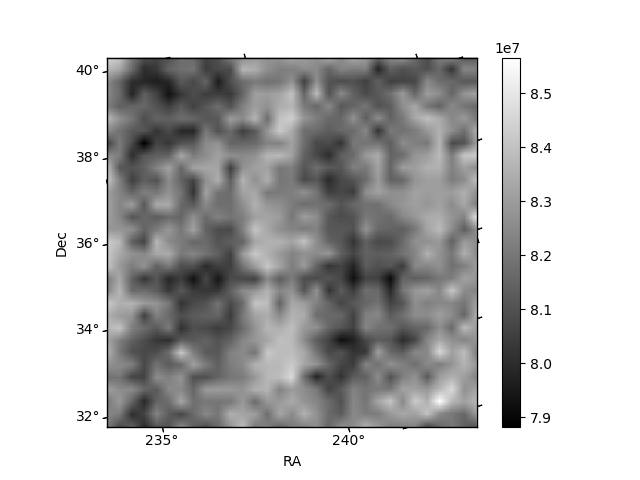
| Quadrant D | 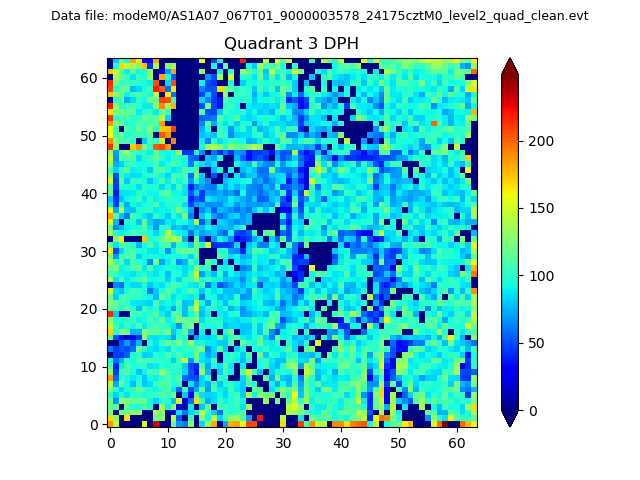 |
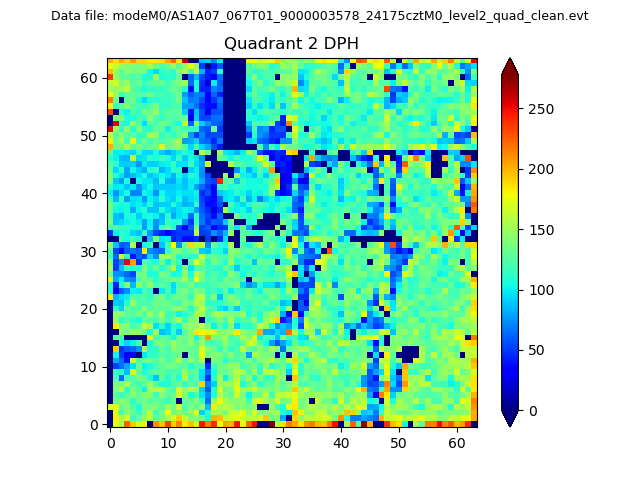 |
Quadrant C |
| Plot type | Count rate plots | Images |
|---|---|---|
| Comparison with Poisson distribution Blue bars denote a histogram of data divided into 1 sec bins. Red curve is a Poisson curve with rate = median count rate of data. |
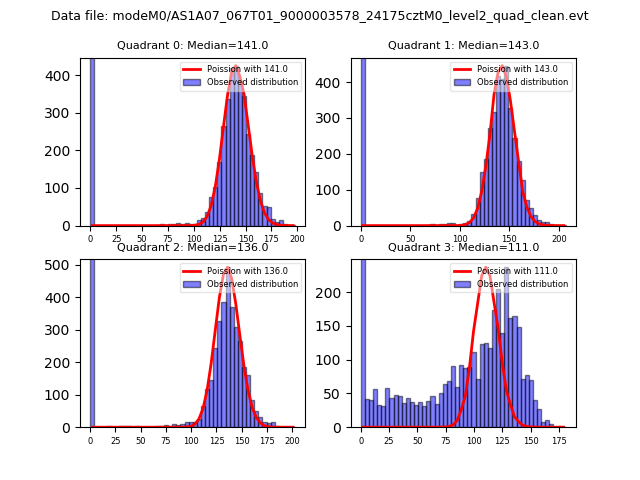 |
 |
| Quadrant-wise count rates Data is divided into 100 sec bins |
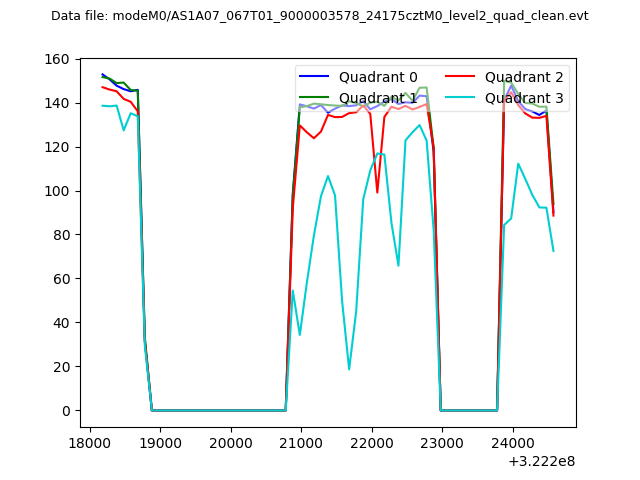 |
|
| Module-wise count rates for Quadrant A Data is divided into 100 sec bins |
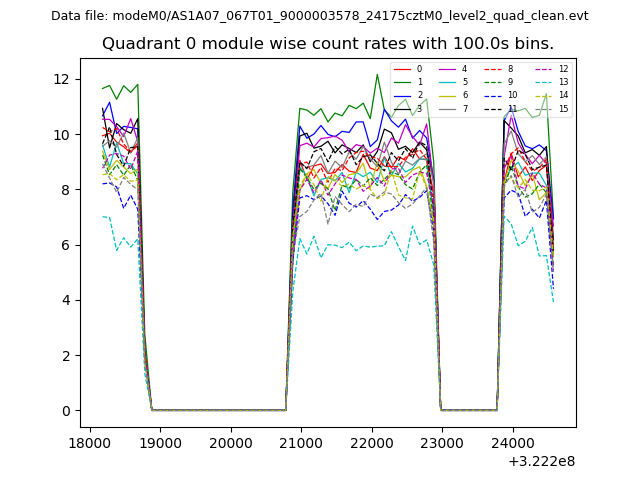 |
 |
| Module-wise count rates for Quadrant B Data is divided into 100 sec bins |
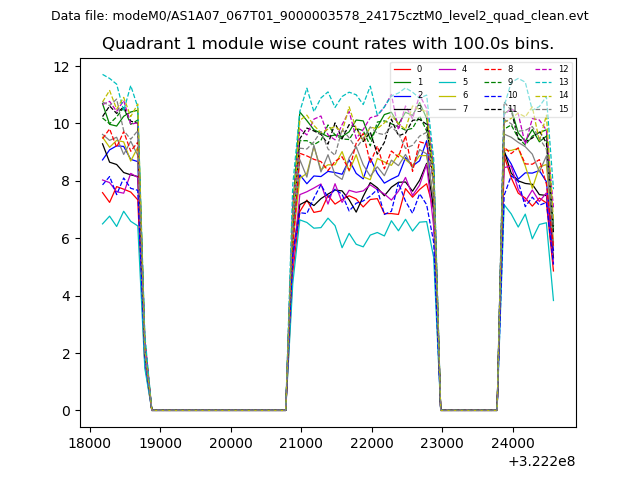 |
 |
| Module-wise count rates for Quadrant C Data is divided into 100 sec bins |
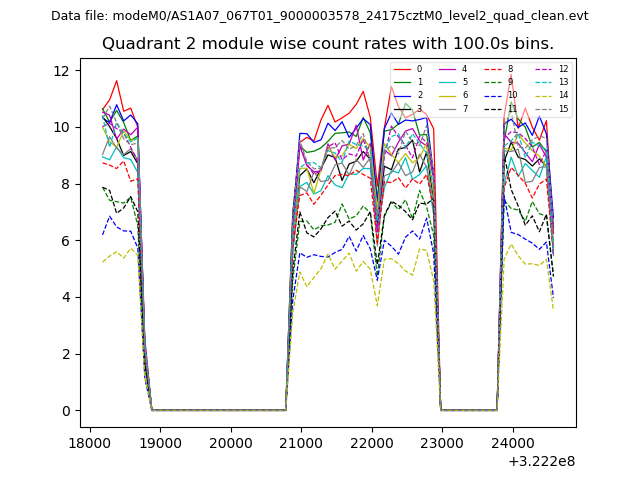 |
 |
| Module-wise count rates for Quadrant D Data is divided into 100 sec bins |
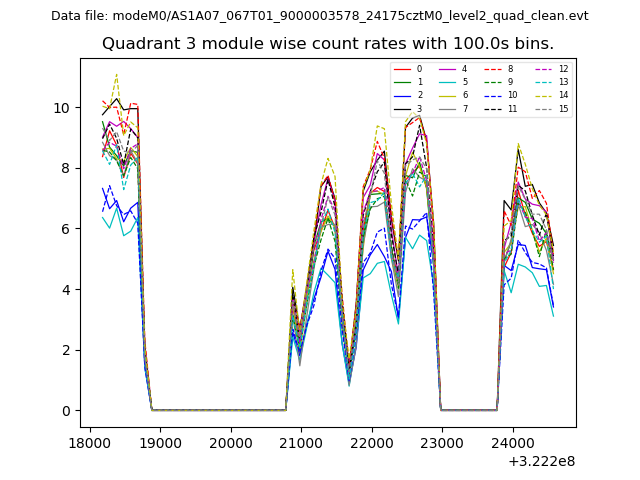 |
 |
| Parameter | Plot |
|---|---|
| CZT HV Monitor | 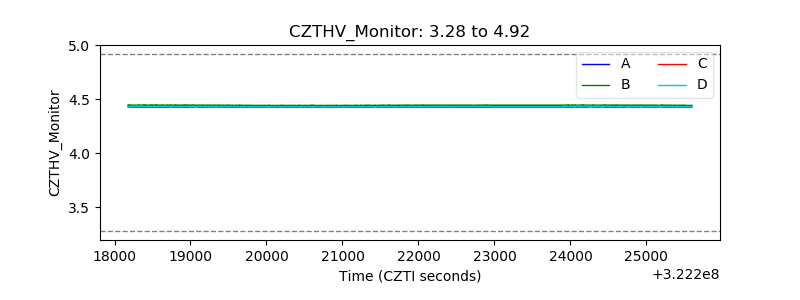 |
| D_VDD | 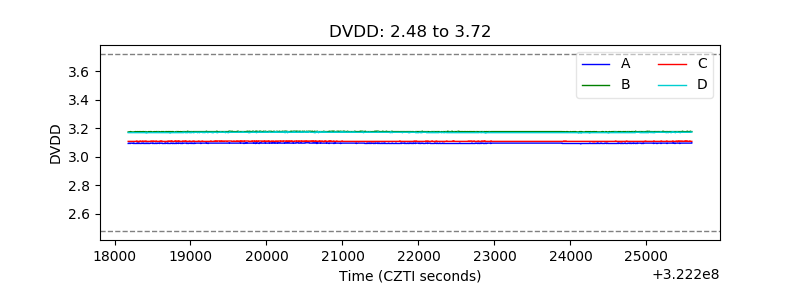 |
| Temperature 1 | 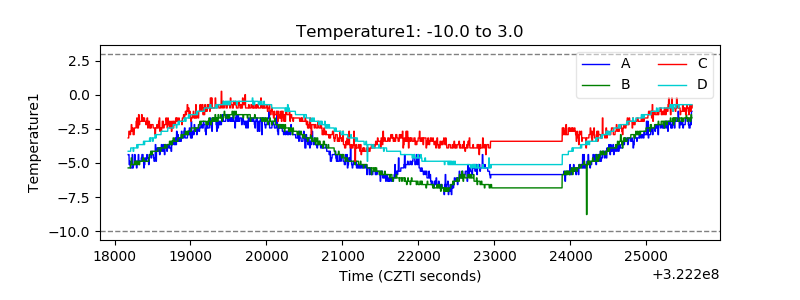 |
| Veto HV Monitor | 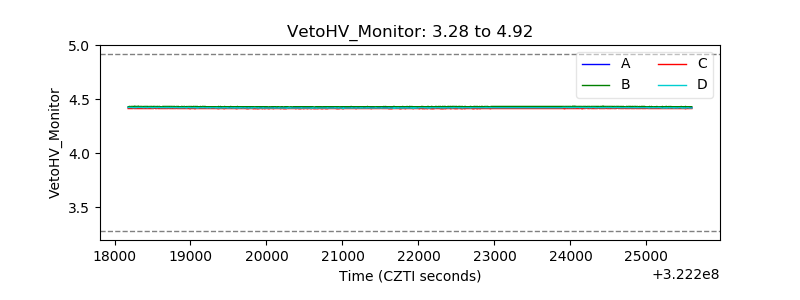 |
| Veto LLD | 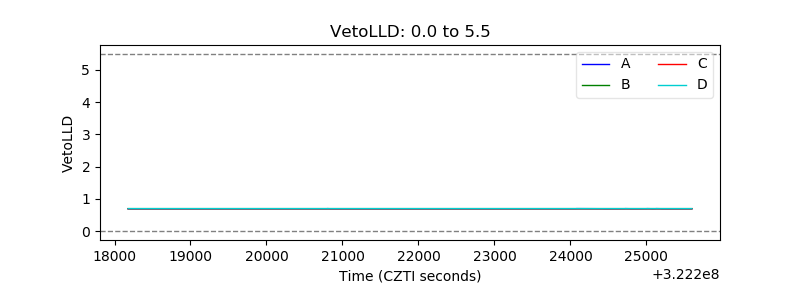 |
| Alpha Counter | 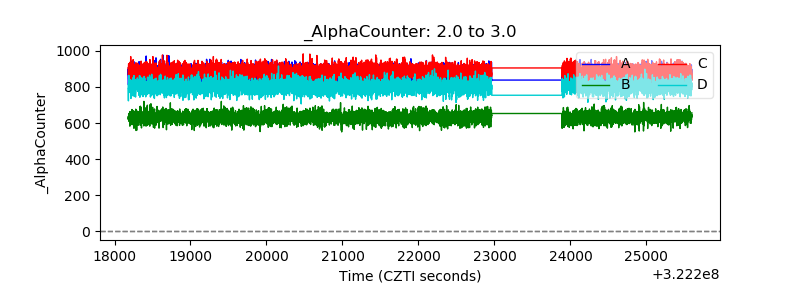 |
| _CPM_Rate | 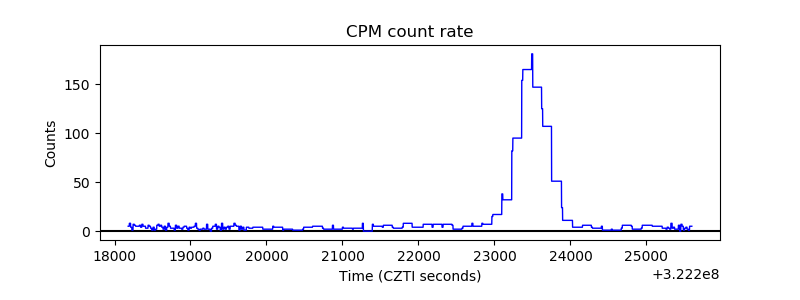 |
| CZT Counter | 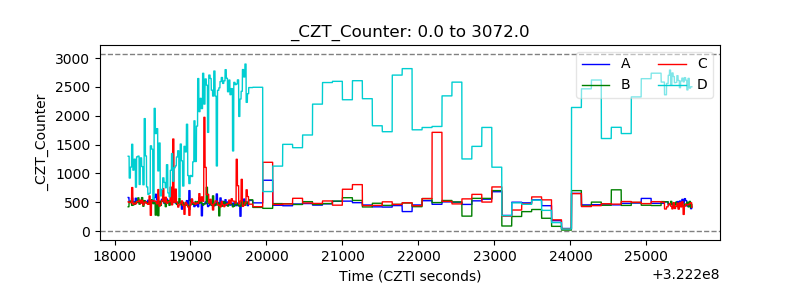 |
| +2.5 Volts monitor |  |
| +5 Volts monitor |  |
| _ROLL_ROT | 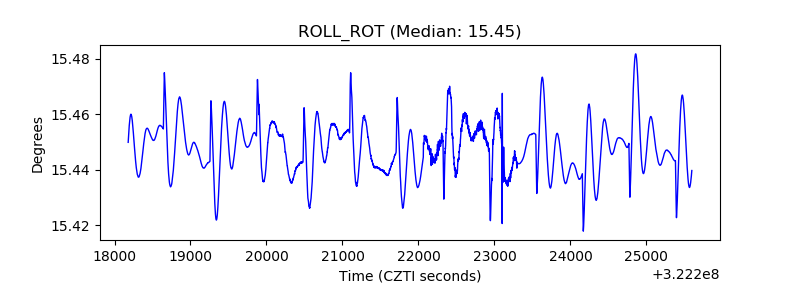 |
| _Roll_DEC | 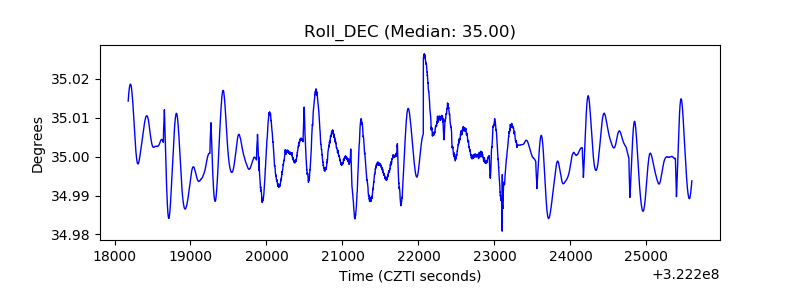 |
| _Roll_RA | 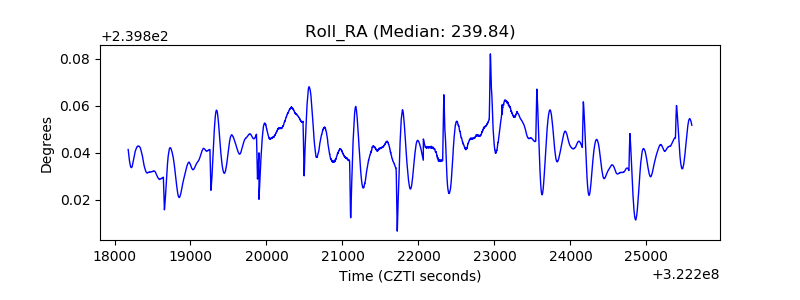 |
| Veto Counter | 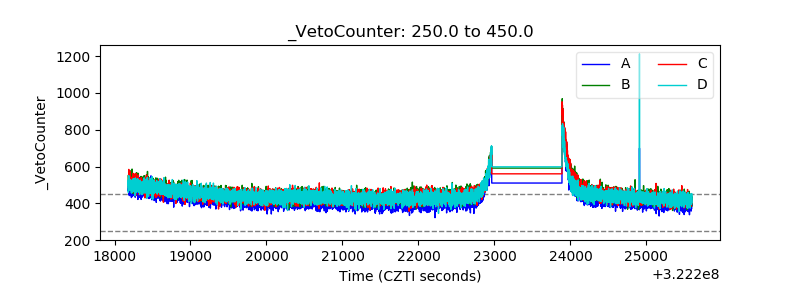 |