| Param | Original file | Final file |
|---|---|---|
| Filename | modeM0/AS1A07_067T01_9000003578_24176cztM0_level2.evt | modeM0/AS1A07_067T01_9000003578_24176cztM0_level2_quad_clean.evt |
| Size (bytes) | 809,256,960 | 72,457,920 |
| Size | 771.8 MB | 69.1 MB |
| Events in quadrant A | 3,313,421 | 458,407 |
| Events in quadrant B | 3,326,452 | 466,908 |
| Events in quadrant C | 3,609,761 | 446,229 |
| Events in quadrant D | 13,794,026 | 343,004 |
| Mode M9 | |||
|---|---|---|---|
| Quadrant | BADHDUFLAG | Total packets | Discarded packets |
| A | 0 | 5 | 0 |
| B | 0 | 5 | 0 |
| C | 0 | 5 | 0 |
| D | 0 | 5 | 0 |
| Mode SS | |||
|---|---|---|---|
| Quadrant | BADHDUFLAG | Total packets | Discarded packets |
| A | 0 | 140 | 0 |
| B | 0 | 140 | 0 |
| C | 0 | 140 | 0 |
| D | 0 | 140 | 0 |
| Mode M0 | |||
|---|---|---|---|
| Quadrant | BADHDUFLAG | Total packets | Discarded packets |
| A | 0 | 14117 | 1 |
| B | 0 | 14115 | 1 |
| C | 0 | 15001 | 1 |
| D | 0 | 45755 | 1 |
| Quadrant | Total seconds | Saturated seconds | Saturation percentage |
|---|---|---|---|
| A | 6865 | 105 | 1.529497% |
| B | 6866 | 124 | 1.806001% |
| C | 6866 | 197 | 2.869211% |
| D | 6866 | 4410 | 64.229537% |
Noise dominated data is calculated using 1-second bins in cleaned event files. If a bin has >2000 counts, and if more than 50% of those come from <1% of pixels, then it is considered to be noise-dominated and hence unusable.
| Quadrant | # 1 sec bins | Bins with >0 counts | Bins with >2000 counts | High rate bins dominated by noise | Noise dominated (total time) | Noise dominated (detector-on time) | Marked lightcurve |
|---|---|---|---|---|---|---|---|
| A | 7360 | 6865 | 0 | 0 | 0.00% | 0.00% | 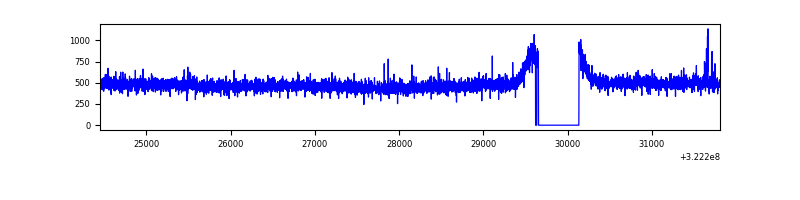 |
| B | 7361 | 6867 | 0 | 0 | 0.00% | 0.00% | 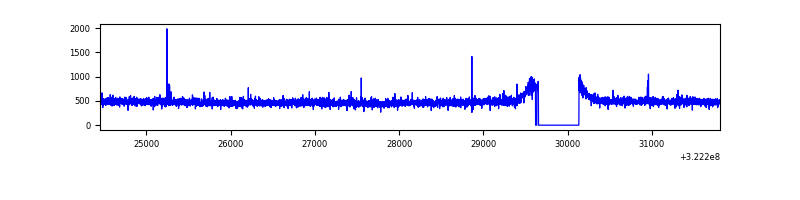 |
| C | 7361 | 6866 | 13 | 13 | 0.18% | 0.19% | 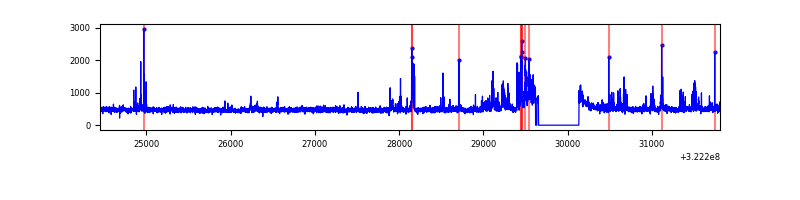 |
| D | 7361 | 6866 | 4003 | 4003 | 54.38% | 58.30% | 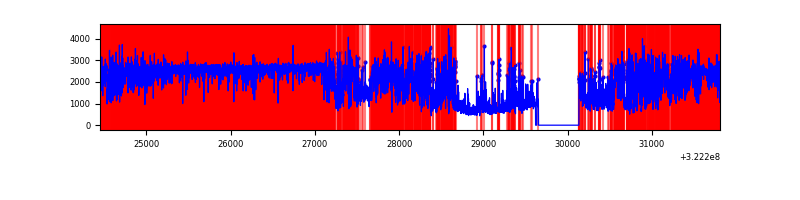 |
Top three noisy pixels from each quadrant. If the there are fewer than three noisy pixels in the level2.evt file, extra rows are filled as -1
| Pixel properties | Quadrant properties | ||||||
|---|---|---|---|---|---|---|---|
| Quadrant | DetID | PixID | Counts | Sigma | Mean | Median | Sigma |
| A | 13 | 170 | 18183 | 100.34 | 855 | 835 | 172.9 |
| A | 13 | 254 | 10534 | 56.09 | 855 | 835 | 172.9 |
| A | 3 | 137 | 7538 | 38.77 | 855 | 835 | 172.9 |
| B | 12 | 111 | 19519 | 114.36 | 847 | 824 | 163.5 |
| B | 11 | 111 | 17681 | 103.12 | 847 | 824 | 163.5 |
| B | 14 | 111 | 15475 | 89.62 | 847 | 824 | 163.5 |
| C | 0 | 239 | 155676 | 822.91 | 810 | 814 | 188.2 |
| C | 2 | 16 | 151917 | 802.93 | 810 | 814 | 188.2 |
| C | 14 | 238 | 128865 | 680.44 | 810 | 814 | 188.2 |
| D | 7 | 238 | 8336796 | 59622.6 | 572 | 555 | 139.8 |
| D | 12 | 218 | 2753462 | 19689.39 | 572 | 555 | 139.8 |
| D | 8 | 195 | 315666 | 2253.74 | 572 | 555 | 139.8 |
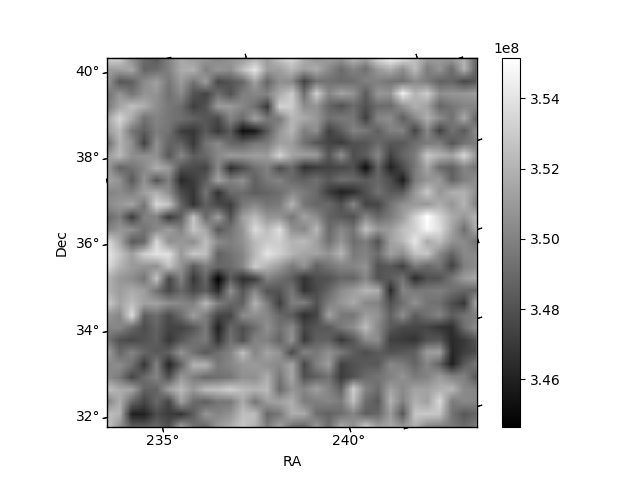
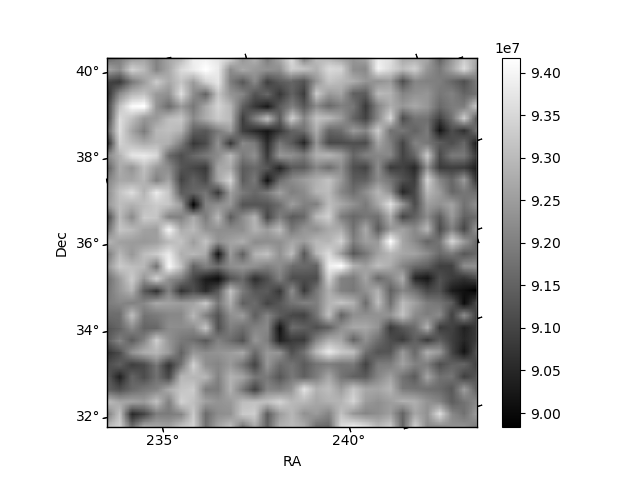
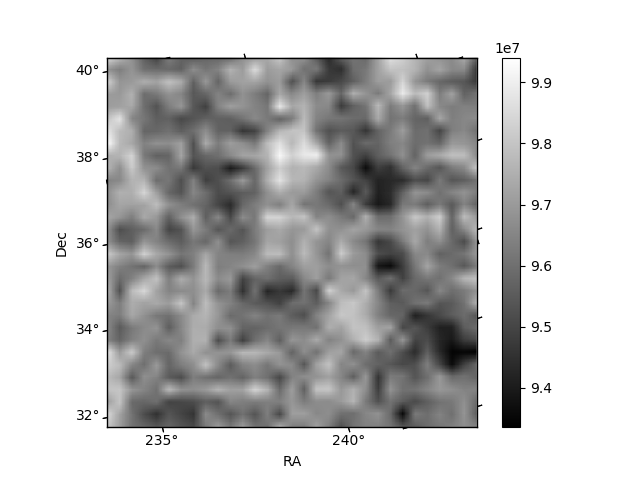
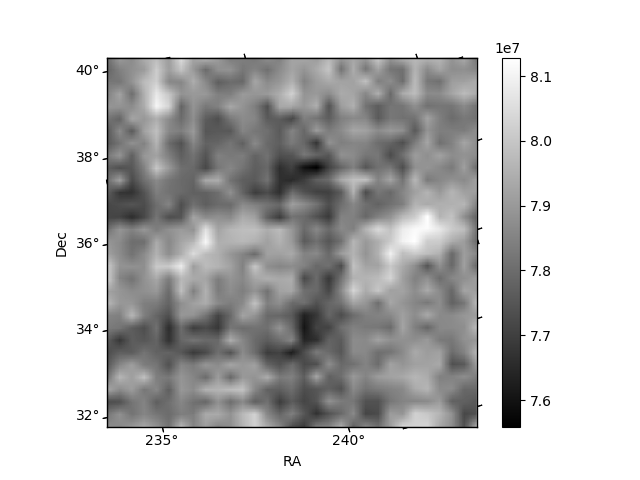
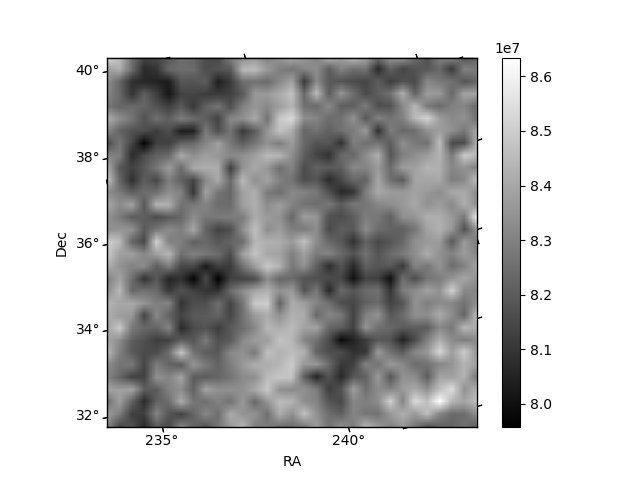
Histogram calculated using DETX and DETY for each event in the final _common_clean file
| Quadrant A | 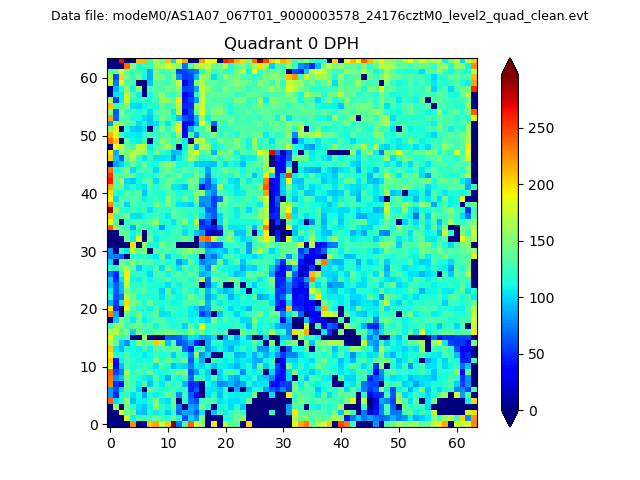 |
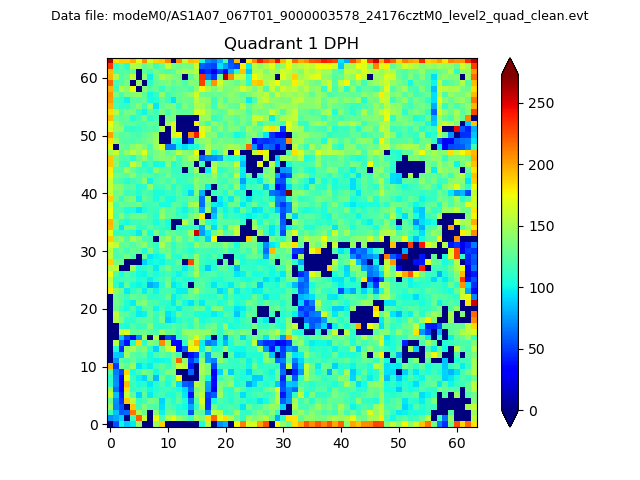 |
Quadrant B |
|---|---|---|---|
| Quadrant D | 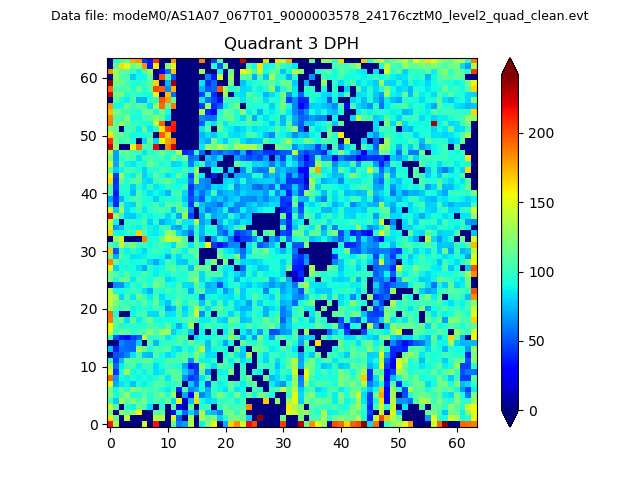 |
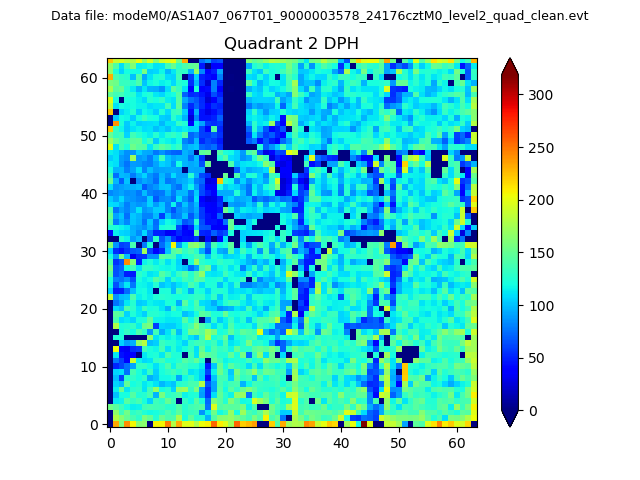 |
Quadrant C |
| Plot type | Count rate plots | Images |
|---|---|---|
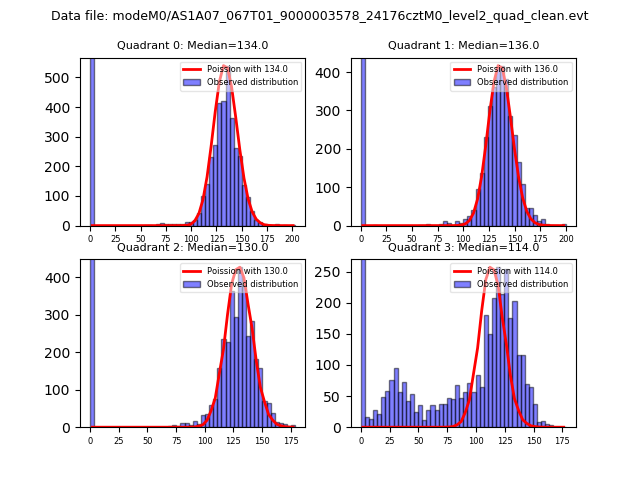
| Comparison with Poisson distribution Blue bars denote a histogram of data divided into 1 sec bins. Red curve is a Poisson curve with rate = median count rate of data. |
 |
 |
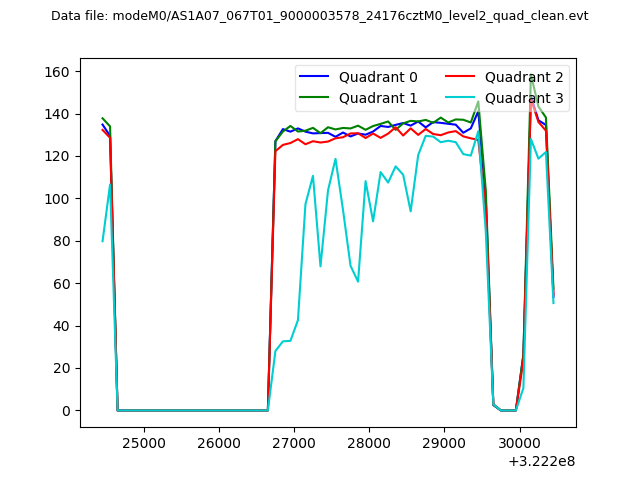
| Quadrant-wise count rates Data is divided into 100 sec bins |
 |
|
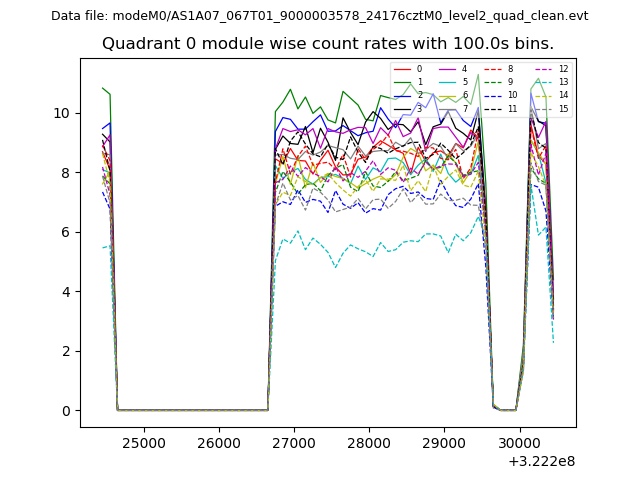
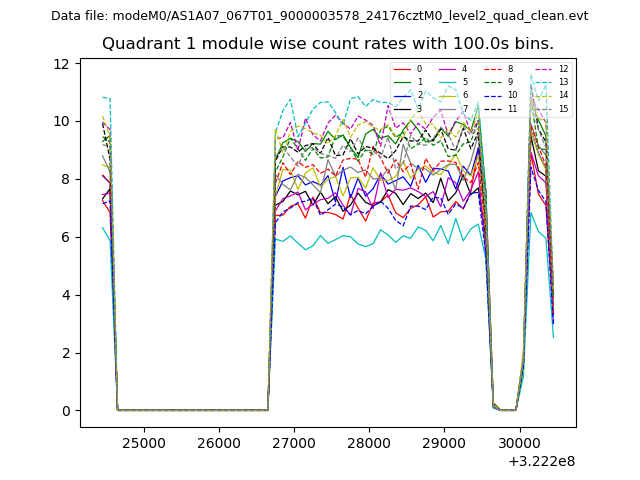
| Module-wise count rates for Quadrant A Data is divided into 100 sec bins |
 |
 |
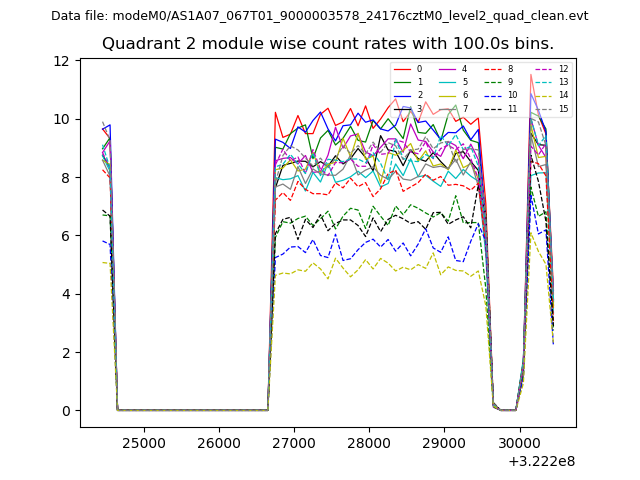
| Module-wise count rates for Quadrant B Data is divided into 100 sec bins |
 |
 |
| Module-wise count rates for Quadrant C Data is divided into 100 sec bins |
 |
 |
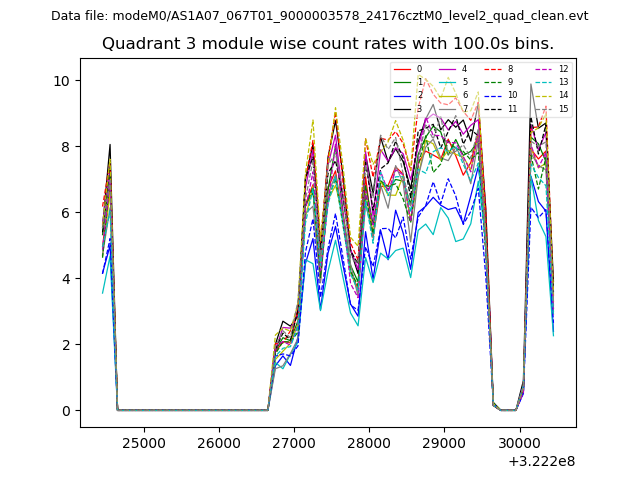
| Module-wise count rates for Quadrant D Data is divided into 100 sec bins |
 |
 |
| Parameter | Plot |
|---|---|
| CZT HV Monitor | 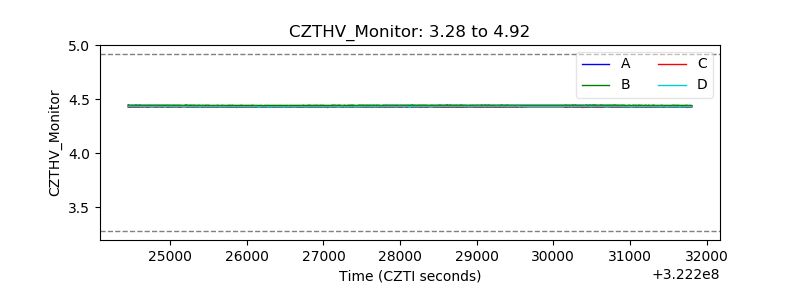 |
| D_VDD | 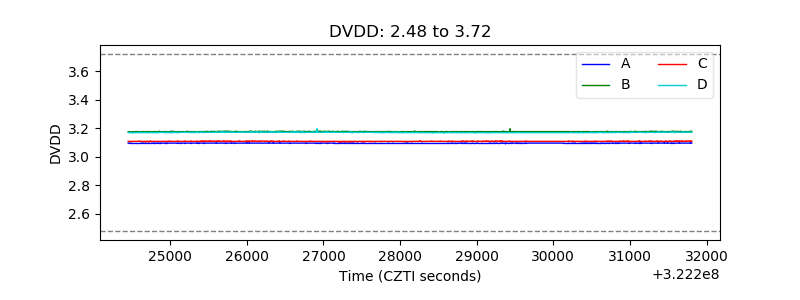 |
| Temperature 1 | 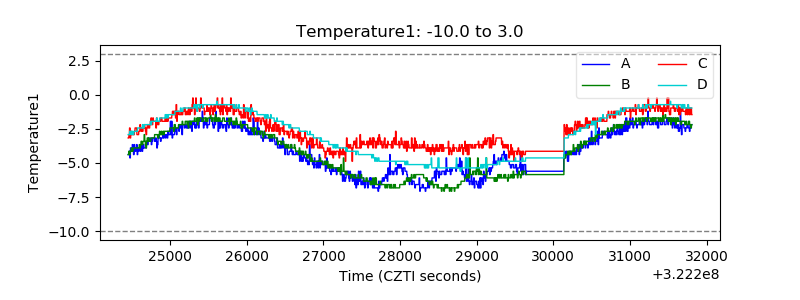 |
| Veto HV Monitor | 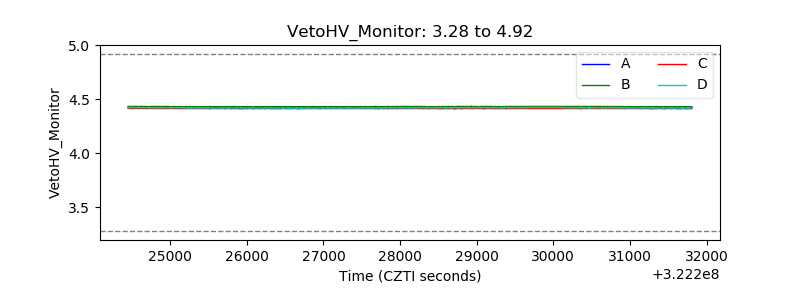 |
| Veto LLD | 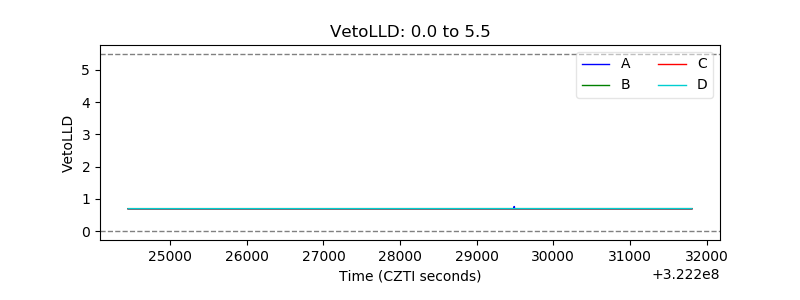 |
| Alpha Counter | 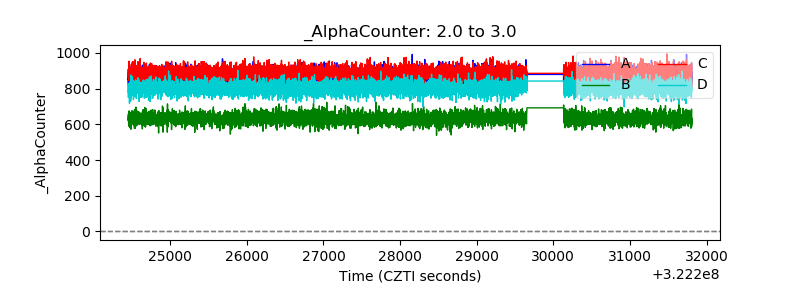 |
| _CPM_Rate | 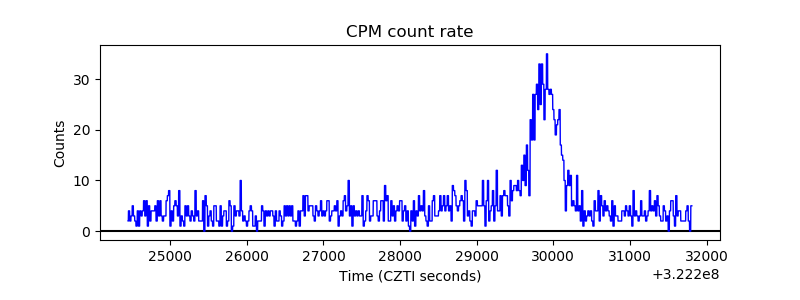 |
| CZT Counter | 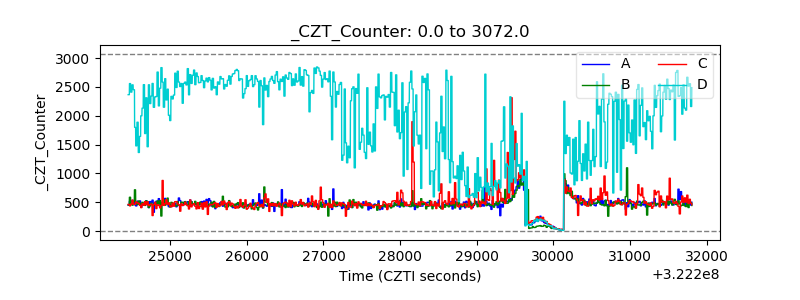 |
| +2.5 Volts monitor |  |
| +5 Volts monitor |  |
| _ROLL_ROT | 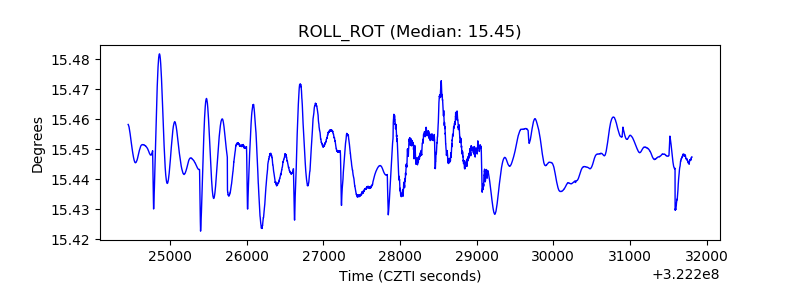 |
| _Roll_DEC |  |
| _Roll_RA | 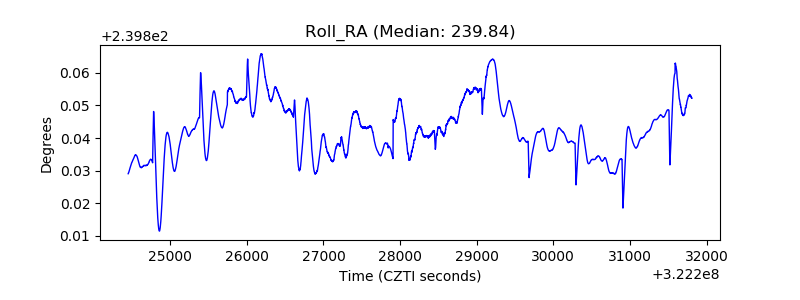 |
| Veto Counter | 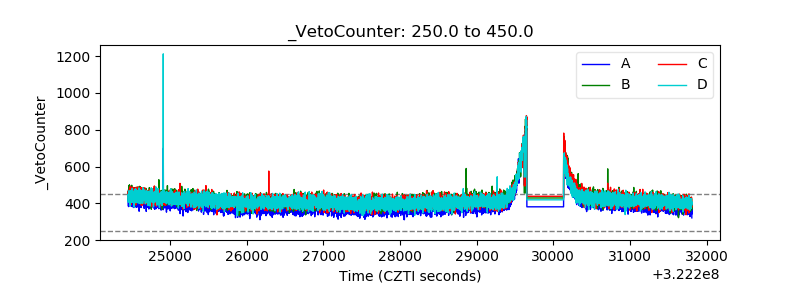 |