| Param | Original file | Final file |
|---|---|---|
| Filename | modeM0/AS1A07_067T01_9000003578_24177cztM0_level2.evt | modeM0/AS1A07_067T01_9000003578_24177cztM0_level2_quad_clean.evt |
| Size (bytes) | 889,375,680 | 81,866,880 |
| Size | 848.2 MB | 78.1 MB |
| Events in quadrant A | 3,784,821 | 519,307 |
| Events in quadrant B | 3,804,639 | 526,482 |
| Events in quadrant C | 4,280,417 | 500,809 |
| Events in quadrant D | 14,542,811 | 394,101 |
| Mode M9 | |||
|---|---|---|---|
| Quadrant | BADHDUFLAG | Total packets | Discarded packets |
| A | 0 | 4 | 0 |
| B | 0 | 5 | 0 |
| C | 0 | 5 | 0 |
| D | 0 | 5 | 0 |
| Mode SS | |||
|---|---|---|---|
| Quadrant | BADHDUFLAG | Total packets | Discarded packets |
| A | 0 | 158 | 0 |
| B | 0 | 158 | 0 |
| C | 0 | 158 | 0 |
| D | 0 | 158 | 0 |
| Mode M0 | |||
|---|---|---|---|
| Quadrant | BADHDUFLAG | Total packets | Discarded packets |
| A | 0 | 16109 | 2 |
| B | 0 | 16087 | 2 |
| C | 0 | 17538 | 3 |
| D | 0 | 48483 | 2 |
| Quadrant | Total seconds | Saturated seconds | Saturation percentage |
|---|---|---|---|
| A | 7727 | 198 | 2.562443% |
| B | 7727 | 220 | 2.847159% |
| C | 7726 | 332 | 4.297178% |
| D | 7726 | 4237 | 54.840797% |
Noise dominated data is calculated using 1-second bins in cleaned event files. If a bin has >2000 counts, and if more than 50% of those come from <1% of pixels, then it is considered to be noise-dominated and hence unusable.
| Quadrant | # 1 sec bins | Bins with >0 counts | Bins with >2000 counts | High rate bins dominated by noise | Noise dominated (total time) | Noise dominated (detector-on time) | Marked lightcurve |
|---|---|---|---|---|---|---|---|
| A | 7857 | 7729 | 0 | 0 | 0.00% | 0.00% |  |
| B | 7857 | 7727 | 0 | 0 | 0.00% | 0.00% |  |
| C | 7856 | 7727 | 45 | 45 | 0.57% | 0.58% |  |
| D | 7856 | 7726 | 3710 | 3710 | 47.23% | 48.02% |  |
Top three noisy pixels from each quadrant. If the there are fewer than three noisy pixels in the level2.evt file, extra rows are filled as -1
| Pixel properties | Quadrant properties | ||||||
|---|---|---|---|---|---|---|---|
| Quadrant | DetID | PixID | Counts | Sigma | Mean | Median | Sigma |
| A | 13 | 170 | 16878 | 81.04 | 977 | 956 | 196.5 |
| A | 13 | 254 | 11650 | 54.43 | 977 | 956 | 196.5 |
| A | 3 | 137 | 8931 | 40.59 | 977 | 956 | 196.5 |
| B | 12 | 111 | 22746 | 116.18 | 966 | 940 | 187.7 |
| B | 11 | 111 | 20608 | 104.79 | 966 | 940 | 187.7 |
| B | 14 | 111 | 17685 | 89.22 | 966 | 940 | 187.7 |
| C | 2 | 16 | 476898 | 2219.66 | 921 | 925 | 214.4 |
| C | 14 | 238 | 145765 | 675.45 | 921 | 925 | 214.4 |
| C | 0 | 239 | 39075 | 177.91 | 921 | 925 | 214.4 |
| D | 7 | 238 | 6621394 | 37302.98 | 724 | 701 | 177.5 |
| D | 12 | 218 | 4616230 | 26005.28 | 724 | 701 | 177.5 |
| D | 8 | 195 | 289301 | 1626.06 | 724 | 701 | 177.5 |
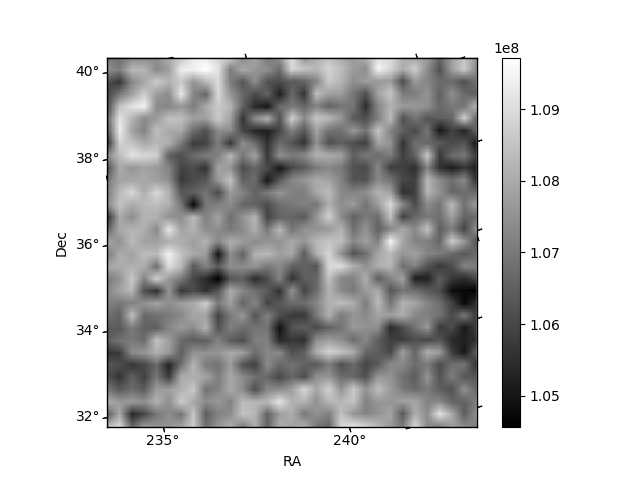
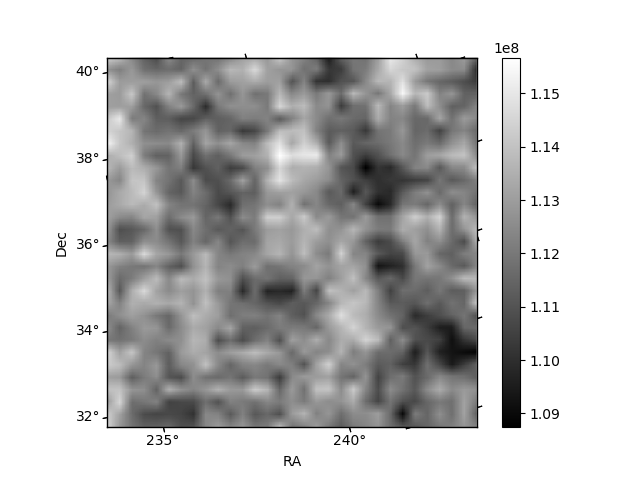
Histogram calculated using DETX and DETY for each event in the final _common_clean file
| Quadrant A |  |
 |
Quadrant B |
|---|---|---|---|
| Quadrant D |  |
 |
Quadrant C |
| Plot type | Count rate plots | Images |
|---|---|---|
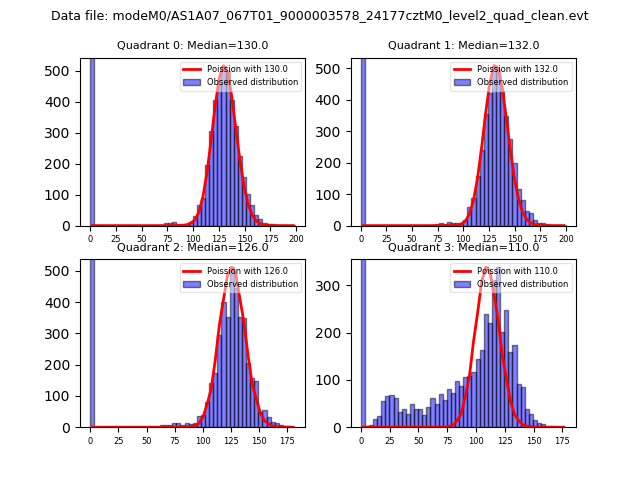
| Comparison with Poisson distribution Blue bars denote a histogram of data divided into 1 sec bins. Red curve is a Poisson curve with rate = median count rate of data. |
 |
 |
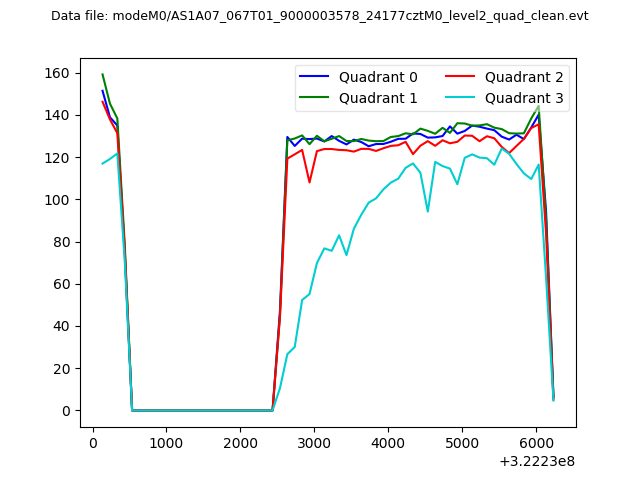
| Quadrant-wise count rates Data is divided into 100 sec bins |
 |
|
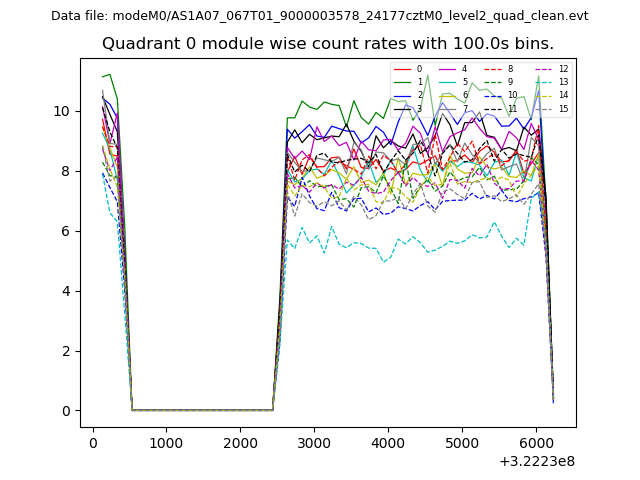
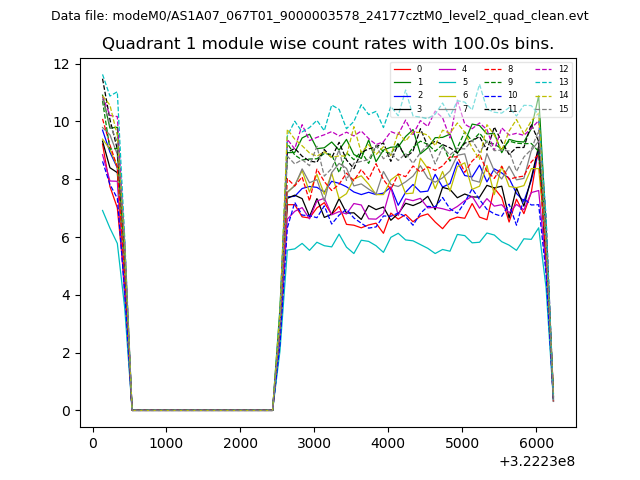
| Module-wise count rates for Quadrant A Data is divided into 100 sec bins |
 |
 |
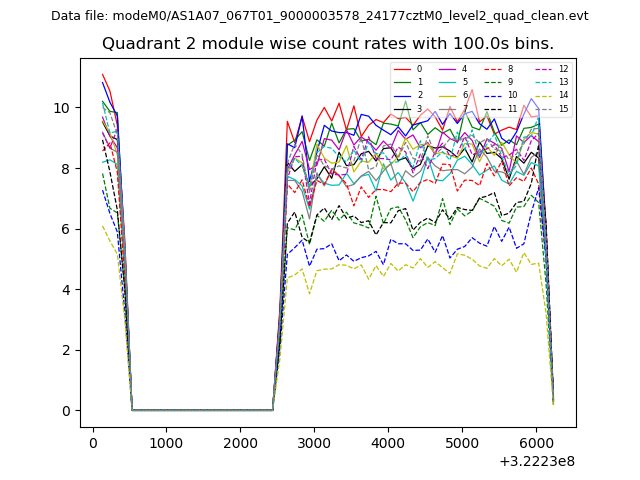
| Module-wise count rates for Quadrant B Data is divided into 100 sec bins |
 |
 |
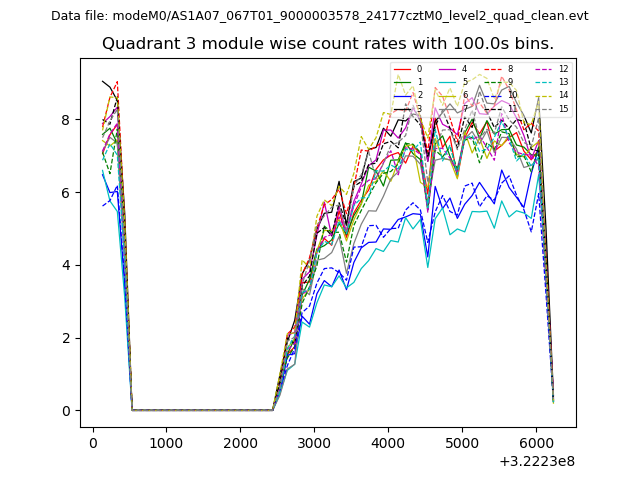
| Module-wise count rates for Quadrant C Data is divided into 100 sec bins |
 |
 |
| Module-wise count rates for Quadrant D Data is divided into 100 sec bins |
 |
 |
| Parameter | Plot |
|---|---|
| CZT HV Monitor | 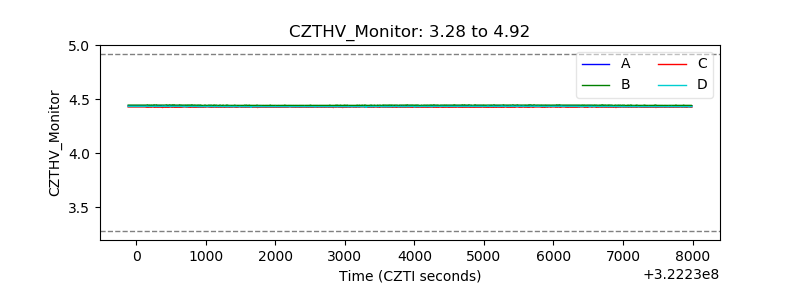 |
| D_VDD | 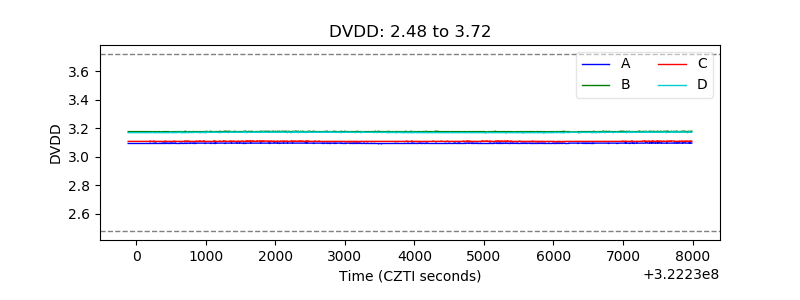 |
| Temperature 1 | 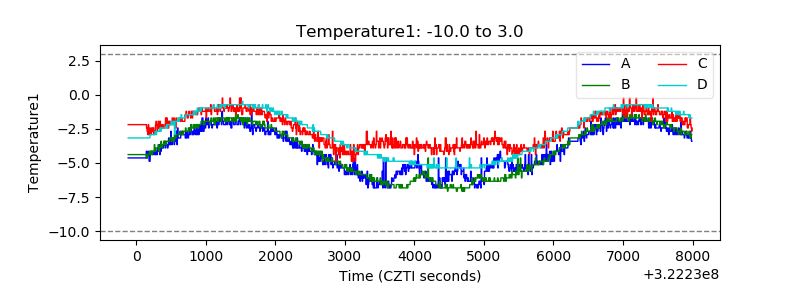 |
| Veto HV Monitor | 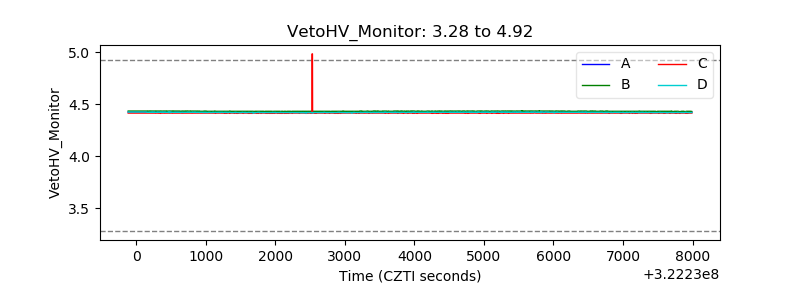 |
| Veto LLD | 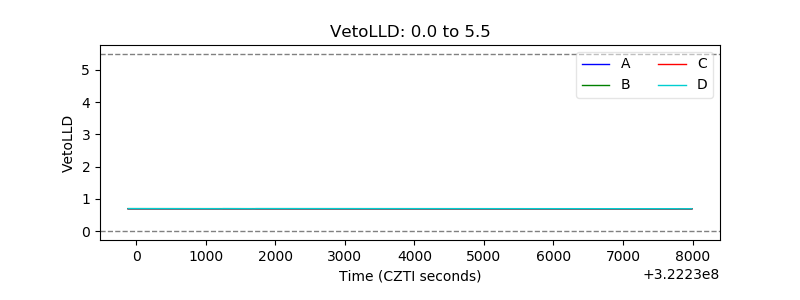 |
| Alpha Counter | 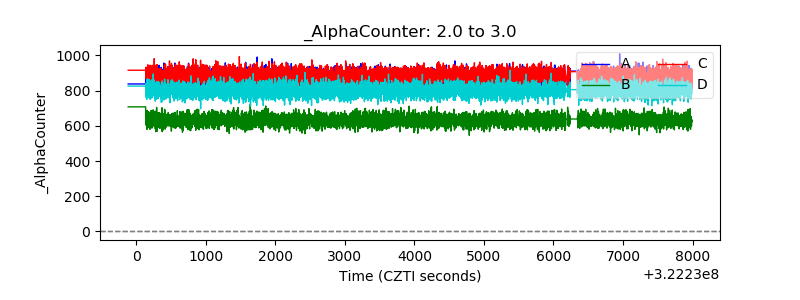 |
| _CPM_Rate | 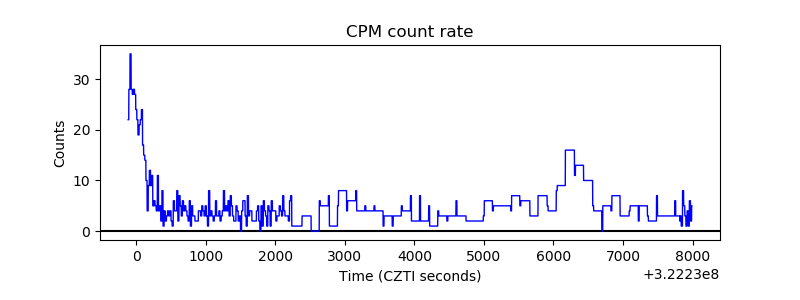 |
| CZT Counter | 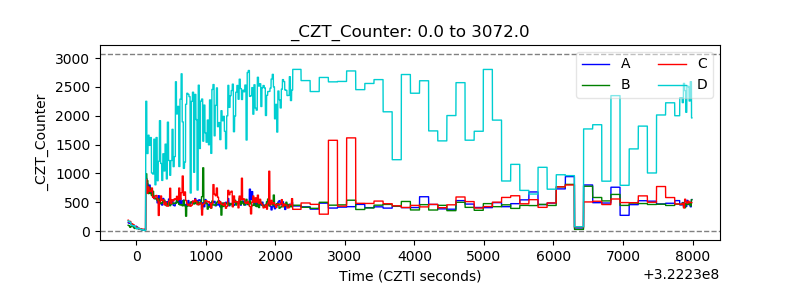 |
| +2.5 Volts monitor |  |
| +5 Volts monitor |  |
| _ROLL_ROT | 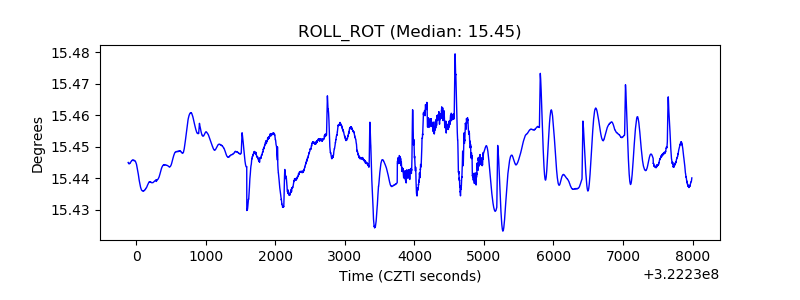 |
| _Roll_DEC | 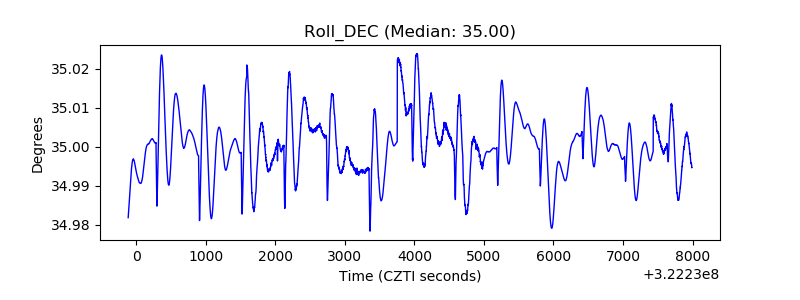 |
| _Roll_RA | 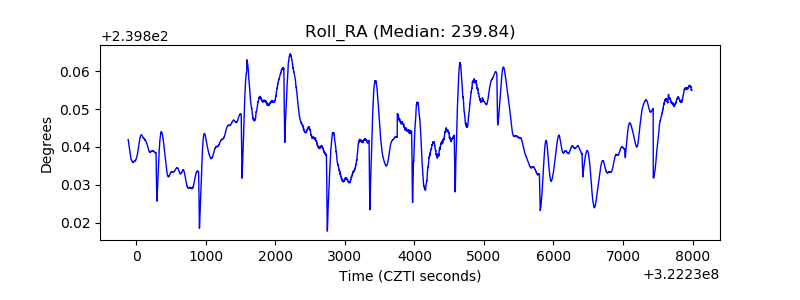 |
| Veto Counter | 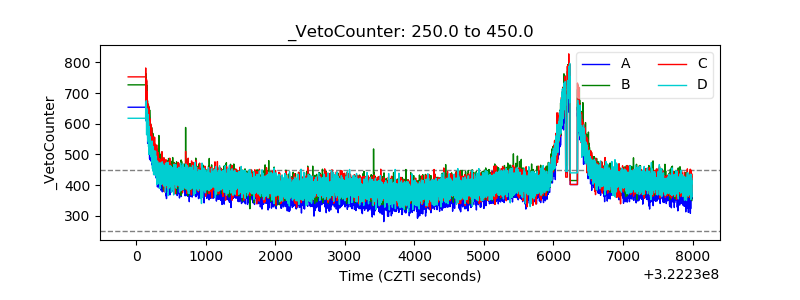 |