| Param | Original file | Final file |
|---|---|---|
| Filename | modeM0/AS1A07_067T01_9000003578_24178cztM0_level2.evt | modeM0/AS1A07_067T01_9000003578_24178cztM0_level2_quad_clean.evt |
| Size (bytes) | 381,375,360 | 52,502,400 |
| Size | 363.7 MB | 50.1 MB |
| Events in quadrant A | 2,106,726 | 324,707 |
| Events in quadrant B | 2,128,150 | 330,228 |
| Events in quadrant C | 2,137,320 | 318,894 |
| Events in quadrant D | 4,881,278 | 309,816 |
| Mode M9 | |||
|---|---|---|---|
| Quadrant | BADHDUFLAG | Total packets | Discarded packets |
| A | 0 | 2 | 0 |
| B | 0 | 2 | 0 |
| C | 0 | 2 | 0 |
| D | 0 | 2 | 0 |
| Mode SS | |||
|---|---|---|---|
| Quadrant | BADHDUFLAG | Total packets | Discarded packets |
| A | 0 | 90 | 0 |
| B | 0 | 90 | 0 |
| C | 0 | 90 | 0 |
| D | 0 | 90 | 0 |
| Mode M0 | |||
|---|---|---|---|
| Quadrant | BADHDUFLAG | Total packets | Discarded packets |
| A | 0 | 9031 | 1 |
| B | 0 | 9042 | 1 |
| C | 0 | 9112 | 2 |
| D | 0 | 17411 | 1 |
| Quadrant | Total seconds | Saturated seconds | Saturation percentage |
|---|---|---|---|
| A | 4344 | 112 | 2.578269% |
| B | 4345 | 120 | 2.761795% |
| C | 4344 | 156 | 3.591160% |
| D | 4344 | 1203 | 27.693370% |
Noise dominated data is calculated using 1-second bins in cleaned event files. If a bin has >2000 counts, and if more than 50% of those come from <1% of pixels, then it is considered to be noise-dominated and hence unusable.
| Quadrant | # 1 sec bins | Bins with >0 counts | Bins with >2000 counts | High rate bins dominated by noise | Noise dominated (total time) | Noise dominated (detector-on time) | Marked lightcurve |
|---|---|---|---|---|---|---|---|
| A | 4584 | 4345 | 0 | 0 | 0.00% | 0.00% | 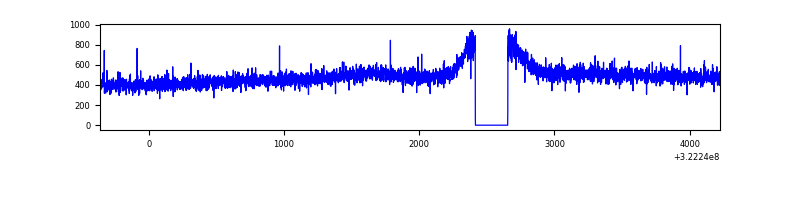 |
| B | 4585 | 4346 | 0 | 0 | 0.00% | 0.00% | 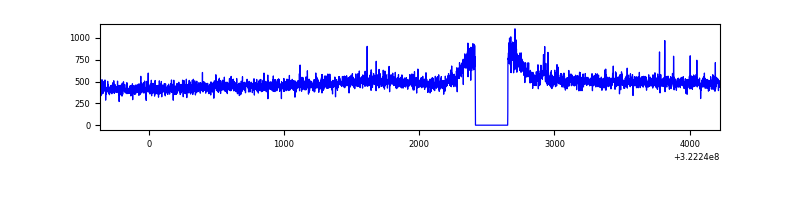 |
| C | 4584 | 4344 | 10 | 10 | 0.22% | 0.23% | 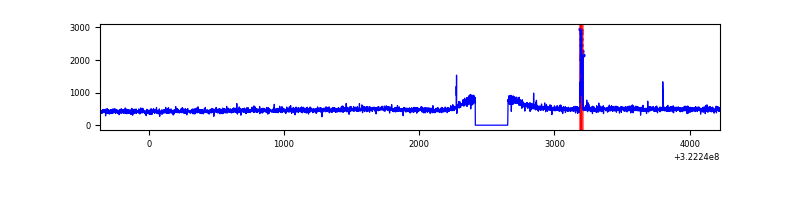 |
| D | 4583 | 4344 | 1018 | 1018 | 22.21% | 23.43% | 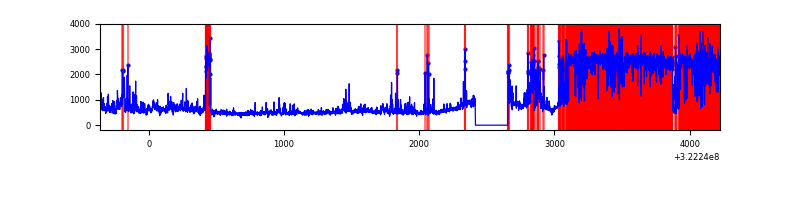 |
Top three noisy pixels from each quadrant. If the there are fewer than three noisy pixels in the level2.evt file, extra rows are filled as -1
| Pixel properties | Quadrant properties | ||||||
|---|---|---|---|---|---|---|---|
| Quadrant | DetID | PixID | Counts | Sigma | Mean | Median | Sigma |
| A | 13 | 254 | 6353 | 51.75 | 546 | 532 | 112.5 |
| A | 3 | 137 | 5022 | 39.92 | 546 | 532 | 112.5 |
| A | 0 | 226 | 4607 | 36.23 | 546 | 532 | 112.5 |
| B | 12 | 111 | 12973 | 119.33 | 539 | 525 | 104.3 |
| B | 11 | 111 | 11521 | 105.41 | 539 | 525 | 104.3 |
| B | 14 | 111 | 9915 | 90.01 | 539 | 525 | 104.3 |
| C | 14 | 238 | 81500 | 663.22 | 517 | 520 | 122.1 |
| C | 2 | 16 | 38938 | 314.64 | 517 | 520 | 122.1 |
| C | 13 | 61 | 3665 | 25.76 | 517 | 520 | 122.1 |
| D | 7 | 238 | 2612451 | 22913.57 | 458 | 443 | 114.0 |
| D | 12 | 218 | 285349 | 2499.31 | 458 | 443 | 114.0 |
| D | 8 | 195 | 172150 | 1506.28 | 458 | 443 | 114.0 |
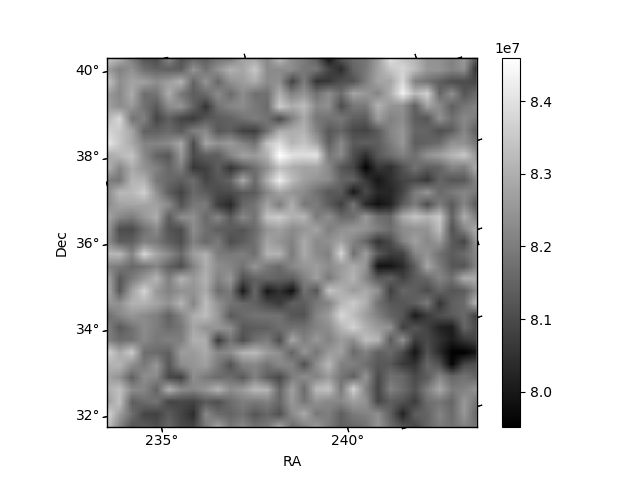
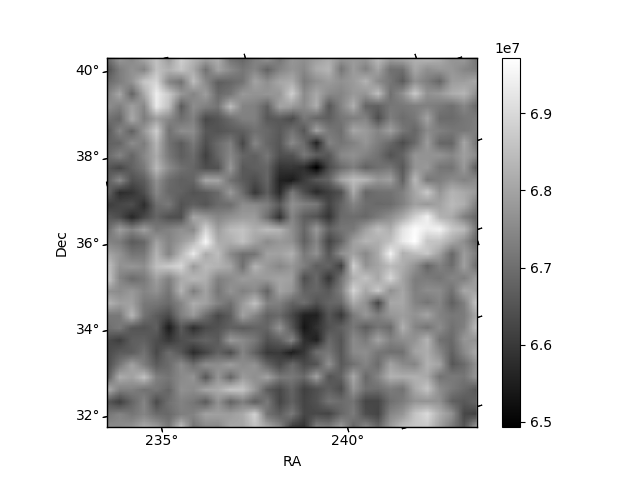
Histogram calculated using DETX and DETY for each event in the final _common_clean file
| Quadrant A | 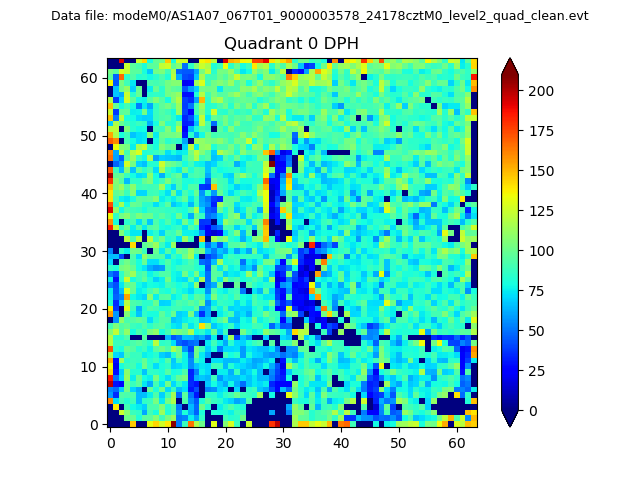 |
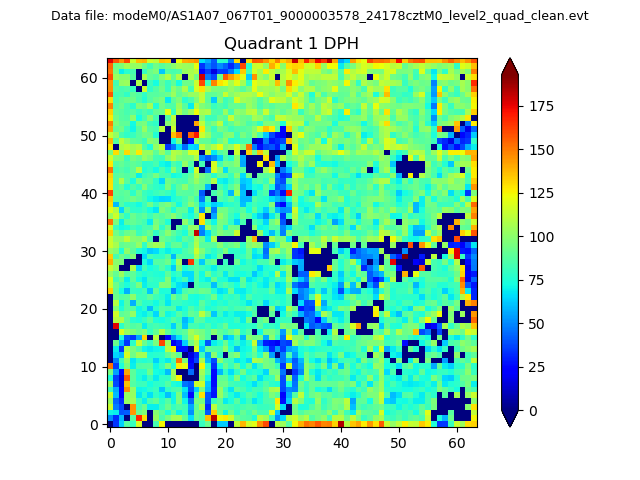 |
Quadrant B |
|---|---|---|---|
| Quadrant D | 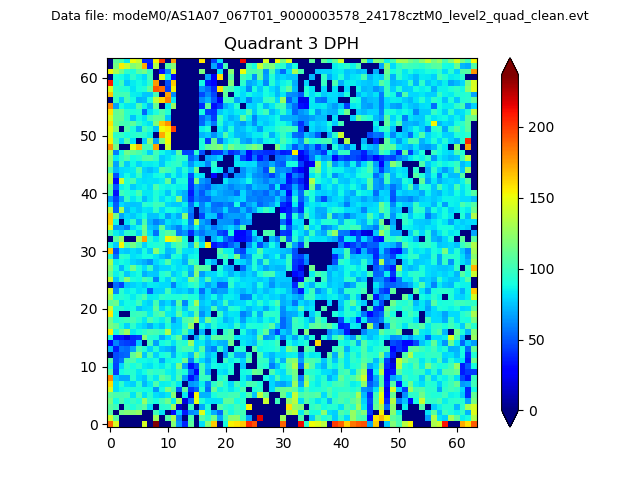 |
 |
Quadrant C |
| Plot type | Count rate plots | Images |
|---|---|---|
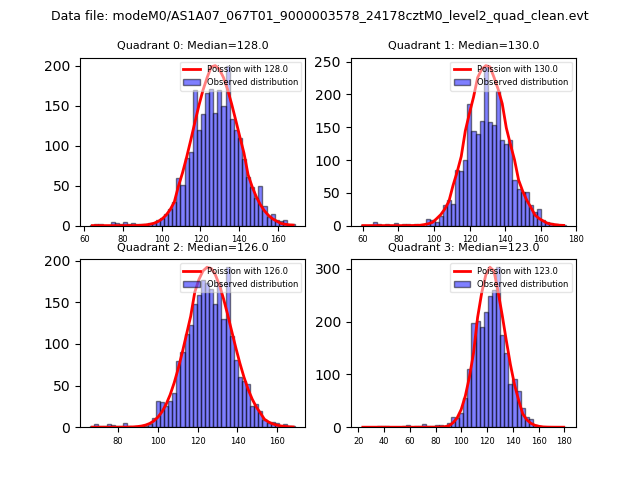
| Comparison with Poisson distribution Blue bars denote a histogram of data divided into 1 sec bins. Red curve is a Poisson curve with rate = median count rate of data. |
 |
 |
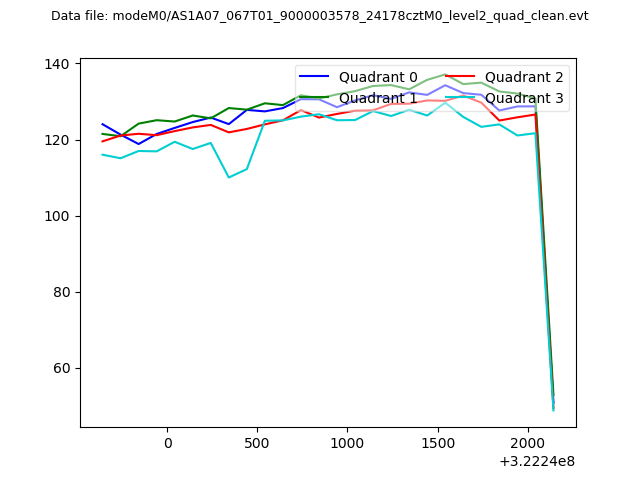
| Quadrant-wise count rates Data is divided into 100 sec bins |
 |
|
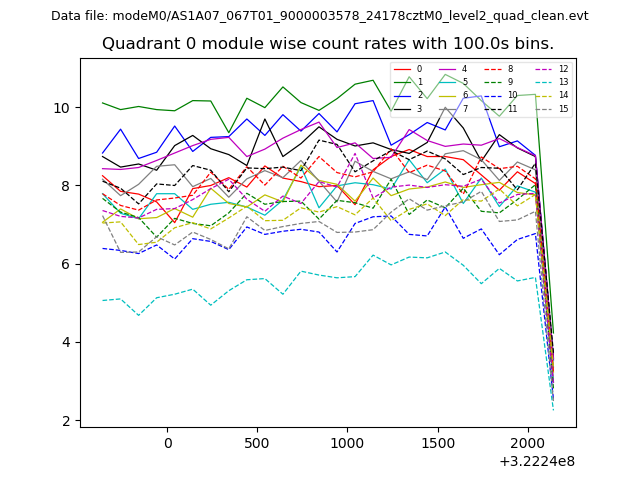
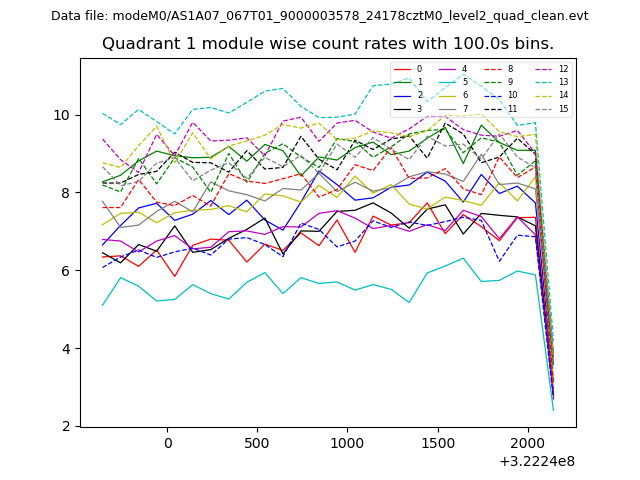
| Module-wise count rates for Quadrant A Data is divided into 100 sec bins |
 |
 |
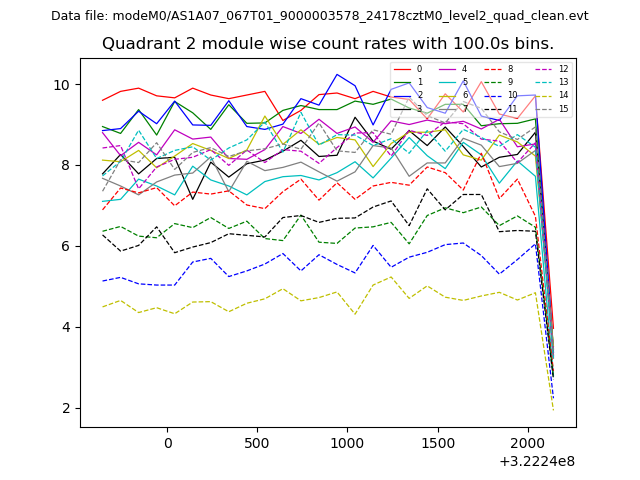
| Module-wise count rates for Quadrant B Data is divided into 100 sec bins |
 |
 |
| Module-wise count rates for Quadrant C Data is divided into 100 sec bins |
 |
 |
| Module-wise count rates for Quadrant D Data is divided into 100 sec bins |
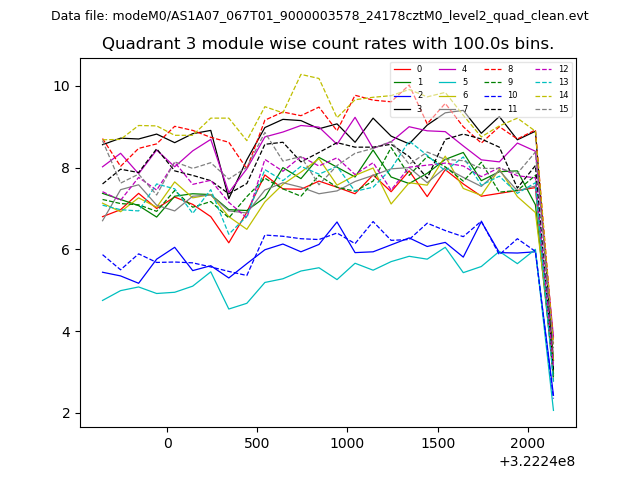 |
 |
| Parameter | Plot |
|---|---|
| CZT HV Monitor | 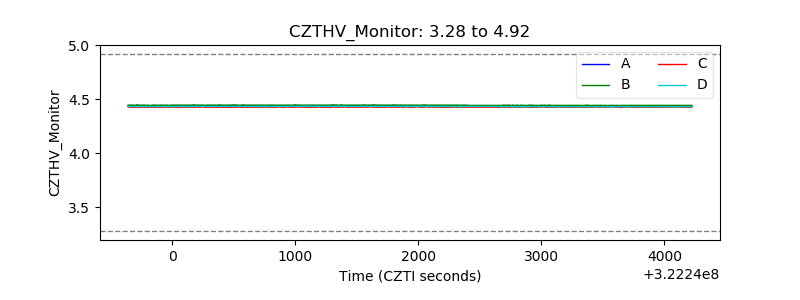 |
| D_VDD | 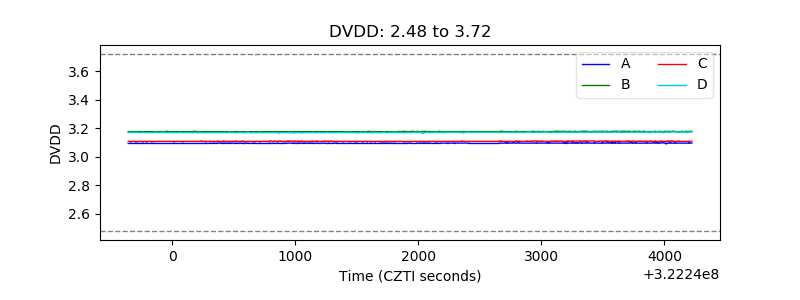 |
| Temperature 1 | 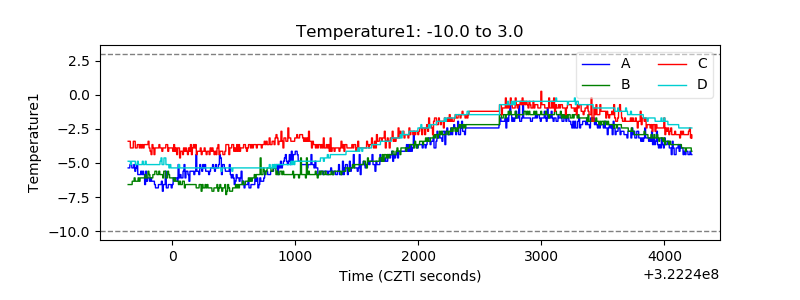 |
| Veto HV Monitor |  |
| Veto LLD | 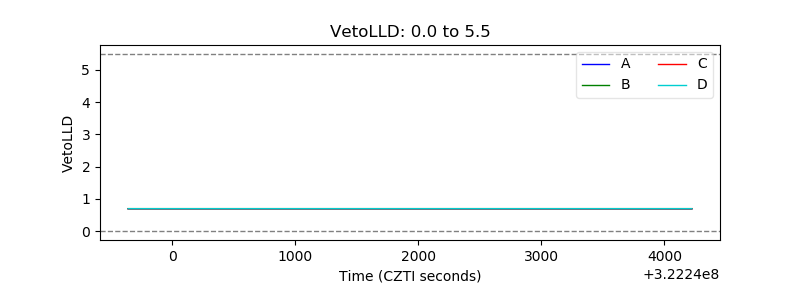 |
| Alpha Counter | 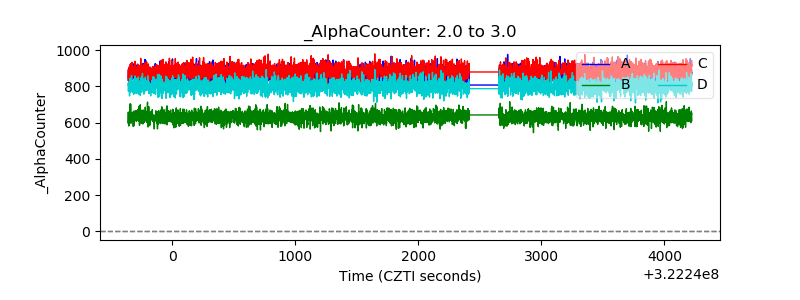 |
| _CPM_Rate | 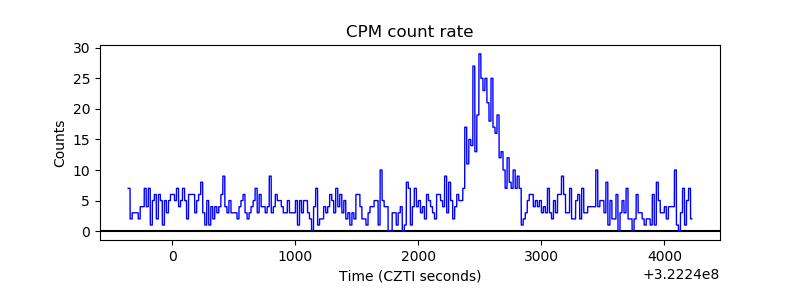 |
| CZT Counter |  |
| +2.5 Volts monitor |  |
| +5 Volts monitor |  |
| _ROLL_ROT | 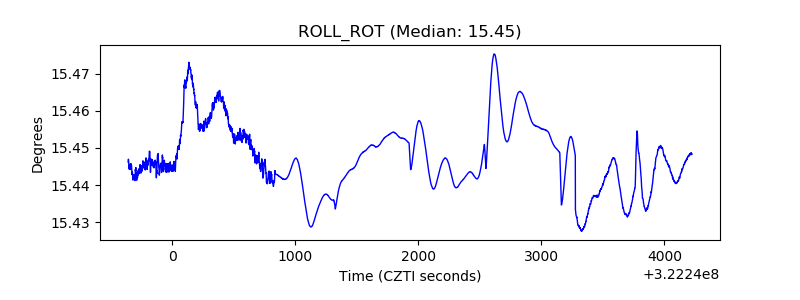 |
| _Roll_DEC | 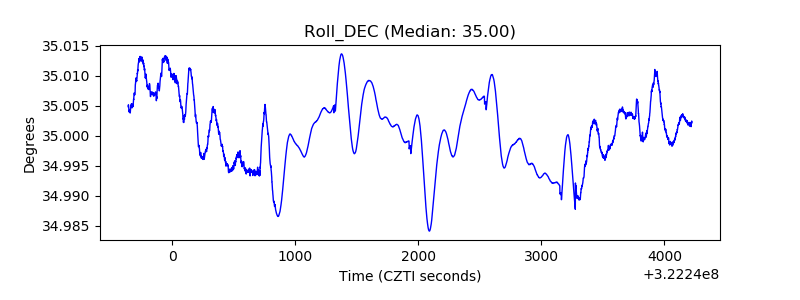 |
| _Roll_RA | 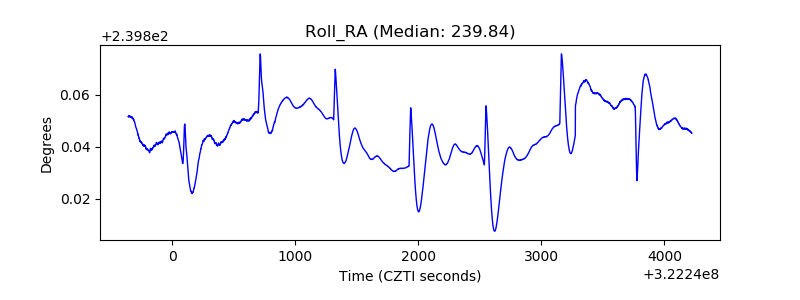 |
| Veto Counter | 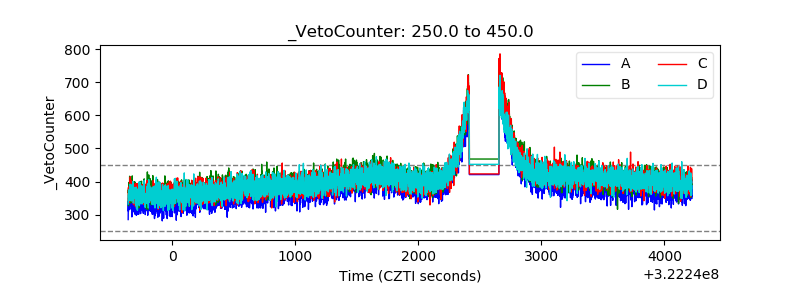 |