| Param | Original file | Final file |
|---|---|---|
| Filename | modeM0/AS1A07_067T01_9000003578_24181cztM0_level2.evt | modeM0/AS1A07_067T01_9000003578_24181cztM0_level2_quad_clean.evt |
| Size (bytes) | 1,557,305,280 | 241,799,040 |
| Size | 1.5 GB | 230.6 MB |
| Events in quadrant A | 8,492,958 | 1,551,524 |
| Events in quadrant B | 8,689,555 | 1,578,374 |
| Events in quadrant C | 8,808,966 | 1,522,929 |
| Events in quadrant D | 19,936,882 | 1,409,449 |
| Mode M9 | |||
|---|---|---|---|
| Quadrant | BADHDUFLAG | Total packets | Discarded packets |
| A | 0 | 19 | 0 |
| B | 0 | 19 | 0 |
| C | 0 | 19 | 0 |
| D | 0 | 19 | 0 |
| Mode SS | |||
|---|---|---|---|
| Quadrant | BADHDUFLAG | Total packets | Discarded packets |
| A | 0 | 372 | 0 |
| B | 0 | 372 | 0 |
| C | 0 | 372 | 0 |
| D | 0 | 372 | 0 |
| Mode M0 | |||
|---|---|---|---|
| Quadrant | BADHDUFLAG | Total packets | Discarded packets |
| A | 0 | 37298 | 3 |
| B | 0 | 37654 | 3 |
| C | 0 | 37926 | 3 |
| D | 0 | 71759 | 3 |
| Quadrant | Total seconds | Saturated seconds | Saturation percentage |
|---|---|---|---|
| A | 18296 | 93 | 0.508308% |
| B | 18296 | 138 | 0.754263% |
| C | 18296 | 258 | 1.410144% |
| D | 18297 | 3585 | 19.593376% |
Noise dominated data is calculated using 1-second bins in cleaned event files. If a bin has >2000 counts, and if more than 50% of those come from <1% of pixels, then it is considered to be noise-dominated and hence unusable.
| Quadrant | # 1 sec bins | Bins with >0 counts | Bins with >2000 counts | High rate bins dominated by noise | Noise dominated (total time) | Noise dominated (detector-on time) | Marked lightcurve |
|---|---|---|---|---|---|---|---|
| A | 20226 | 18299 | 0 | 0 | 0.00% | 0.00% | 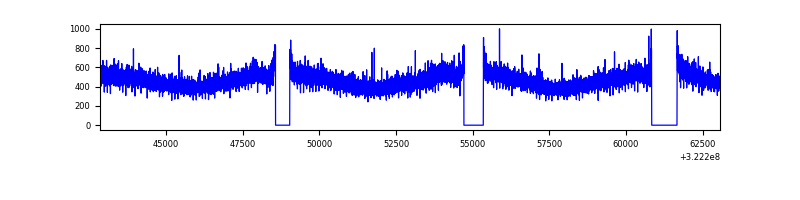 |
| B | 20226 | 18299 | 7 | 7 | 0.03% | 0.04% | 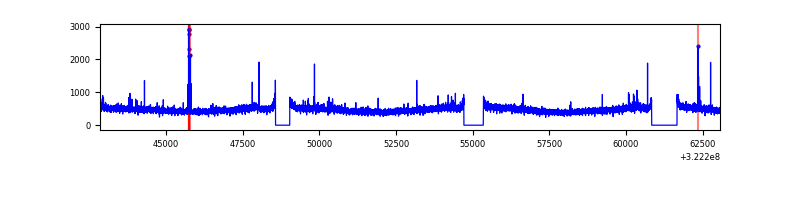 |
| C | 20226 | 18299 | 23 | 23 | 0.11% | 0.13% | 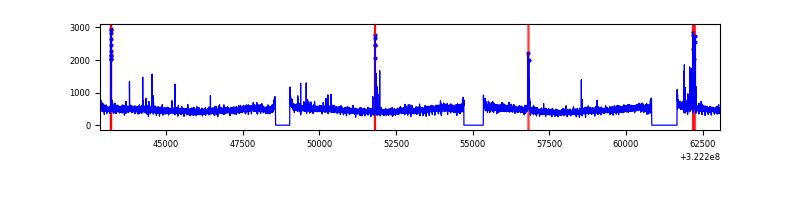 |
| D | 20227 | 18298 | 3062 | 3062 | 15.14% | 16.73% | 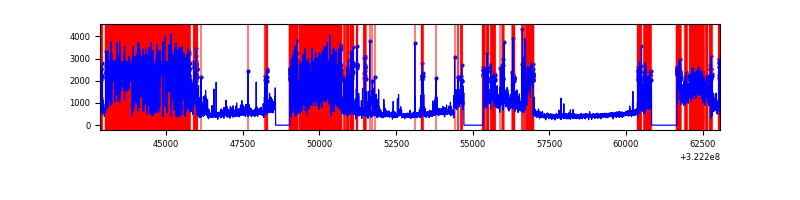 |
Top three noisy pixels from each quadrant. If the there are fewer than three noisy pixels in the level2.evt file, extra rows are filled as -1
| Pixel properties | Quadrant properties | ||||||
|---|---|---|---|---|---|---|---|
| Quadrant | DetID | PixID | Counts | Sigma | Mean | Median | Sigma |
| A | 13 | 254 | 28989 | 60.4 | 2203 | 2154 | 444.3 |
| A | 3 | 137 | 20185 | 40.58 | 2203 | 2154 | 444.3 |
| A | 0 | 226 | 18805 | 37.48 | 2203 | 2154 | 444.3 |
| B | 12 | 111 | 51775 | 118.3 | 2195 | 2136 | 419.6 |
| B | 11 | 111 | 45732 | 103.9 | 2195 | 2136 | 419.6 |
| B | 14 | 111 | 39360 | 88.71 | 2195 | 2136 | 419.6 |
| C | 14 | 238 | 334028 | 674.94 | 2114 | 2125 | 491.8 |
| C | 2 | 16 | 118951 | 237.57 | 2114 | 2125 | 491.8 |
| C | 0 | 239 | 46687 | 90.62 | 2114 | 2125 | 491.8 |
| D | 7 | 238 | 10520475 | 21809.39 | 1977 | 1919 | 482.3 |
| D | 8 | 195 | 1382855 | 2863.26 | 1977 | 1919 | 482.3 |
| D | 1 | 52 | 293239 | 604.03 | 1977 | 1919 | 482.3 |
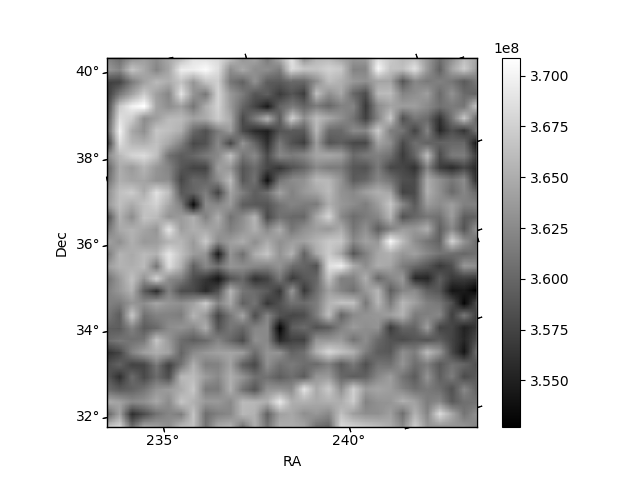
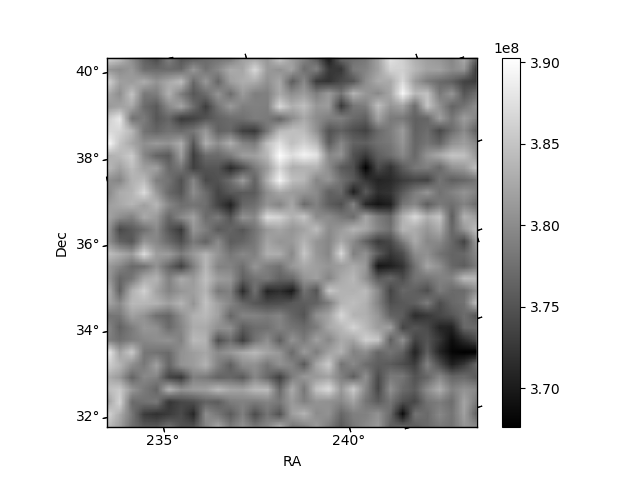
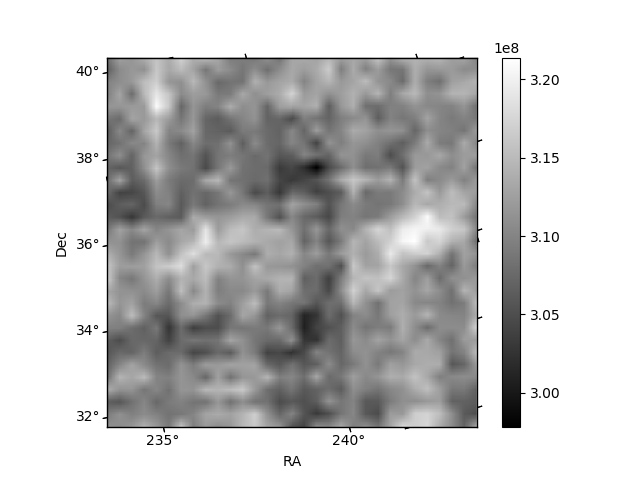
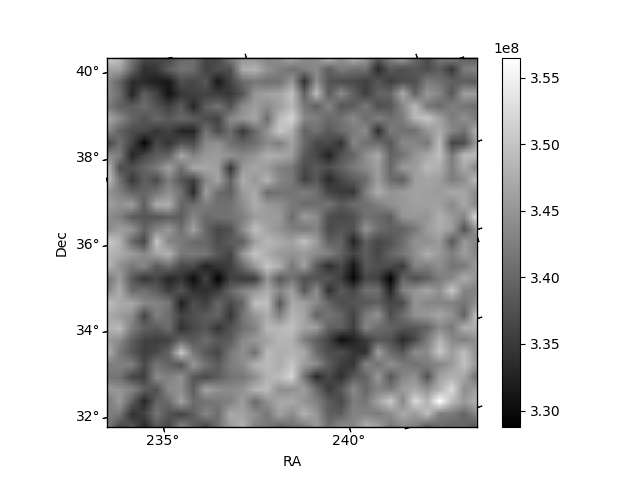
Histogram calculated using DETX and DETY for each event in the final _common_clean file
| Quadrant A | 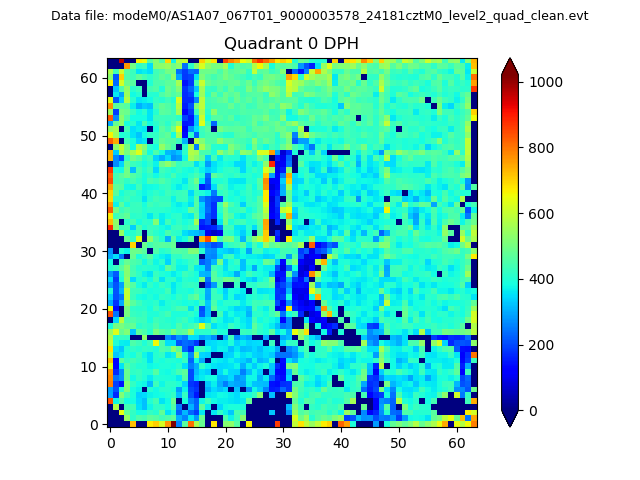 |
 |
Quadrant B |
|---|---|---|---|
| Quadrant D |  |
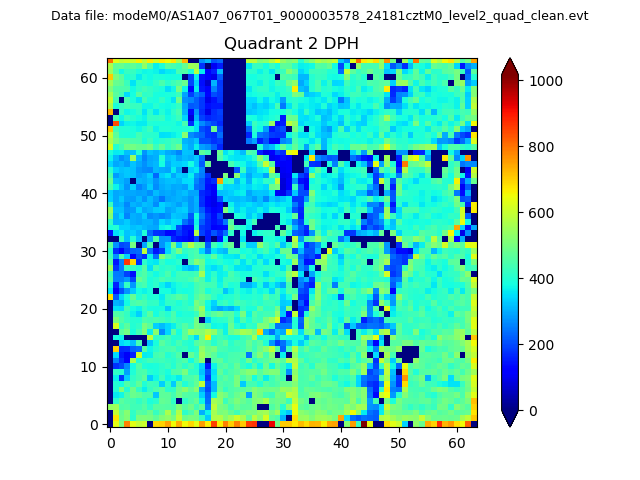 |
Quadrant C |
| Plot type | Count rate plots | Images |
|---|---|---|
| Comparison with Poisson distribution Blue bars denote a histogram of data divided into 1 sec bins. Red curve is a Poisson curve with rate = median count rate of data. |
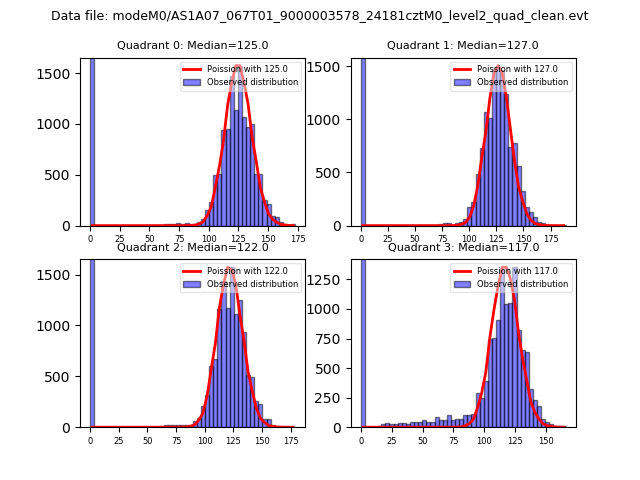 |
 |
| Quadrant-wise count rates Data is divided into 100 sec bins |
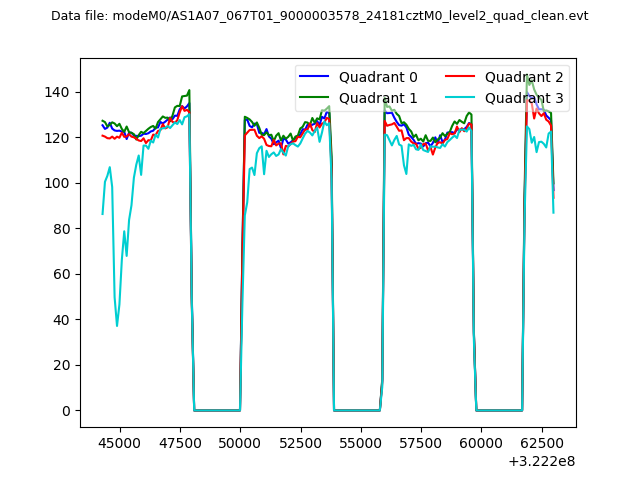 |
|
| Module-wise count rates for Quadrant A Data is divided into 100 sec bins |
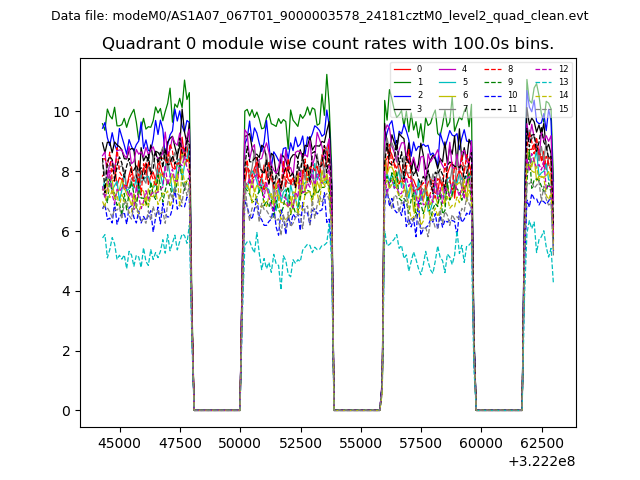 |
 |
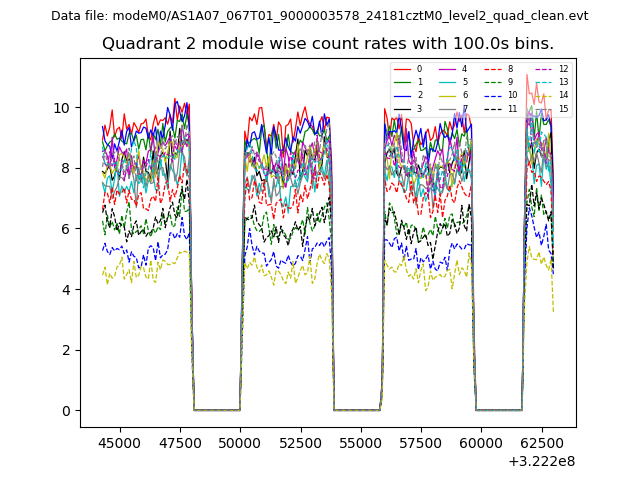
| Module-wise count rates for Quadrant B Data is divided into 100 sec bins |
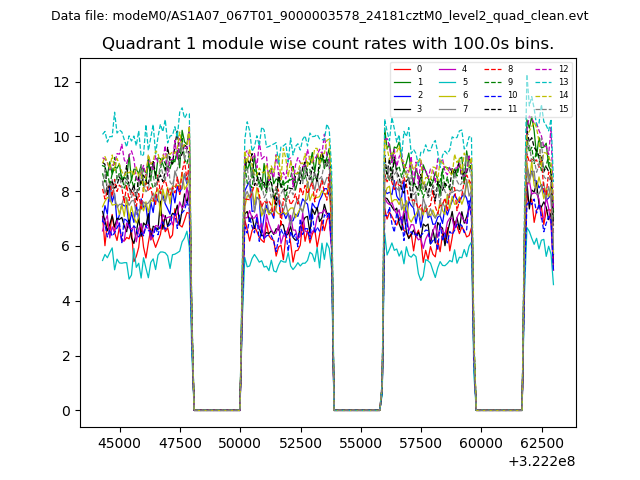 |
 |
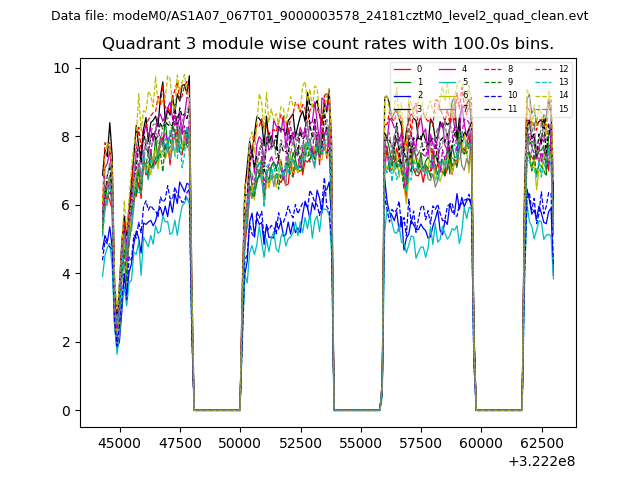
| Module-wise count rates for Quadrant C Data is divided into 100 sec bins |
 |
 |
| Module-wise count rates for Quadrant D Data is divided into 100 sec bins |
 |
 |
| Parameter | Plot |
|---|---|
| CZT HV Monitor |  |
| D_VDD | 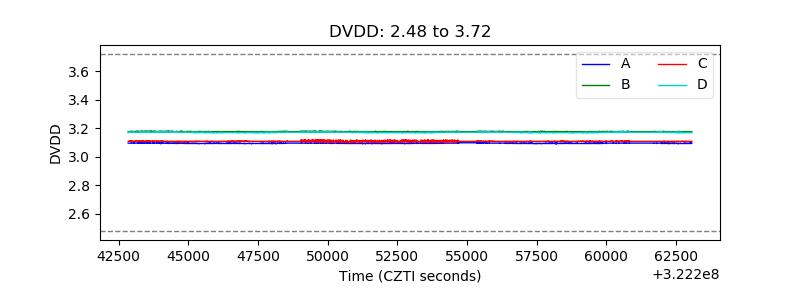 |
| Temperature 1 | 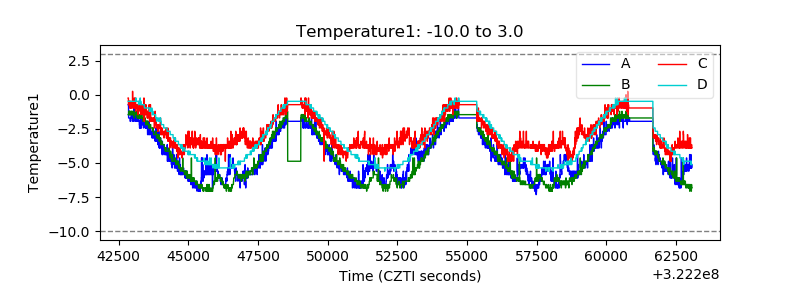 |
| Veto HV Monitor | 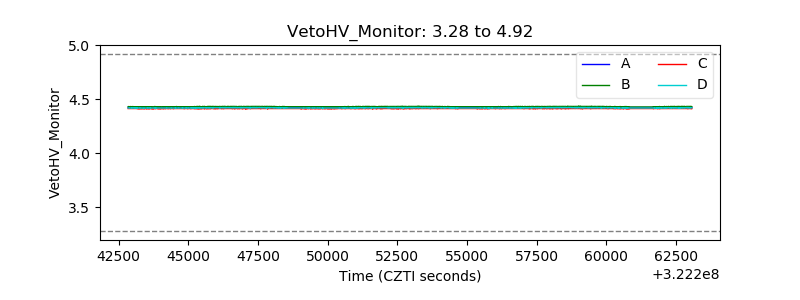 |
| Veto LLD | 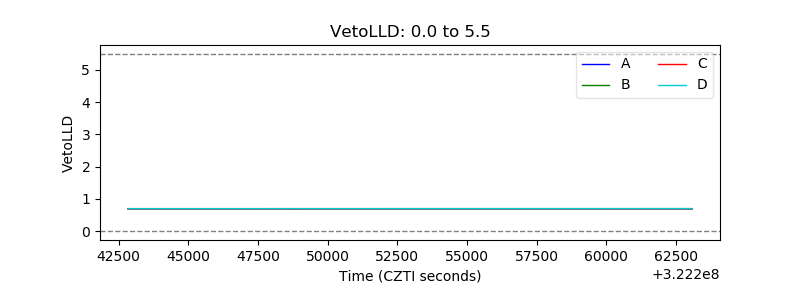 |
| Alpha Counter | 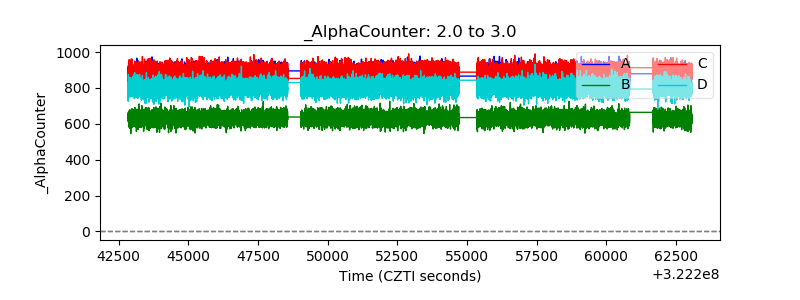 |
| _CPM_Rate | 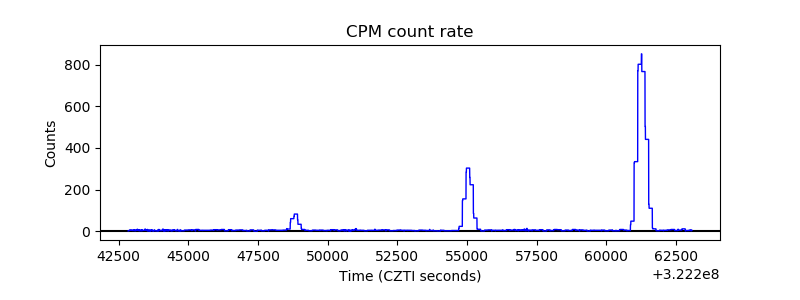 |
| CZT Counter | 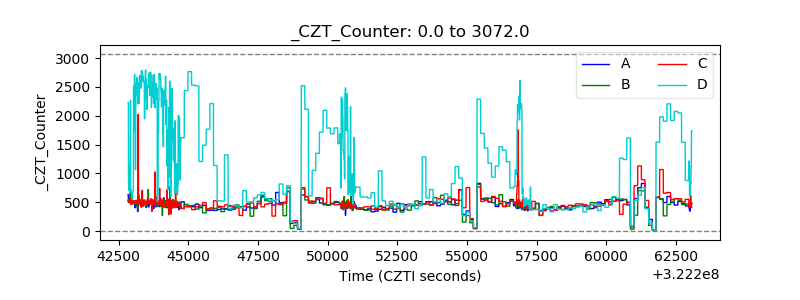 |
| +2.5 Volts monitor |  |
| +5 Volts monitor |  |
| _ROLL_ROT | 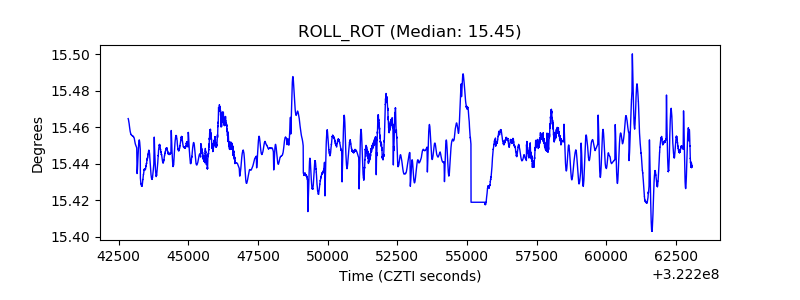 |
| _Roll_DEC | 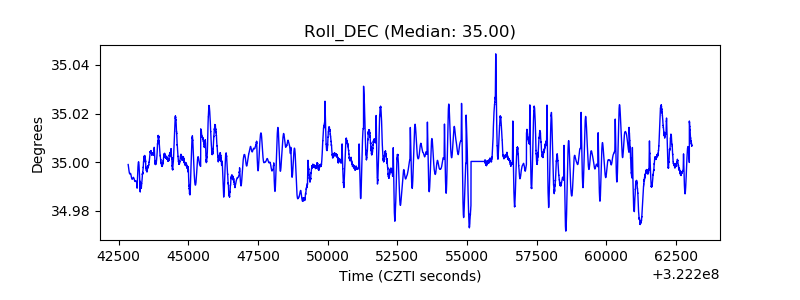 |
| _Roll_RA | 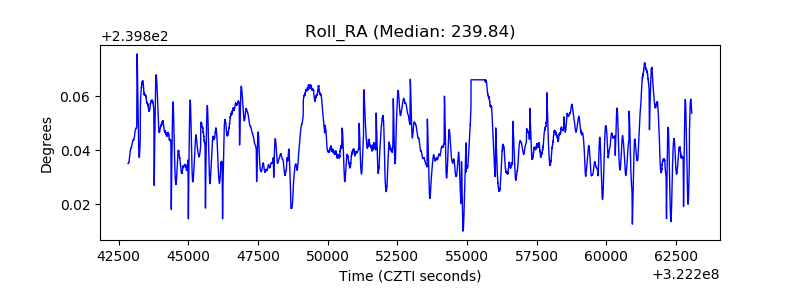 |
| Veto Counter | 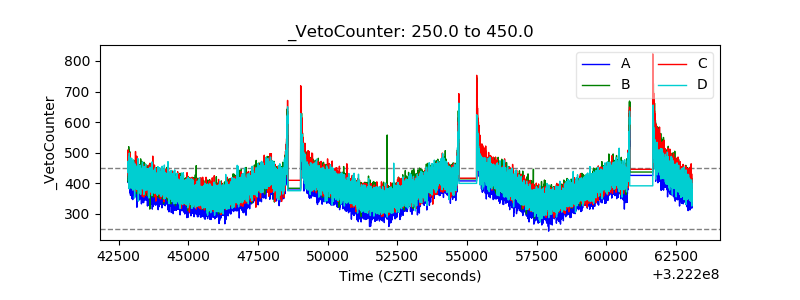 |