| Param | Original file | Final file |
|---|---|---|
| Filename | modeM0/AS1A07_067T01_9000003578_24184cztM0_level2.evt | modeM0/AS1A07_067T01_9000003578_24184cztM0_level2_quad_clean.evt |
| Size (bytes) | 1,334,505,600 | 195,094,080 |
| Size | 1.2 GB | 186.1 MB |
| Events in quadrant A | 6,786,960 | 1,270,479 |
| Events in quadrant B | 6,934,885 | 1,302,894 |
| Events in quadrant C | 8,478,000 | 1,221,886 |
| Events in quadrant D | 17,239,586 | 1,115,011 |
| Mode M9 | |||
|---|---|---|---|
| Quadrant | BADHDUFLAG | Total packets | Discarded packets |
| A | 0 | 17 | 0 |
| B | 0 | 18 | 0 |
| C | 0 | 18 | 0 |
| D | 0 | 18 | 0 |
| Mode SS | |||
|---|---|---|---|
| Quadrant | BADHDUFLAG | Total packets | Discarded packets |
| A | 0 | 296 | 0 |
| B | 0 | 296 | 0 |
| C | 0 | 296 | 0 |
| D | 0 | 296 | 0 |
| Mode M0 | |||
|---|---|---|---|
| Quadrant | BADHDUFLAG | Total packets | Discarded packets |
| A | 0 | 29683 | 3 |
| B | 0 | 29912 | 4 |
| C | 0 | 34461 | 3 |
| D | 0 | 61136 | 3 |
| Quadrant | Total seconds | Saturated seconds | Saturation percentage |
|---|---|---|---|
| A | 14446 | 127 | 0.879136% |
| B | 14446 | 146 | 1.010660% |
| C | 14446 | 678 | 4.693341% |
| D | 14446 | 4119 | 28.513083% |
Noise dominated data is calculated using 1-second bins in cleaned event files. If a bin has >2000 counts, and if more than 50% of those come from <1% of pixels, then it is considered to be noise-dominated and hence unusable.
| Quadrant | # 1 sec bins | Bins with >0 counts | Bins with >2000 counts | High rate bins dominated by noise | Noise dominated (total time) | Noise dominated (detector-on time) | Marked lightcurve |
|---|---|---|---|---|---|---|---|
| A | 38301 | 14449 | 0 | 0 | 0.00% | 0.00% | 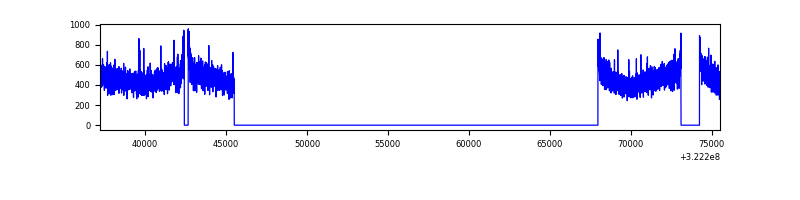 |
| B | 38302 | 14449 | 0 | 0 | 0.00% | 0.00% | 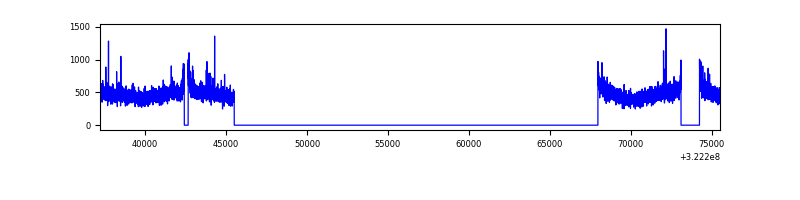 |
| C | 38302 | 14448 | 402 | 402 | 1.05% | 2.78% | 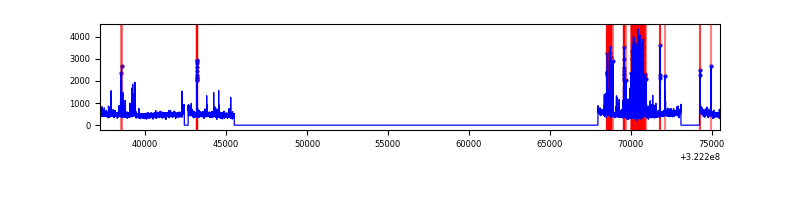 |
| D | 38302 | 14449 | 3640 | 3640 | 9.50% | 25.19% | 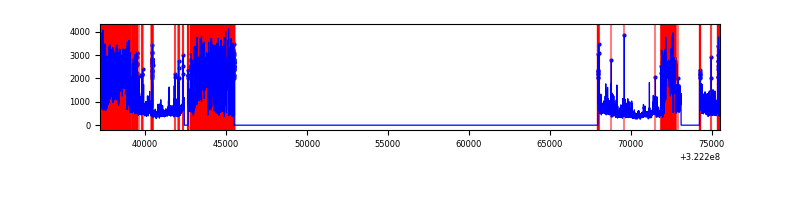 |
Top three noisy pixels from each quadrant. If the there are fewer than three noisy pixels in the level2.evt file, extra rows are filled as -1
| Pixel properties | Quadrant properties | ||||||
|---|---|---|---|---|---|---|---|
| Quadrant | DetID | PixID | Counts | Sigma | Mean | Median | Sigma |
| A | 13 | 254 | 22346 | 58.33 | 1760 | 1721 | 353.6 |
| A | 3 | 137 | 15506 | 38.98 | 1760 | 1721 | 353.6 |
| A | 0 | 226 | 15006 | 37.57 | 1760 | 1721 | 353.6 |
| B | 12 | 111 | 40973 | 118.33 | 1762 | 1723 | 331.7 |
| B | 11 | 111 | 36134 | 103.74 | 1762 | 1723 | 331.7 |
| B | 14 | 111 | 31414 | 89.51 | 1762 | 1723 | 331.7 |
| C | 0 | 239 | 1429060 | 3664.17 | 1681 | 1690 | 389.5 |
| C | 14 | 238 | 269263 | 686.88 | 1681 | 1690 | 389.5 |
| C | 2 | 16 | 114081 | 288.52 | 1681 | 1690 | 389.5 |
| D | 7 | 238 | 8492354 | 23727.59 | 1481 | 1439 | 357.8 |
| D | 12 | 218 | 2025530 | 5656.26 | 1481 | 1439 | 357.8 |
| D | 8 | 195 | 716206 | 1997.39 | 1481 | 1439 | 357.8 |
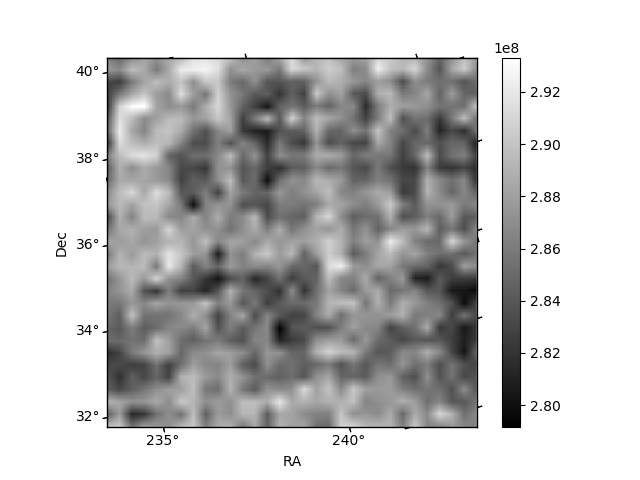
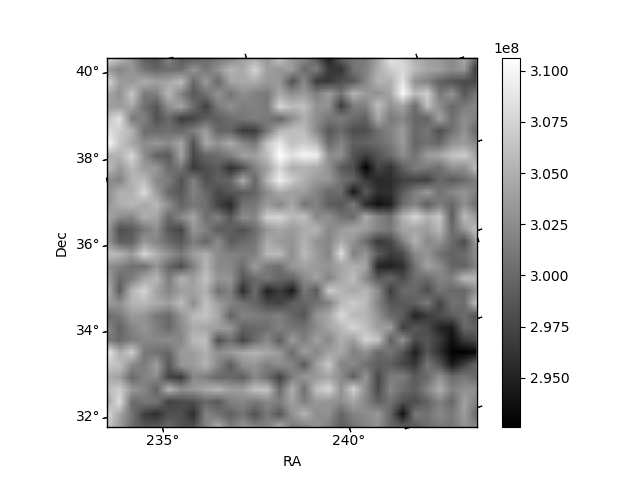
Histogram calculated using DETX and DETY for each event in the final _common_clean file
| Quadrant A |  |
 |
Quadrant B |
|---|---|---|---|
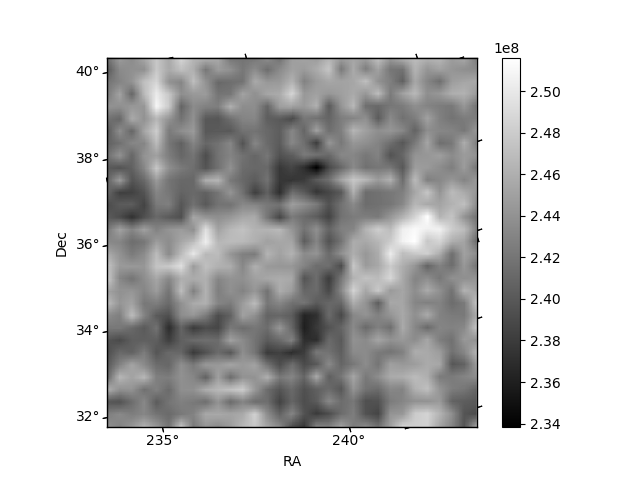
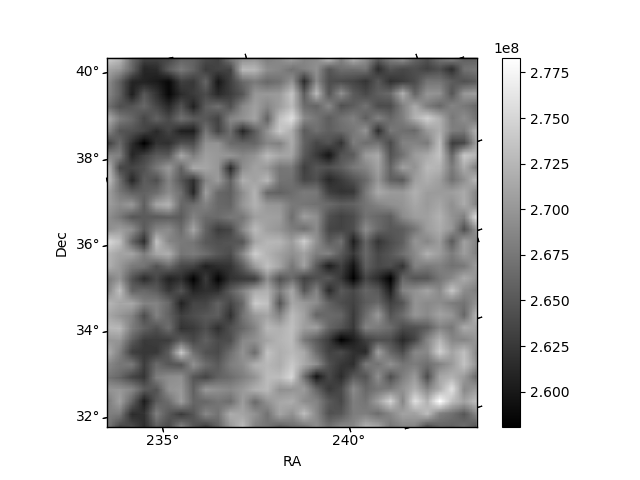
| Quadrant D | 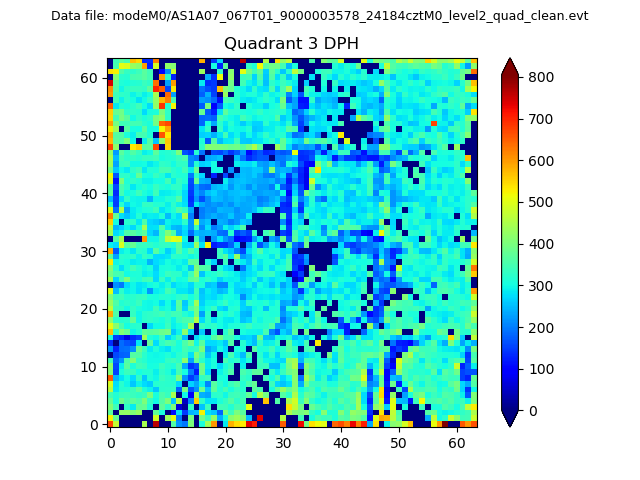 |
 |
Quadrant C |
| Plot type | Count rate plots | Images |
|---|---|---|
| Comparison with Poisson distribution Blue bars denote a histogram of data divided into 1 sec bins. Red curve is a Poisson curve with rate = median count rate of data. |
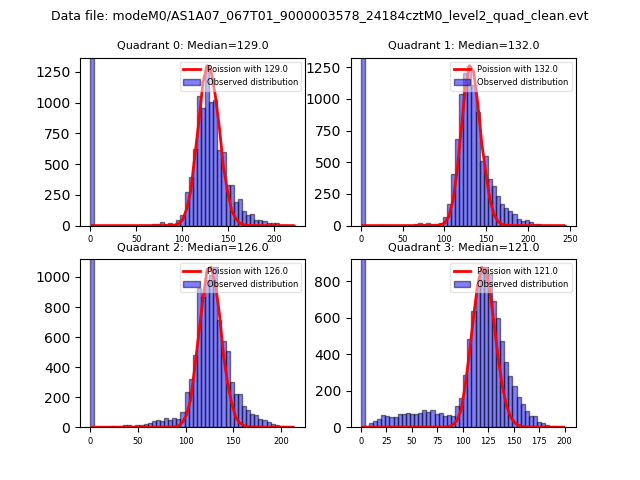 |
 |
| Quadrant-wise count rates Data is divided into 100 sec bins |
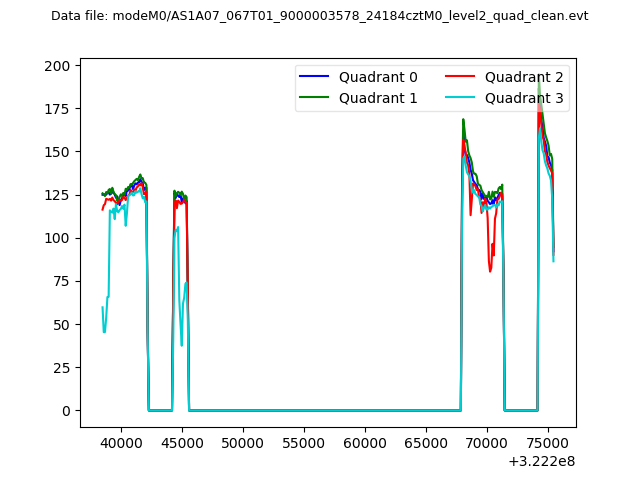 |
|
| Module-wise count rates for Quadrant A Data is divided into 100 sec bins |
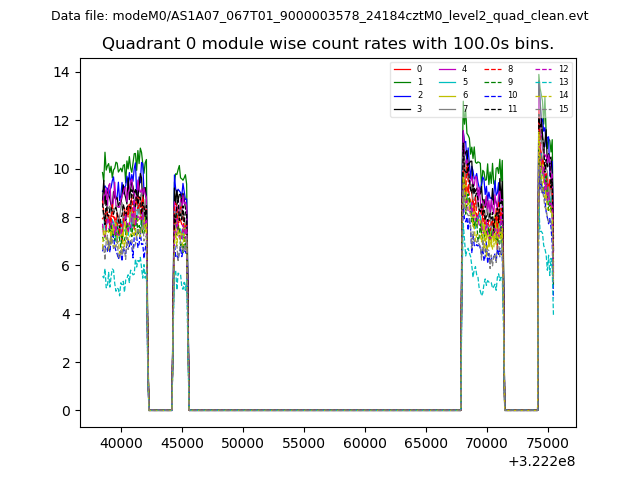 |
 |
| Module-wise count rates for Quadrant B Data is divided into 100 sec bins |
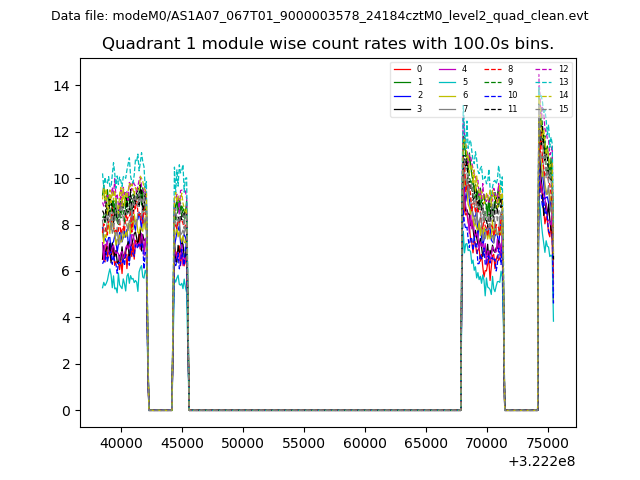 |
 |
| Module-wise count rates for Quadrant C Data is divided into 100 sec bins |
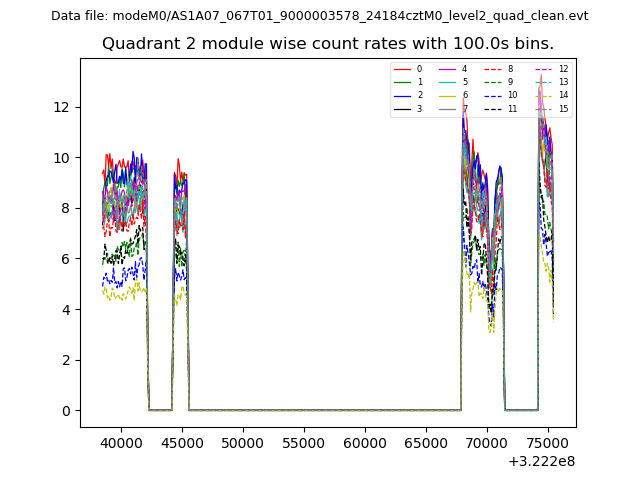 |
 |
| Module-wise count rates for Quadrant D Data is divided into 100 sec bins |
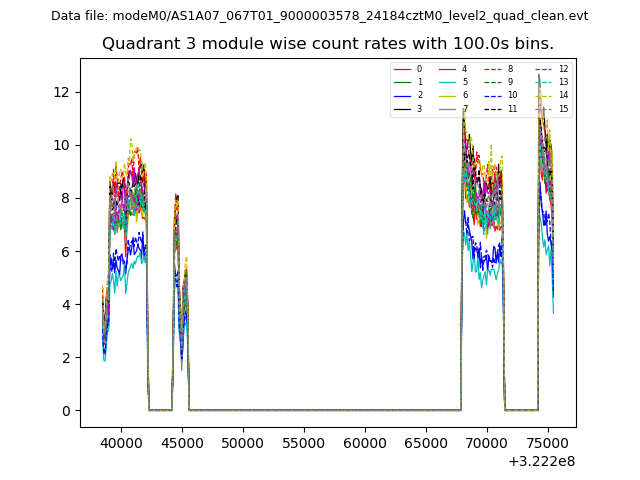 |
 |
| Parameter | Plot |
|---|---|
| CZT HV Monitor | 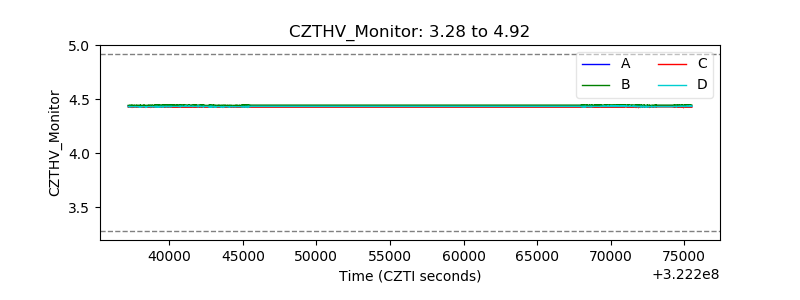 |
| D_VDD | 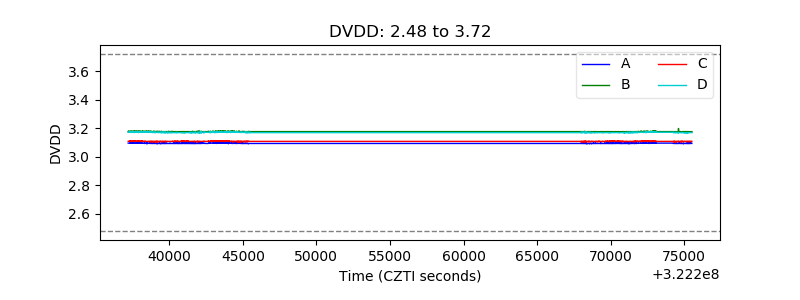 |
| Temperature 1 | 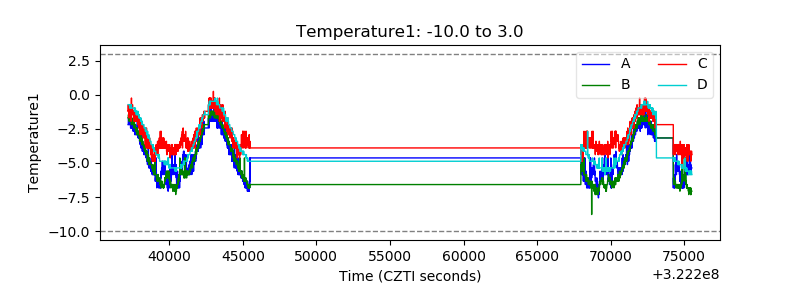 |
| Veto HV Monitor | 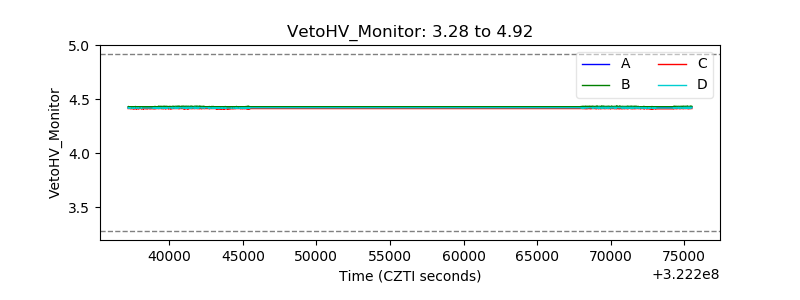 |
| Veto LLD | 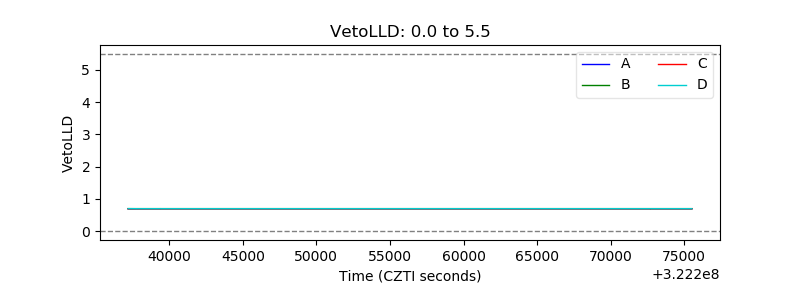 |
| Alpha Counter | 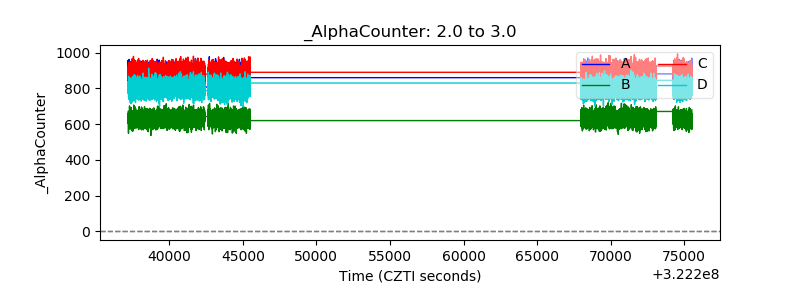 |
| _CPM_Rate | 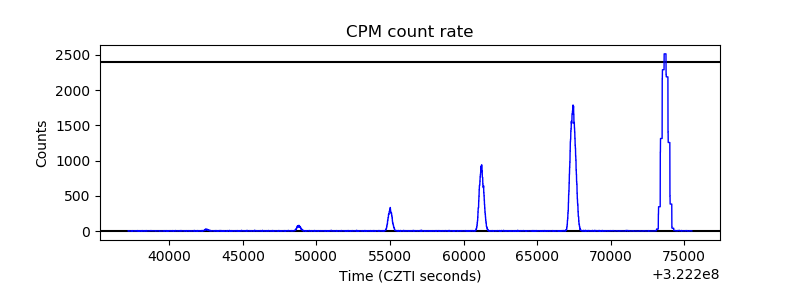 |
| CZT Counter |  |
| +2.5 Volts monitor | 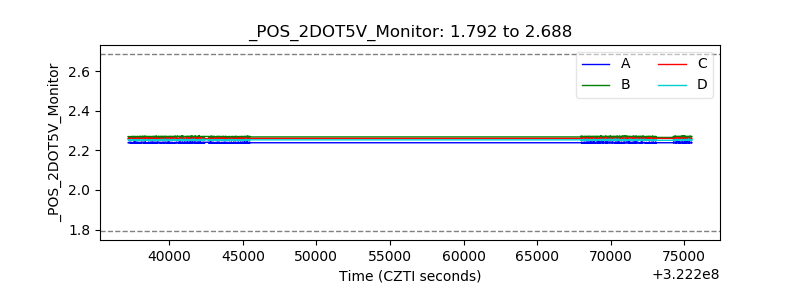 |
| +5 Volts monitor | 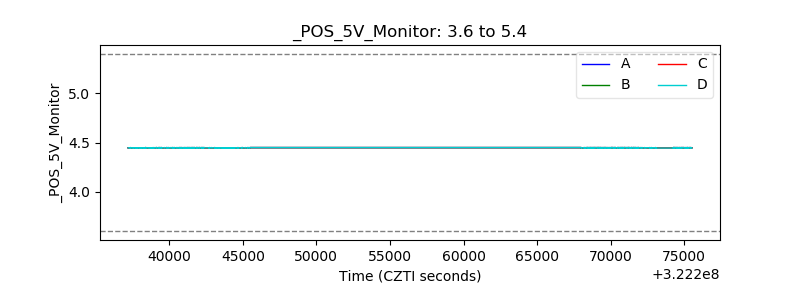 |
| _ROLL_ROT | 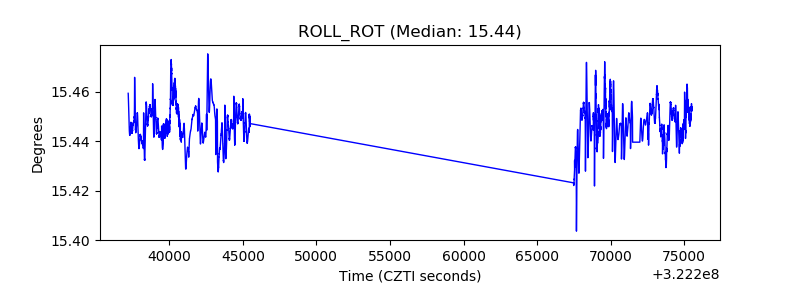 |
| _Roll_DEC | 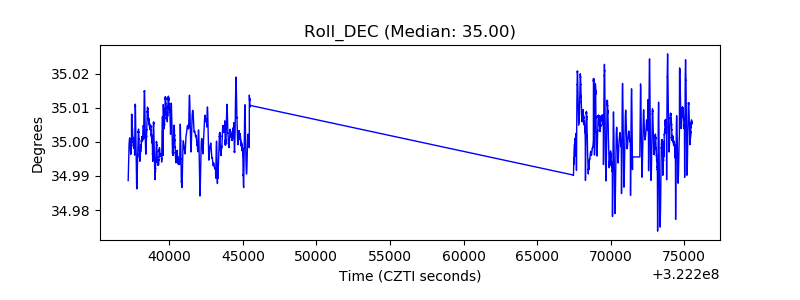 |
| _Roll_RA | 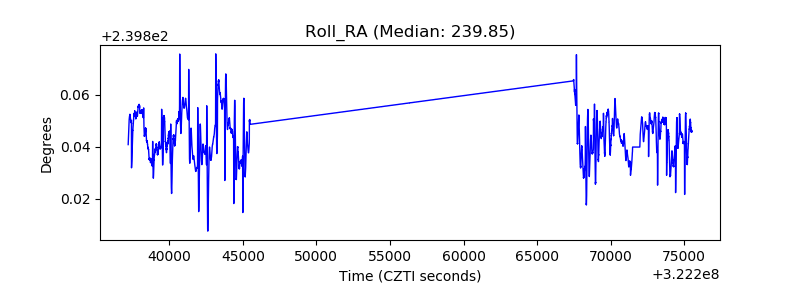 |
| Veto Counter | 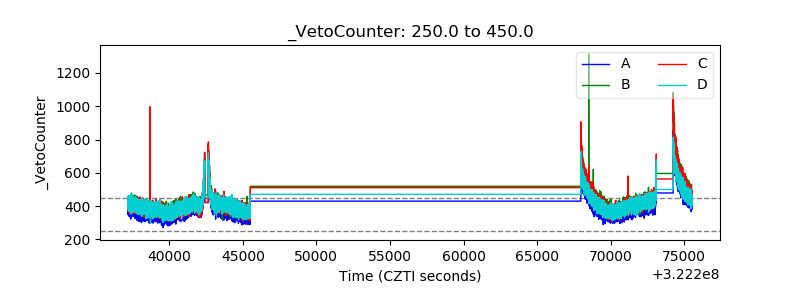 |