| Param | Original file | Final file |
|---|---|---|
| Filename | modeM0/AS1A07_067T01_9000003578_24185cztM0_level2.evt | modeM0/AS1A07_067T01_9000003578_24185cztM0_level2_quad_clean.evt |
| Size (bytes) | 485,634,240 | 98,389,440 |
| Size | 463.1 MB | 93.8 MB |
| Events in quadrant A | 3,139,950 | 644,673 |
| Events in quadrant B | 3,222,565 | 668,130 |
| Events in quadrant C | 3,266,062 | 628,833 |
| Events in quadrant D | 4,646,980 | 593,989 |
| Mode M9 | |||
|---|---|---|---|
| Quadrant | BADHDUFLAG | Total packets | Discarded packets |
| A | 0 | 24 | 0 |
| B | 0 | 24 | 0 |
| C | 0 | 24 | 0 |
| D | 0 | 24 | 0 |
| Mode SS | |||
|---|---|---|---|
| Quadrant | BADHDUFLAG | Total packets | Discarded packets |
| A | 0 | 132 | 0 |
| B | 0 | 132 | 0 |
| C | 0 | 132 | 0 |
| D | 0 | 132 | 0 |
| Mode M0 | |||
|---|---|---|---|
| Quadrant | BADHDUFLAG | Total packets | Discarded packets |
| A | 0 | 13320 | 2 |
| B | 0 | 13531 | 2 |
| C | 0 | 13754 | 2 |
| D | 0 | 18238 | 2 |
| Quadrant | Total seconds | Saturated seconds | Saturation percentage |
|---|---|---|---|
| A | 6362 | 28 | 0.440113% |
| B | 6363 | 51 | 0.801509% |
| C | 6363 | 89 | 1.398711% |
| D | 6363 | 157 | 2.467390% |
Noise dominated data is calculated using 1-second bins in cleaned event files. If a bin has >2000 counts, and if more than 50% of those come from <1% of pixels, then it is considered to be noise-dominated and hence unusable.
| Quadrant | # 1 sec bins | Bins with >0 counts | Bins with >2000 counts | High rate bins dominated by noise | Noise dominated (total time) | Noise dominated (detector-on time) | Marked lightcurve |
|---|---|---|---|---|---|---|---|
| A | 8747 | 6363 | 0 | 0 | 0.00% | 0.00% | 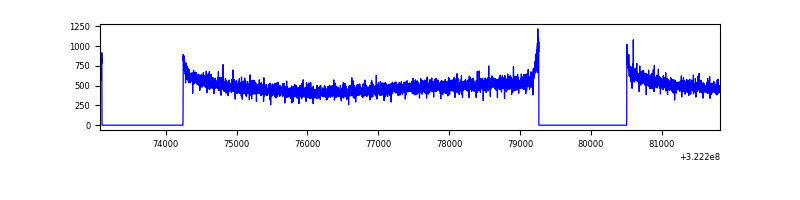 |
| B | 8748 | 6364 | 2 | 2 | 0.02% | 0.03% | 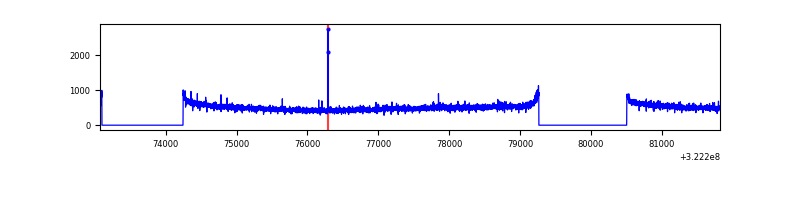 |
| C | 8748 | 6365 | 4 | 4 | 0.05% | 0.06% |  |
| D | 8748 | 6365 | 111 | 111 | 1.27% | 1.74% | 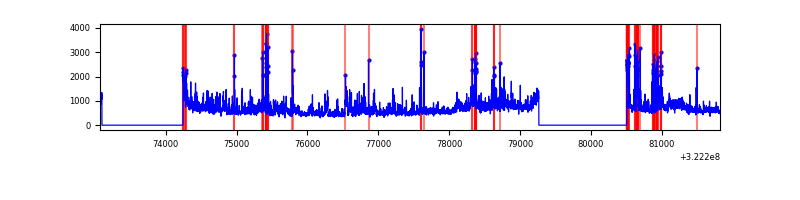 |
Top three noisy pixels from each quadrant. If the there are fewer than three noisy pixels in the level2.evt file, extra rows are filled as -1
| Pixel properties | Quadrant properties | ||||||
|---|---|---|---|---|---|---|---|
| Quadrant | DetID | PixID | Counts | Sigma | Mean | Median | Sigma |
| A | 13 | 254 | 10077 | 57.27 | 814 | 800 | 162.0 |
| A | 0 | 226 | 6933 | 37.86 | 814 | 800 | 162.0 |
| A | 3 | 137 | 6890 | 37.59 | 814 | 800 | 162.0 |
| B | 12 | 111 | 18125 | 112.2 | 820 | 802 | 154.4 |
| B | 11 | 111 | 15962 | 98.19 | 820 | 802 | 154.4 |
| B | 14 | 111 | 14225 | 86.94 | 820 | 802 | 154.4 |
| C | 14 | 238 | 128523 | 710.31 | 781 | 788 | 179.8 |
| C | 2 | 16 | 61741 | 338.95 | 781 | 788 | 179.8 |
| C | 7 | 247 | 12398 | 64.56 | 781 | 788 | 179.8 |
| D | 7 | 238 | 930796 | 4969.13 | 773 | 751 | 187.2 |
| D | 1 | 52 | 447025 | 2384.39 | 773 | 751 | 187.2 |
| D | 8 | 195 | 214298 | 1140.96 | 773 | 751 | 187.2 |
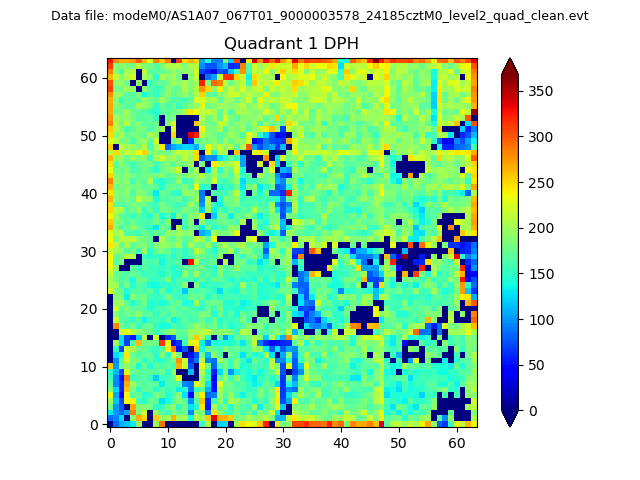
Histogram calculated using DETX and DETY for each event in the final _common_clean file
| Quadrant A | 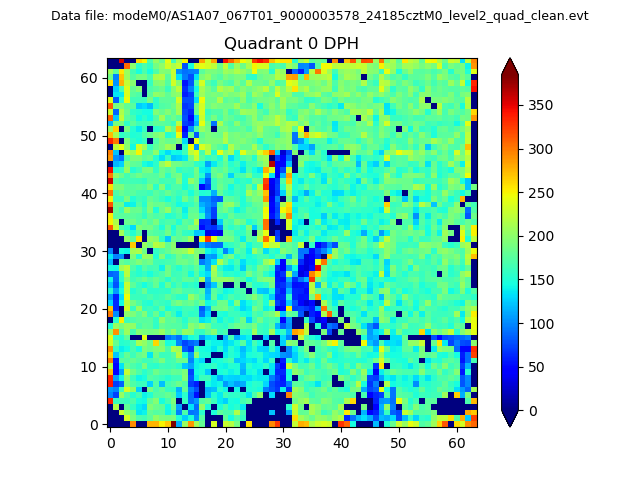 |
 |
Quadrant B |
|---|---|---|---|
| Quadrant D |  |
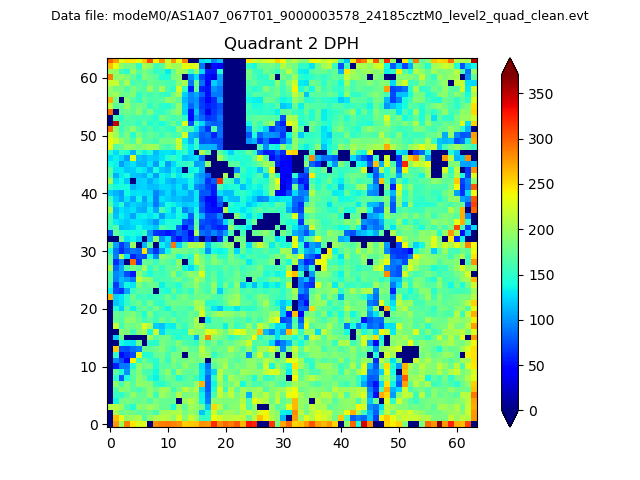 |
Quadrant C |
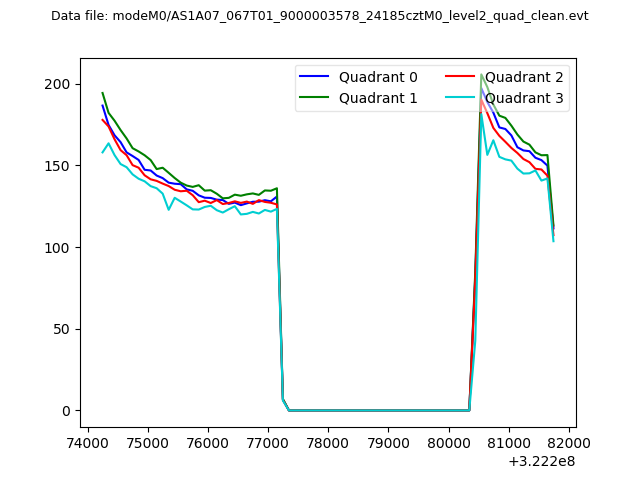
| Plot type | Count rate plots | Images |
|---|---|---|
| Comparison with Poisson distribution Blue bars denote a histogram of data divided into 1 sec bins. Red curve is a Poisson curve with rate = median count rate of data. |
 |
 |
| Quadrant-wise count rates Data is divided into 100 sec bins |
 |
|
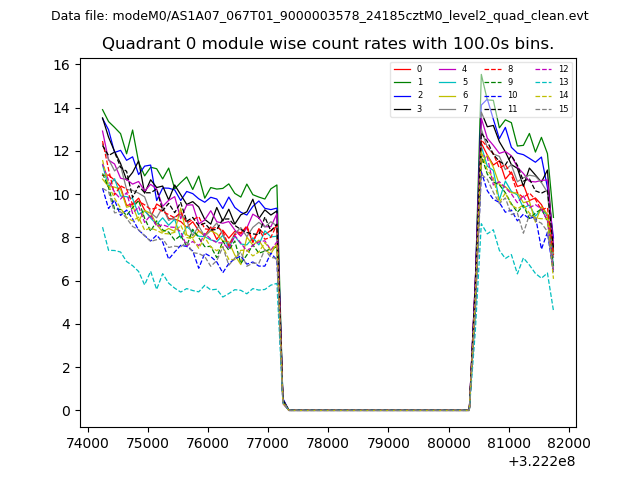
| Module-wise count rates for Quadrant A Data is divided into 100 sec bins |
 |
 |
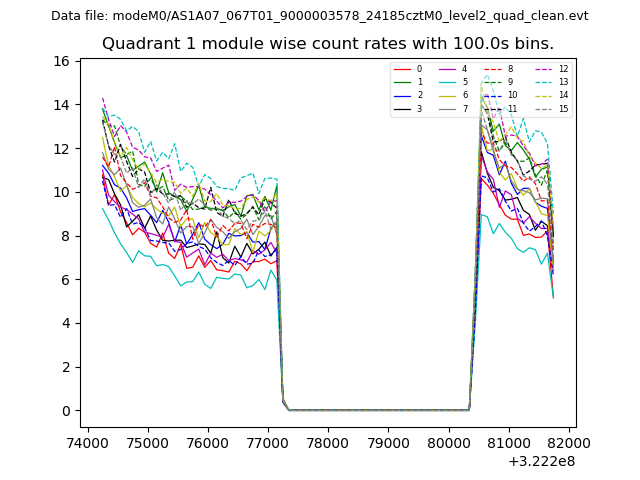
| Module-wise count rates for Quadrant B Data is divided into 100 sec bins |
 |
 |
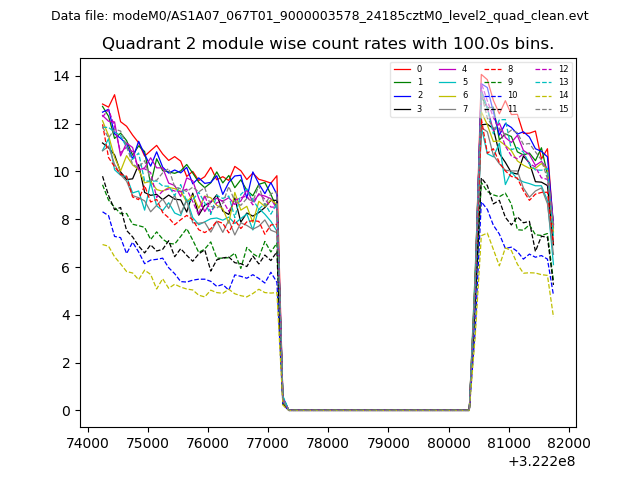
| Module-wise count rates for Quadrant C Data is divided into 100 sec bins |
 |
 |
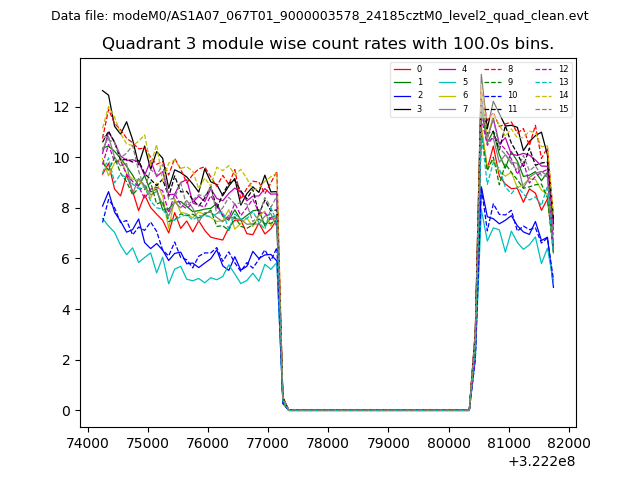
| Module-wise count rates for Quadrant D Data is divided into 100 sec bins |
 |
 |
| Parameter | Plot |
|---|---|
| CZT HV Monitor | 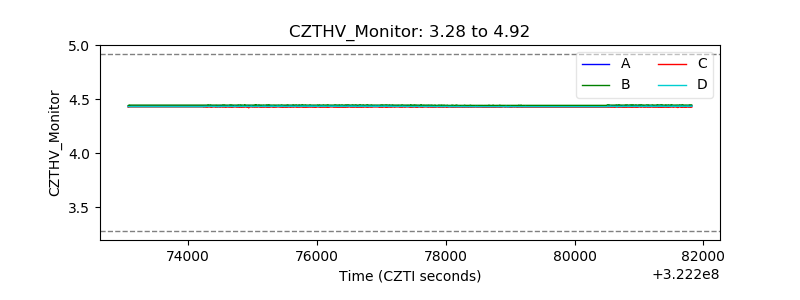 |
| D_VDD | 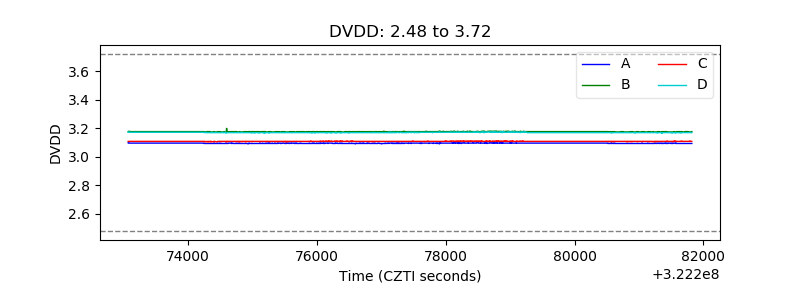 |
| Temperature 1 | 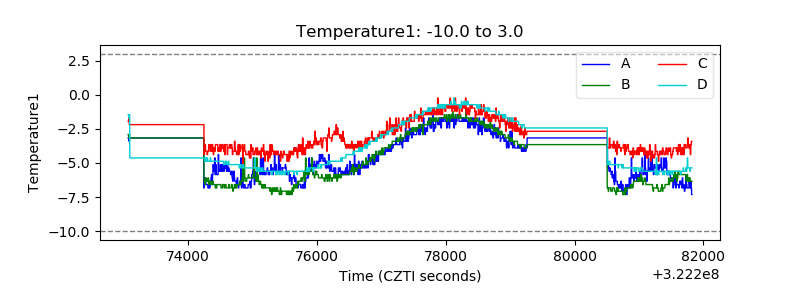 |
| Veto HV Monitor | 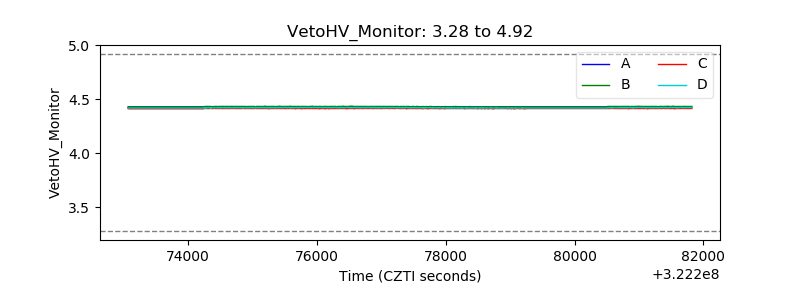 |
| Veto LLD | 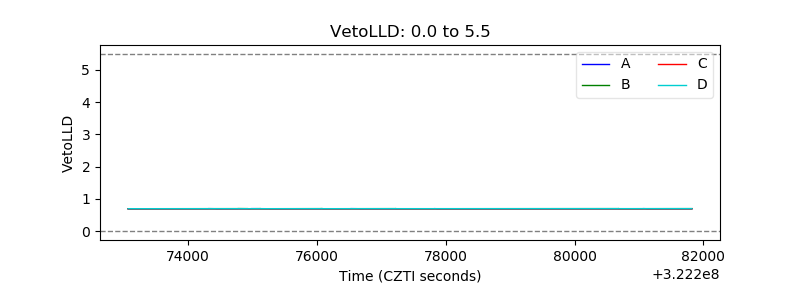 |
| Alpha Counter | 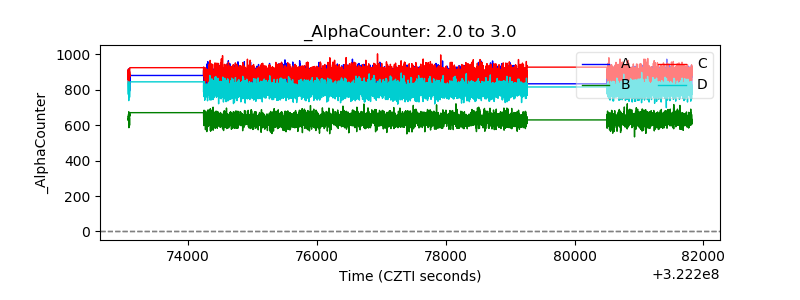 |
| _CPM_Rate | 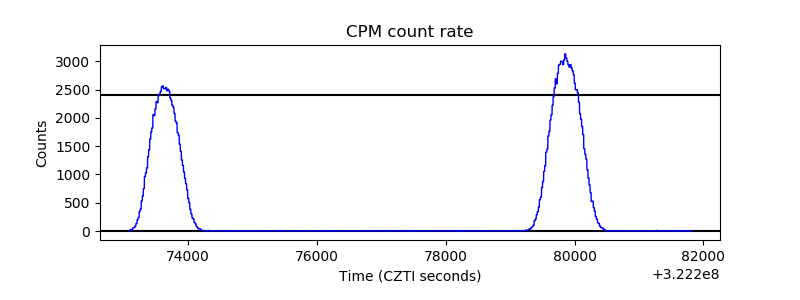 |
| CZT Counter | 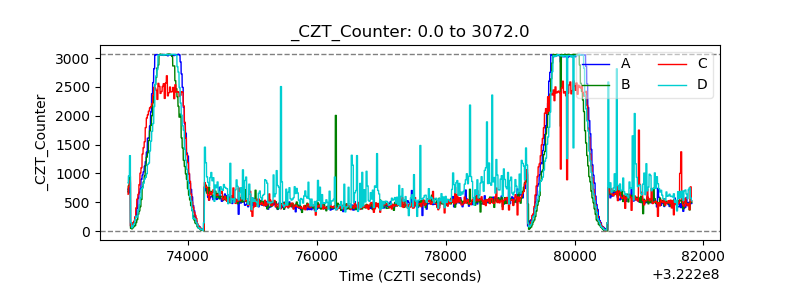 |
| +2.5 Volts monitor |  |
| +5 Volts monitor |  |
| _ROLL_ROT | 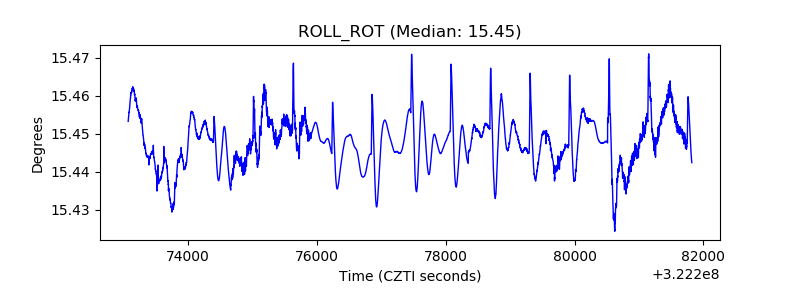 |
| _Roll_DEC | 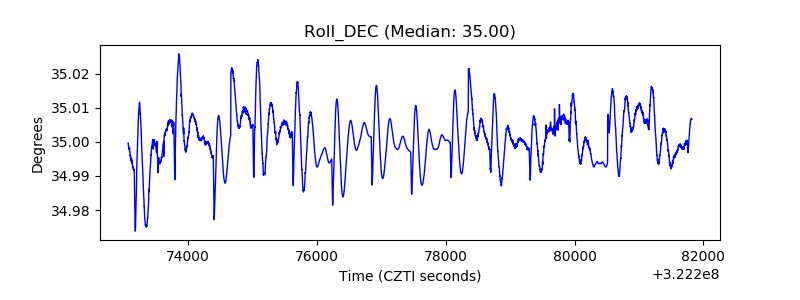 |
| _Roll_RA | 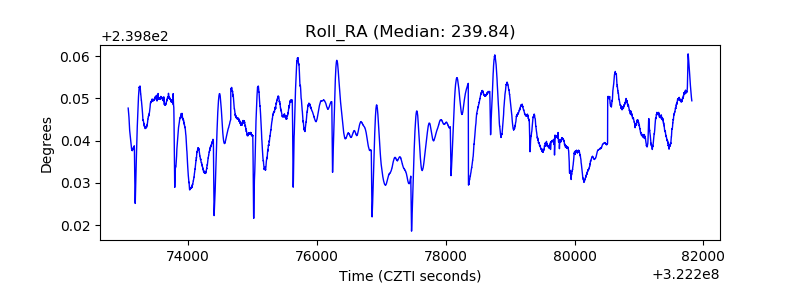 |
| Veto Counter | 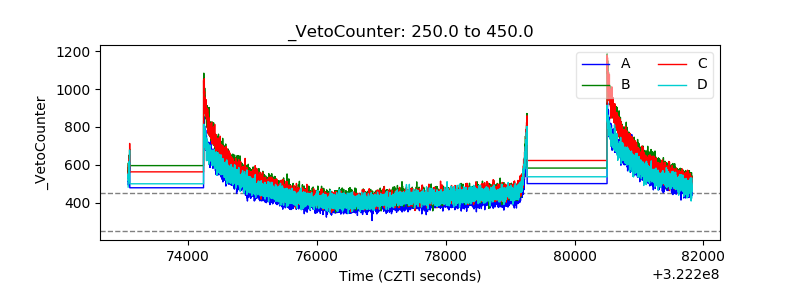 |