| Param | Original file | Final file |
|---|---|---|
| Filename | modeM0/AS1A07_067T01_9000003578_24187cztM0_level2.evt | modeM0/AS1A07_067T01_9000003578_24187cztM0_level2_quad_clean.evt |
| Size (bytes) | 591,474,240 | 103,222,080 |
| Size | 564.1 MB | 98.4 MB |
| Events in quadrant A | 3,312,675 | 692,114 |
| Events in quadrant B | 3,343,802 | 707,797 |
| Events in quadrant C | 3,554,604 | 662,123 |
| Events in quadrant D | 7,270,805 | 619,930 |
| Mode M9 | |||
|---|---|---|---|
| Quadrant | BADHDUFLAG | Total packets | Discarded packets |
| A | 0 | 14 | 0 |
| B | 0 | 14 | 0 |
| C | 0 | 14 | 0 |
| D | 0 | 14 | 0 |
| Mode SS | |||
|---|---|---|---|
| Quadrant | BADHDUFLAG | Total packets | Discarded packets |
| A | 0 | 128 | 0 |
| B | 0 | 128 | 0 |
| C | 0 | 128 | 0 |
| D | 0 | 128 | 0 |
| Mode M0 | |||
|---|---|---|---|
| Quadrant | BADHDUFLAG | Total packets | Discarded packets |
| A | 0 | 13408 | 1 |
| B | 0 | 13527 | 1 |
| C | 0 | 14277 | 1 |
| D | 0 | 25932 | 1 |
| Quadrant | Total seconds | Saturated seconds | Saturation percentage |
|---|---|---|---|
| A | 6366 | 35 | 0.549796% |
| B | 6367 | 52 | 0.816711% |
| C | 6367 | 100 | 1.570598% |
| D | 6367 | 1385 | 21.752788% |
Noise dominated data is calculated using 1-second bins in cleaned event files. If a bin has >2000 counts, and if more than 50% of those come from <1% of pixels, then it is considered to be noise-dominated and hence unusable.
| Quadrant | # 1 sec bins | Bins with >0 counts | Bins with >2000 counts | High rate bins dominated by noise | Noise dominated (total time) | Noise dominated (detector-on time) | Marked lightcurve |
|---|---|---|---|---|---|---|---|
| A | 7731 | 6367 | 0 | 0 | 0.00% | 0.00% | 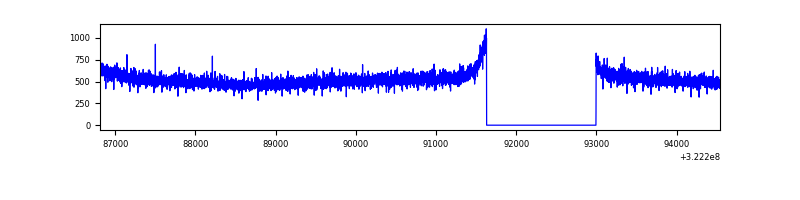 |
| B | 7732 | 6368 | 0 | 0 | 0.00% | 0.00% | 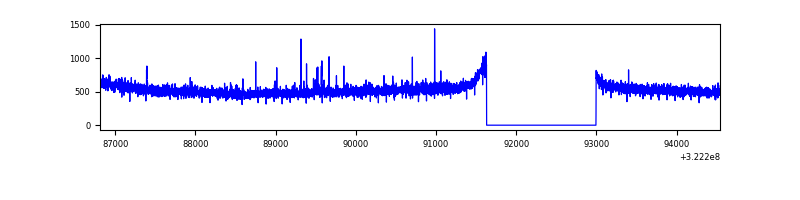 |
| C | 7732 | 6368 | 27 | 27 | 0.35% | 0.42% | 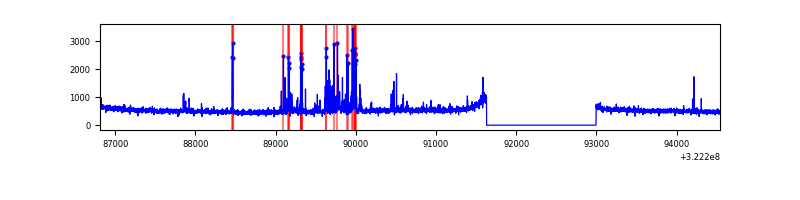 |
| D | 7732 | 6367 | 1111 | 1111 | 14.37% | 17.45% | 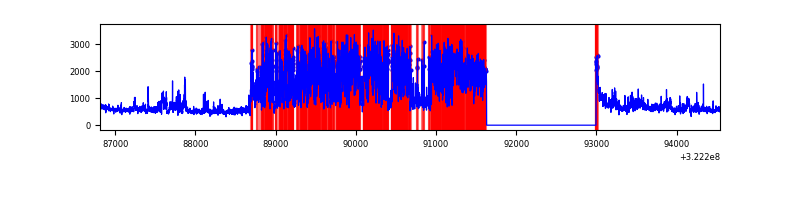 |
Top three noisy pixels from each quadrant. If the there are fewer than three noisy pixels in the level2.evt file, extra rows are filled as -1
| Pixel properties | Quadrant properties | ||||||
|---|---|---|---|---|---|---|---|
| Quadrant | DetID | PixID | Counts | Sigma | Mean | Median | Sigma |
| A | 13 | 254 | 9940 | 53.76 | 860 | 846 | 169.2 |
| A | 0 | 226 | 7386 | 38.66 | 860 | 846 | 169.2 |
| A | 3 | 137 | 6822 | 35.33 | 860 | 846 | 169.2 |
| B | 12 | 111 | 18313 | 110.36 | 850 | 833 | 158.4 |
| B | 11 | 111 | 16258 | 97.38 | 850 | 833 | 158.4 |
| B | 14 | 111 | 14361 | 85.41 | 850 | 833 | 158.4 |
| C | 2 | 16 | 263206 | 1420.72 | 806 | 811 | 184.7 |
| C | 14 | 238 | 132364 | 712.28 | 806 | 811 | 184.7 |
| C | 7 | 247 | 17644 | 91.14 | 806 | 811 | 184.7 |
| D | 7 | 238 | 3978648 | 21353.61 | 767 | 746 | 186.3 |
| D | 12 | 233 | 168001 | 897.83 | 767 | 746 | 186.3 |
| D | 8 | 195 | 124009 | 661.68 | 767 | 746 | 186.3 |
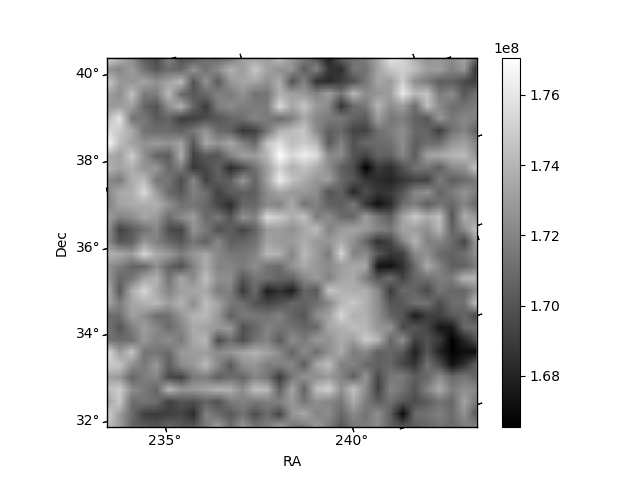
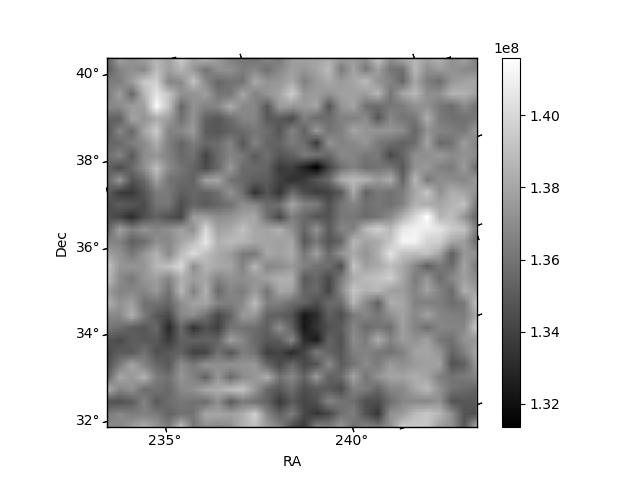
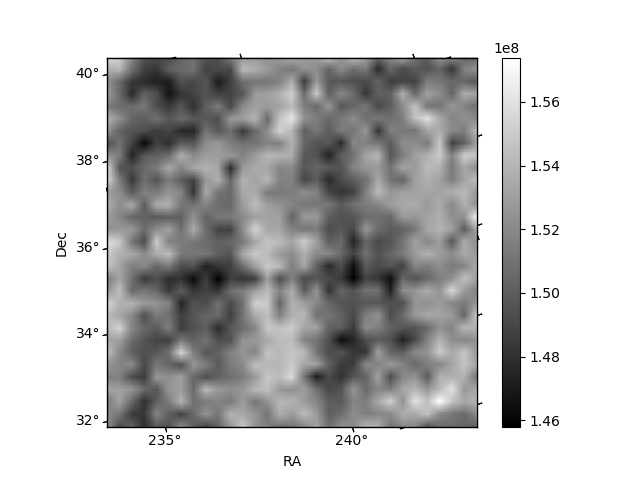
Histogram calculated using DETX and DETY for each event in the final _common_clean file
| Quadrant A | 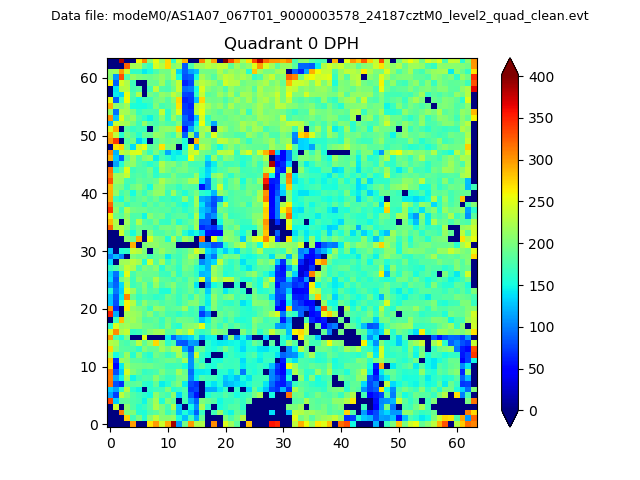 |
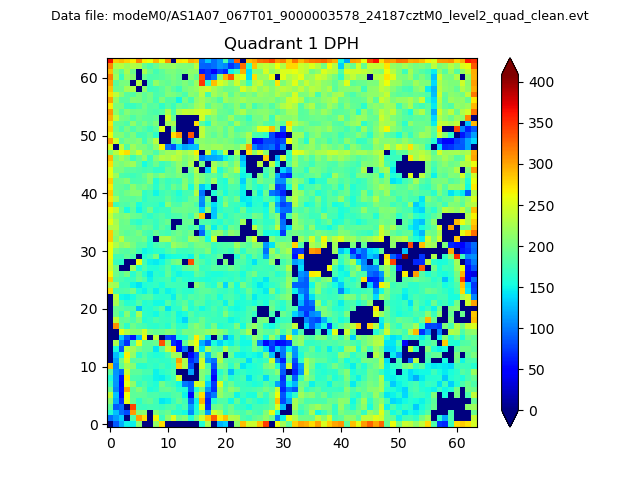 |
Quadrant B |
|---|---|---|---|
| Quadrant D | 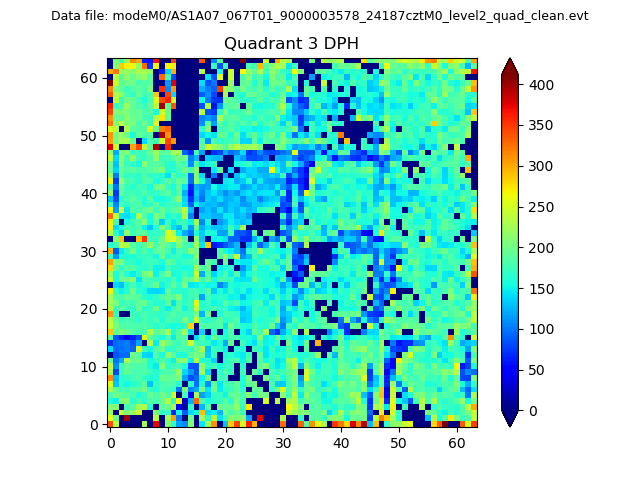 |
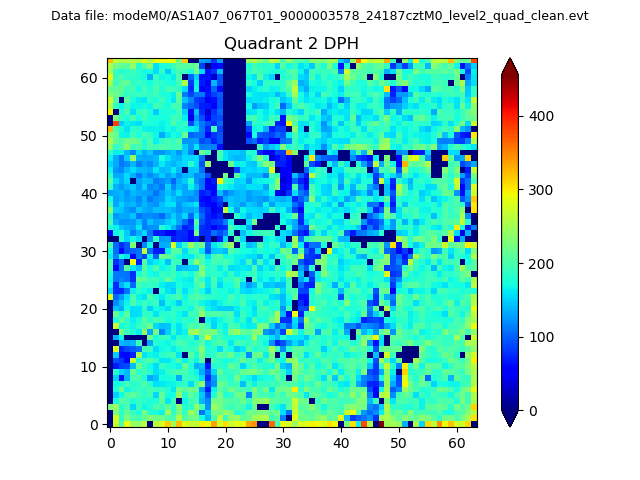 |
Quadrant C |
| Plot type | Count rate plots | Images |
|---|---|---|
| Comparison with Poisson distribution Blue bars denote a histogram of data divided into 1 sec bins. Red curve is a Poisson curve with rate = median count rate of data. |
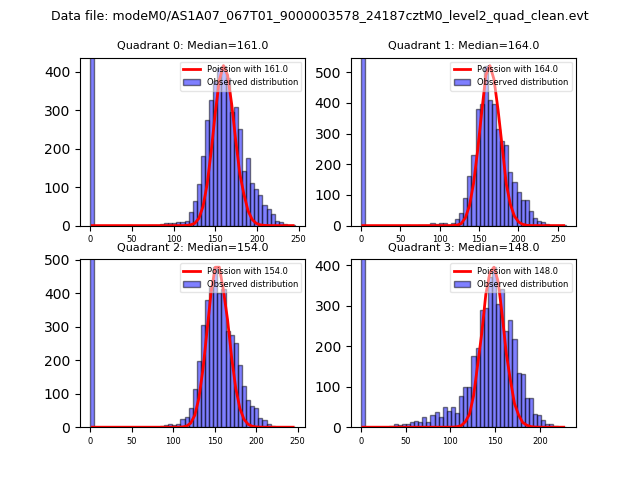 |
 |
| Quadrant-wise count rates Data is divided into 100 sec bins |
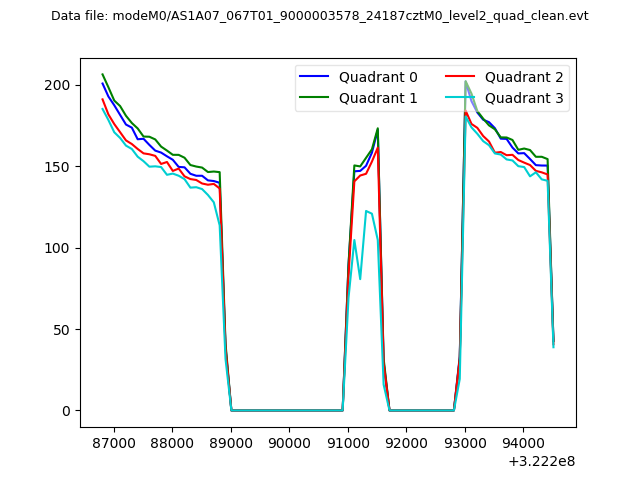 |
|
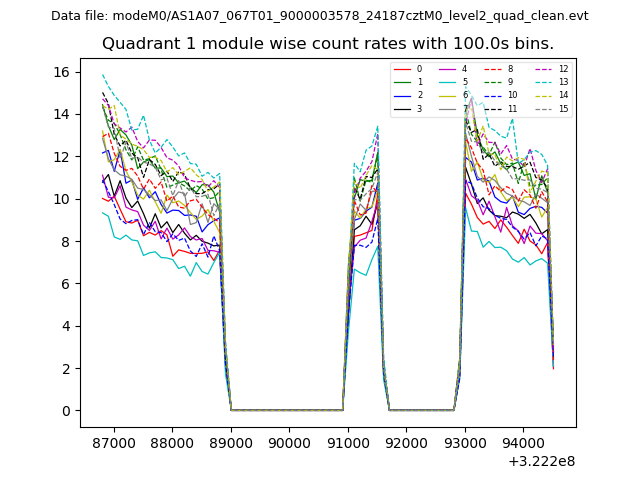
| Module-wise count rates for Quadrant A Data is divided into 100 sec bins |
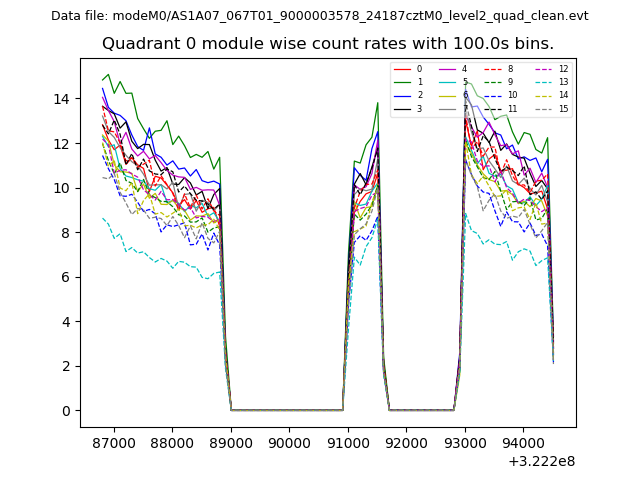 |
 |
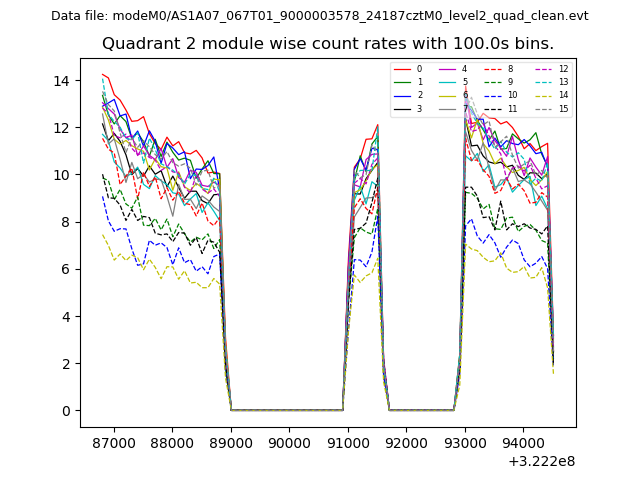
| Module-wise count rates for Quadrant B Data is divided into 100 sec bins |
 |
 |
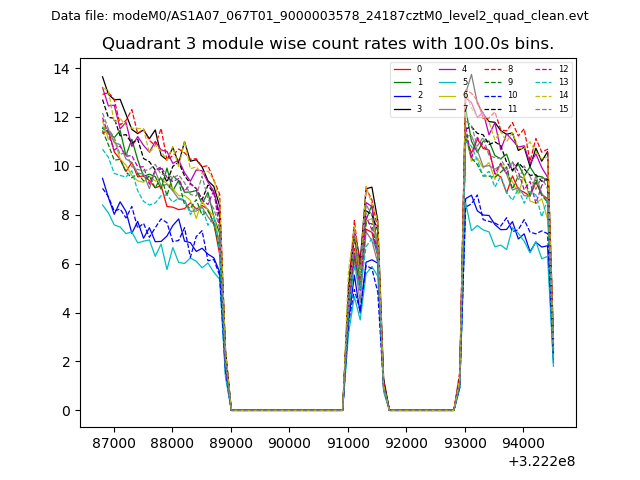
| Module-wise count rates for Quadrant C Data is divided into 100 sec bins |
 |
 |
| Module-wise count rates for Quadrant D Data is divided into 100 sec bins |
 |
 |
| Parameter | Plot |
|---|---|
| CZT HV Monitor | 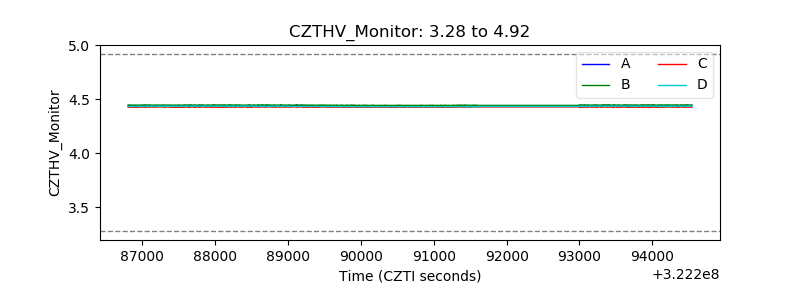 |
| D_VDD | 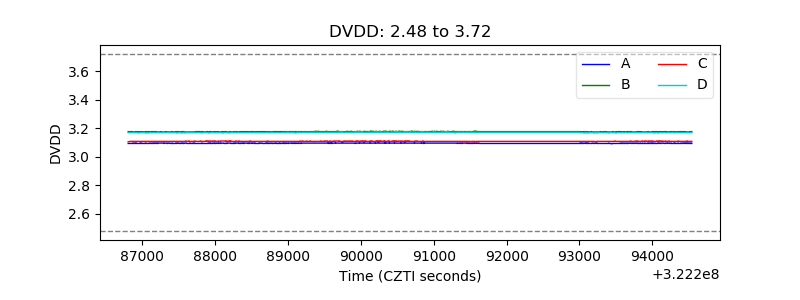 |
| Temperature 1 | 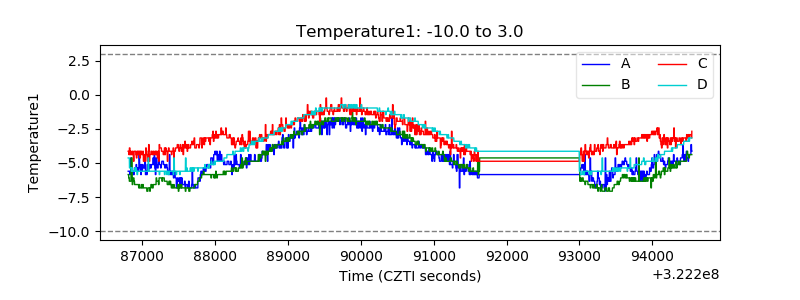 |
| Veto HV Monitor | 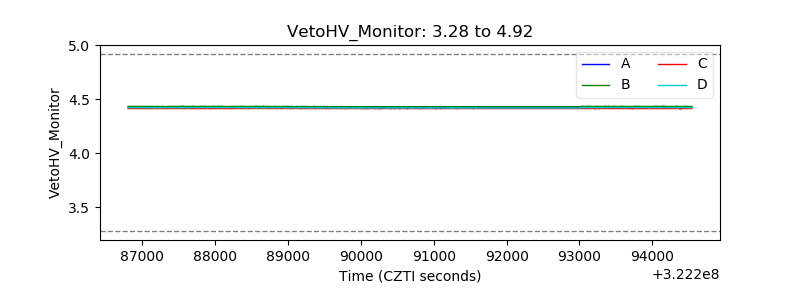 |
| Veto LLD | 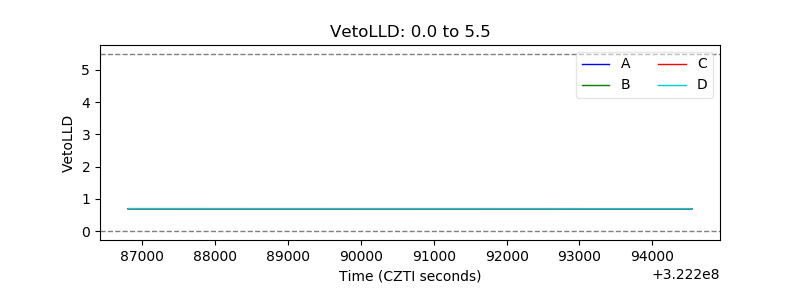 |
| Alpha Counter | 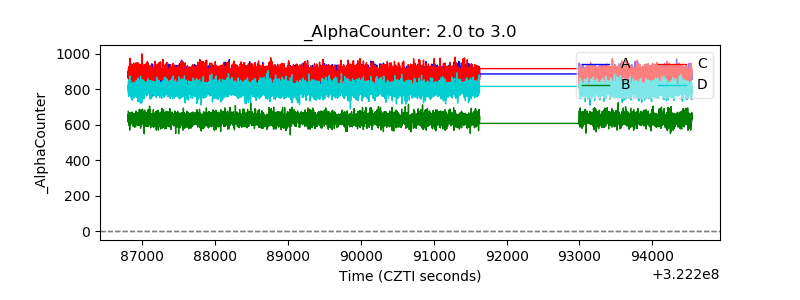 |
| _CPM_Rate | 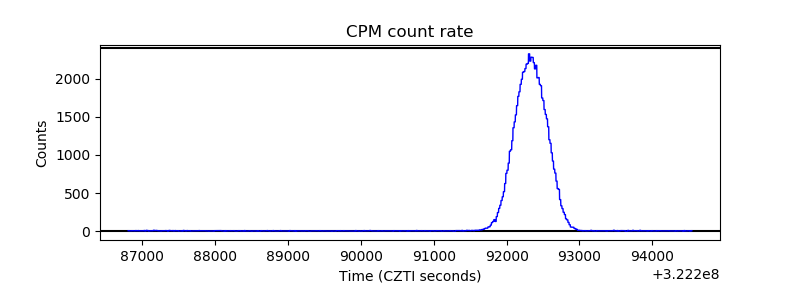 |
| CZT Counter |  |
| +2.5 Volts monitor |  |
| +5 Volts monitor |  |
| _ROLL_ROT | 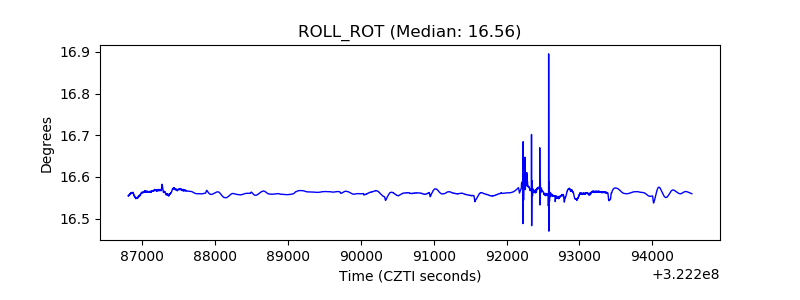 |
| _Roll_DEC | 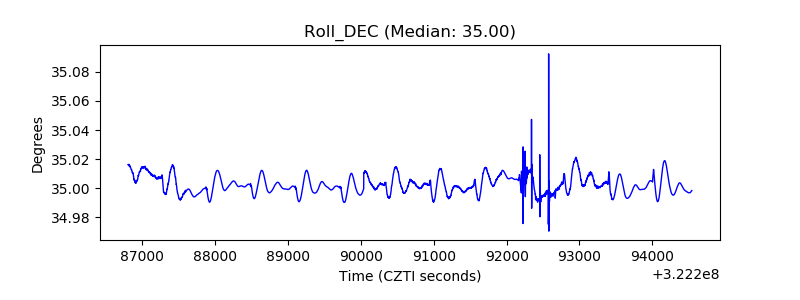 |
| _Roll_RA |  |
| Veto Counter | 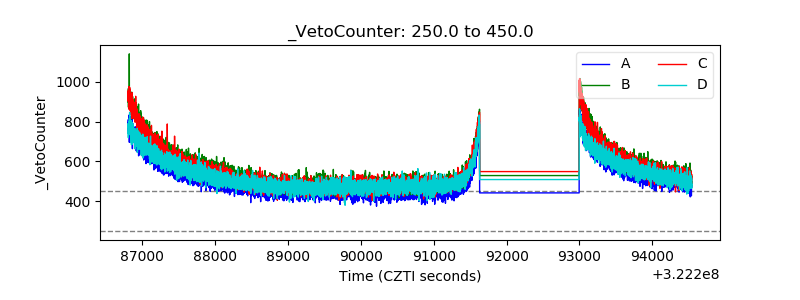 |