| Param | Original file | Final file |
|---|---|---|
| Filename | modeM0/AS1A07_067T01_9000003578_24188cztM0_level2.evt | modeM0/AS1A07_067T01_9000003578_24188cztM0_level2_quad_clean.evt |
| Size (bytes) | 460,149,120 | 88,482,240 |
| Size | 438.8 MB | 84.4 MB |
| Events in quadrant A | 3,112,755 | 577,094 |
| Events in quadrant B | 3,052,684 | 589,847 |
| Events in quadrant C | 3,078,467 | 556,211 |
| Events in quadrant D | 4,293,807 | 546,808 |
| Mode M9 | |||
|---|---|---|---|
| Quadrant | BADHDUFLAG | Total packets | Discarded packets |
| A | 0 | 13 | 0 |
| B | 0 | 13 | 0 |
| C | 0 | 13 | 0 |
| D | 0 | 13 | 0 |
| Mode SS | |||
|---|---|---|---|
| Quadrant | BADHDUFLAG | Total packets | Discarded packets |
| A | 0 | 120 | 0 |
| B | 0 | 120 | 0 |
| C | 0 | 120 | 0 |
| D | 0 | 120 | 0 |
| Mode M0 | |||
|---|---|---|---|
| Quadrant | BADHDUFLAG | Total packets | Discarded packets |
| A | 0 | 12438 | 1 |
| B | 0 | 12288 | 1 |
| C | 0 | 12488 | 1 |
| D | 0 | 16565 | 1 |
| Quadrant | Total seconds | Saturated seconds | Saturation percentage |
|---|---|---|---|
| A | 5858 | 103 | 1.758279% |
| B | 5859 | 69 | 1.177675% |
| C | 5859 | 99 | 1.689708% |
| D | 5859 | 305 | 5.205666% |
Noise dominated data is calculated using 1-second bins in cleaned event files. If a bin has >2000 counts, and if more than 50% of those come from <1% of pixels, then it is considered to be noise-dominated and hence unusable.
| Quadrant | # 1 sec bins | Bins with >0 counts | Bins with >2000 counts | High rate bins dominated by noise | Noise dominated (total time) | Noise dominated (detector-on time) | Marked lightcurve |
|---|---|---|---|---|---|---|---|
| A | 7178 | 5859 | 30 | 30 | 0.42% | 0.51% | 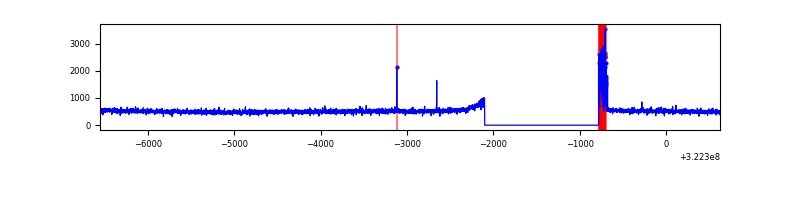 |
| B | 7179 | 5859 | 11 | 11 | 0.15% | 0.19% | 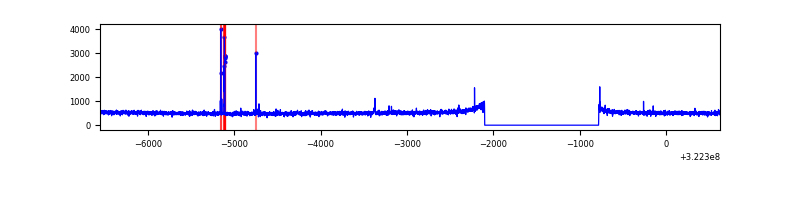 |
| C | 7179 | 5860 | 5 | 5 | 0.07% | 0.09% | 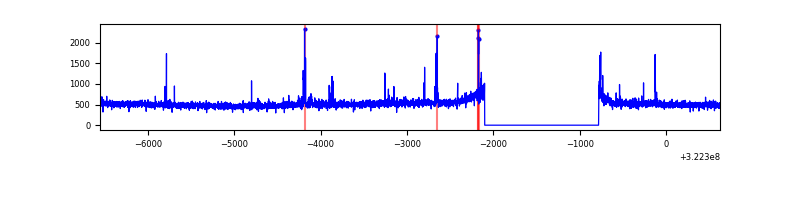 |
| D | 7179 | 5859 | 224 | 224 | 3.12% | 3.82% | 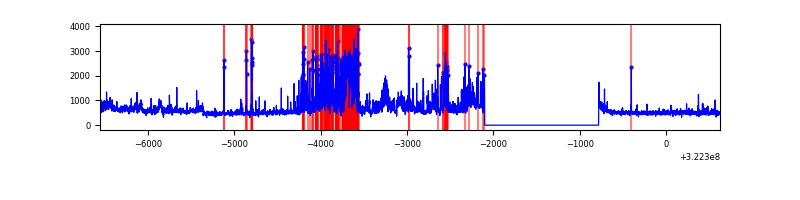 |
Top three noisy pixels from each quadrant. If the there are fewer than three noisy pixels in the level2.evt file, extra rows are filled as -1
| Pixel properties | Quadrant properties | ||||||
|---|---|---|---|---|---|---|---|
| Quadrant | DetID | PixID | Counts | Sigma | Mean | Median | Sigma |
| A | 6 | 16 | 118885 | 768.67 | 777 | 764 | 153.7 |
| A | 13 | 254 | 8847 | 52.6 | 777 | 764 | 153.7 |
| A | 0 | 226 | 6951 | 40.26 | 777 | 764 | 153.7 |
| B | 4 | 216 | 38076 | 261.52 | 767 | 751 | 142.7 |
| B | 12 | 111 | 16807 | 112.5 | 767 | 751 | 142.7 |
| B | 11 | 111 | 14993 | 99.79 | 767 | 751 | 142.7 |
| C | 14 | 238 | 121302 | 721.28 | 730 | 737 | 167.2 |
| C | 9 | 54 | 74826 | 443.24 | 730 | 737 | 167.2 |
| C | 2 | 16 | 22104 | 127.83 | 730 | 737 | 167.2 |
| D | 12 | 233 | 705078 | 3960.45 | 738 | 718 | 177.8 |
| D | 7 | 238 | 581521 | 3265.72 | 738 | 718 | 177.8 |
| D | 1 | 52 | 124868 | 698.07 | 738 | 718 | 177.8 |
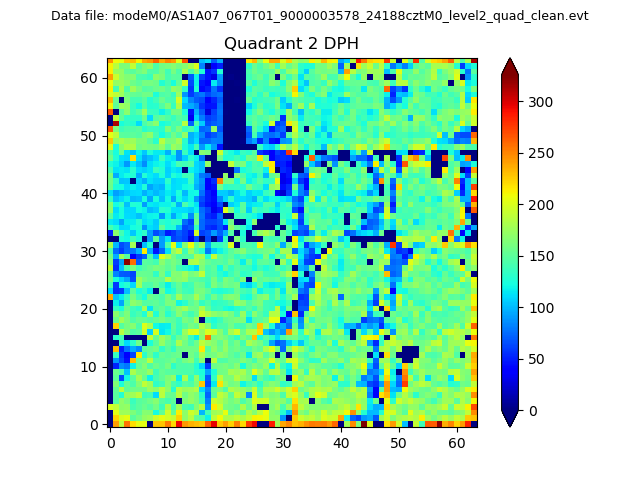
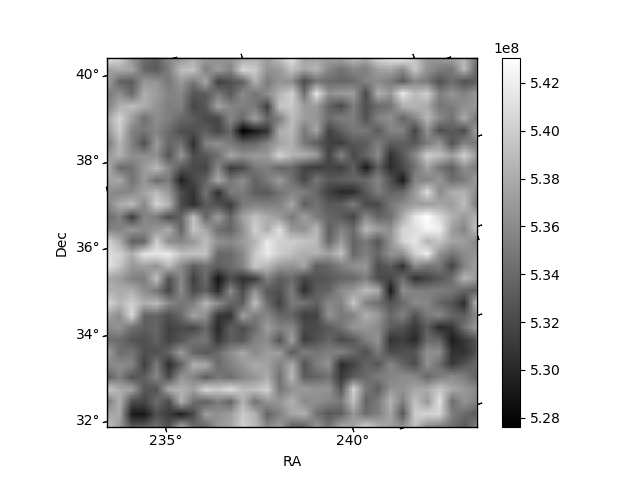
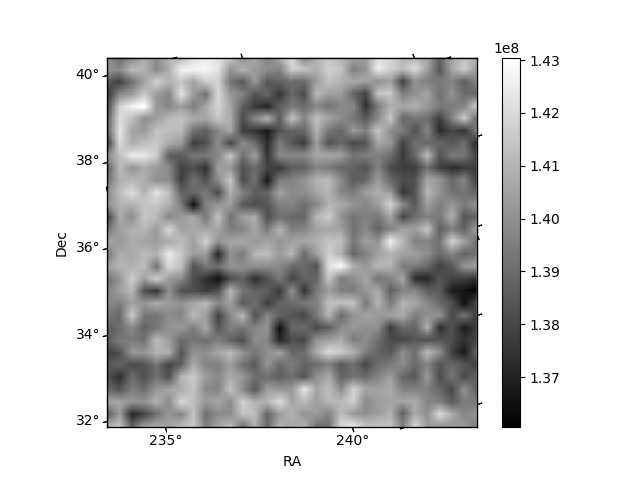
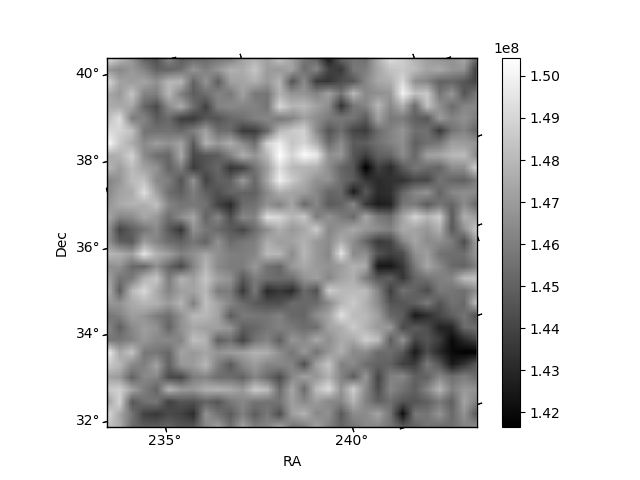
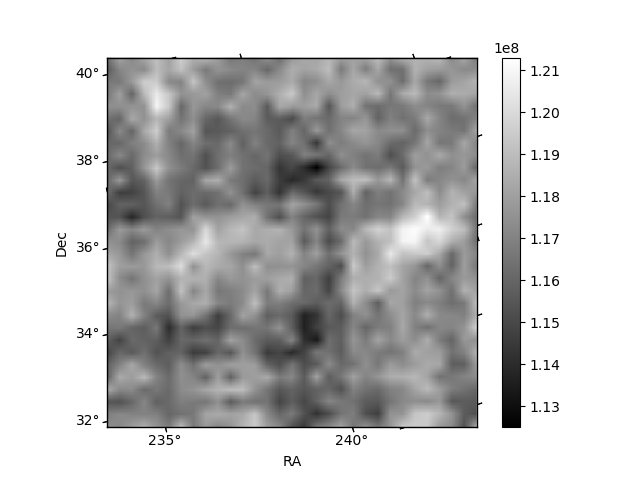
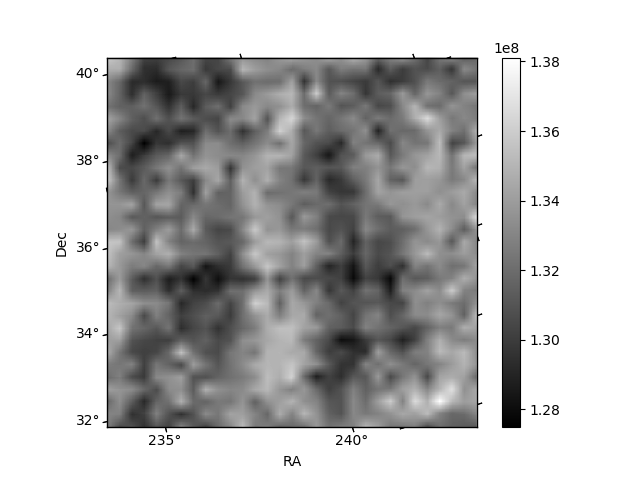
Histogram calculated using DETX and DETY for each event in the final _common_clean file
| Quadrant A | 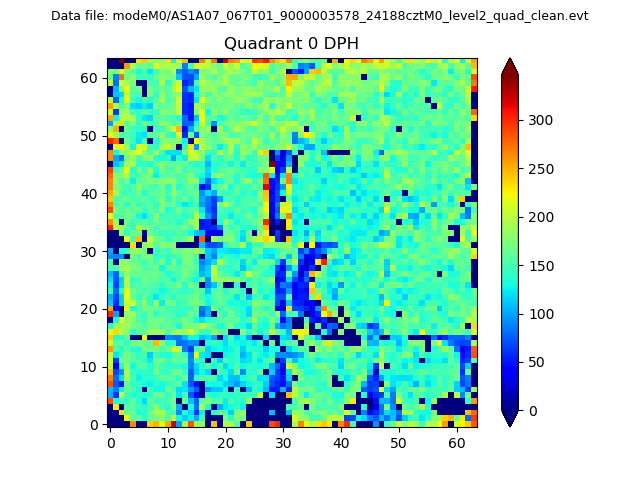 |
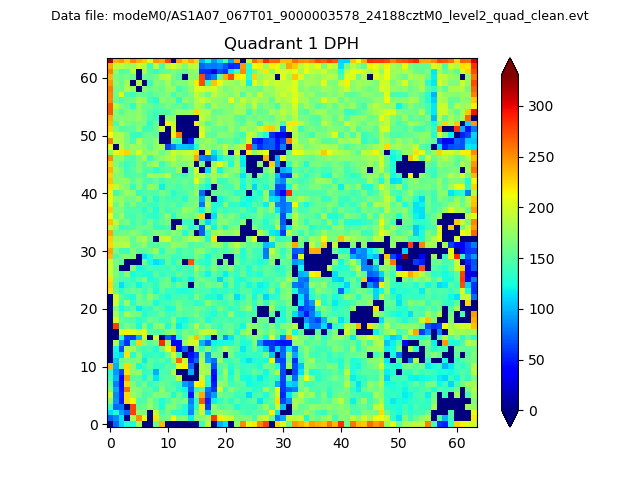 |
Quadrant B |
|---|---|---|---|
| Quadrant D | 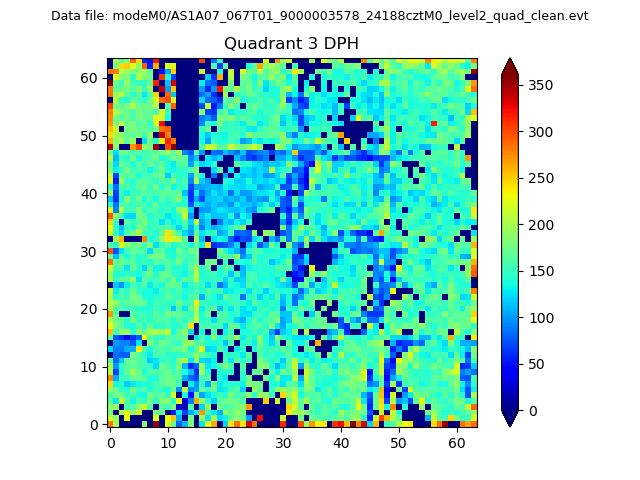 |
 |
Quadrant C |
| Plot type | Count rate plots | Images |
|---|---|---|
| Comparison with Poisson distribution Blue bars denote a histogram of data divided into 1 sec bins. Red curve is a Poisson curve with rate = median count rate of data. |
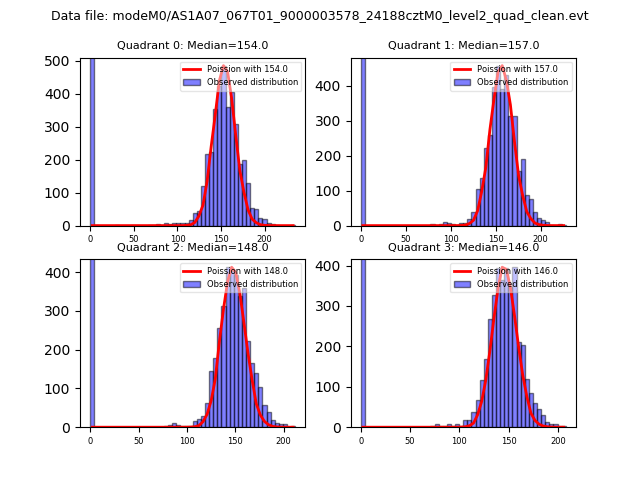 |
 |
| Quadrant-wise count rates Data is divided into 100 sec bins |
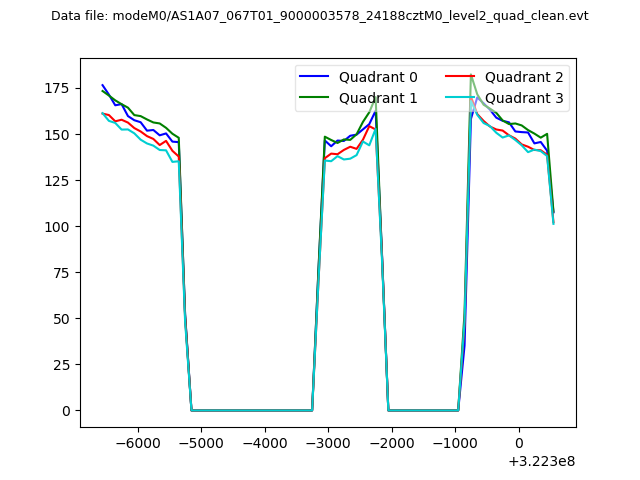 |
|
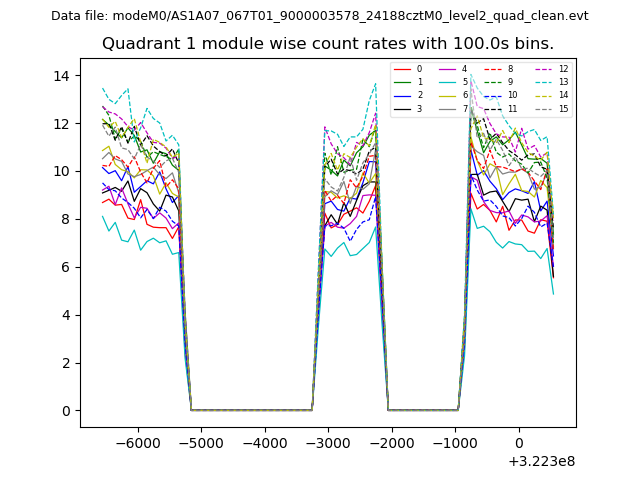
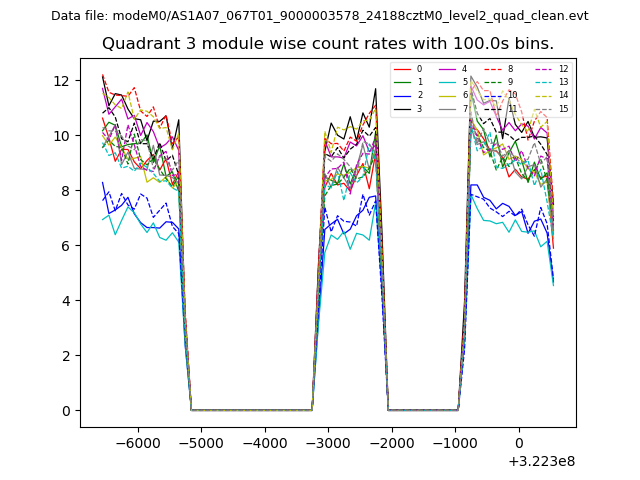
| Module-wise count rates for Quadrant A Data is divided into 100 sec bins |
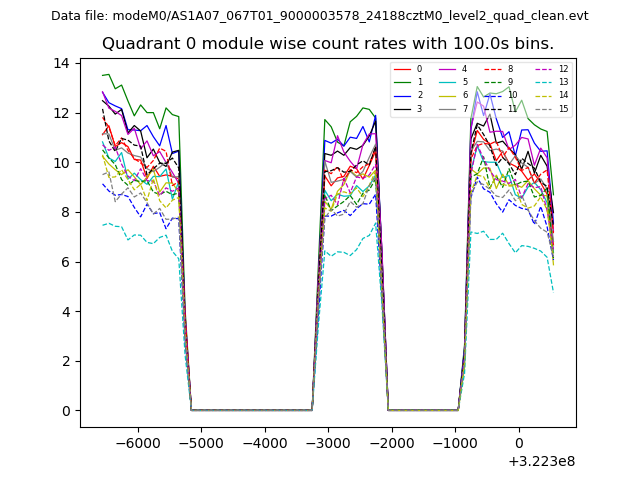 |
 |
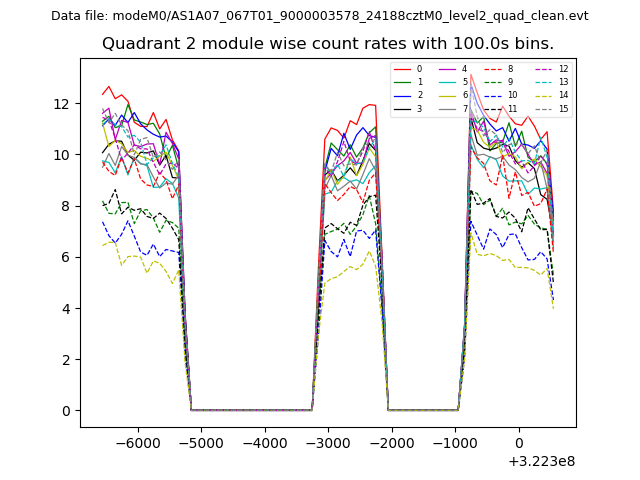
| Module-wise count rates for Quadrant B Data is divided into 100 sec bins |
 |
 |
| Module-wise count rates for Quadrant C Data is divided into 100 sec bins |
 |
 |
| Module-wise count rates for Quadrant D Data is divided into 100 sec bins |
 |
 |
| Parameter | Plot |
|---|---|
| CZT HV Monitor | 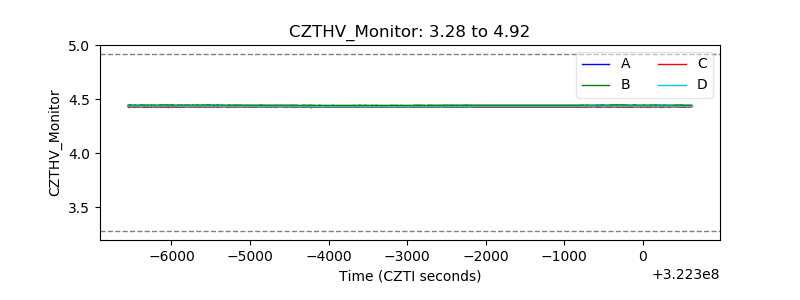 |
| D_VDD | 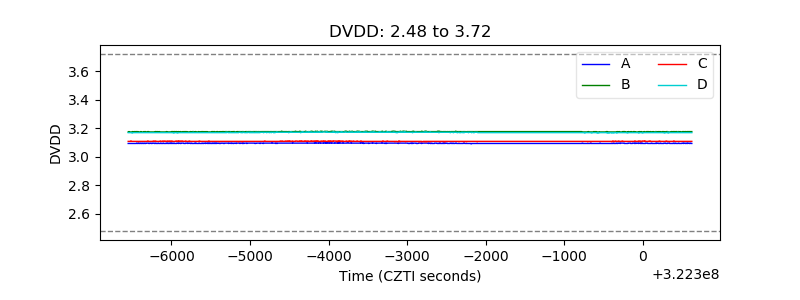 |
| Temperature 1 | 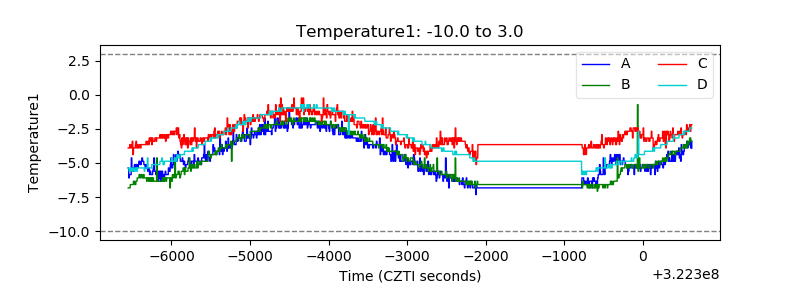 |
| Veto HV Monitor | 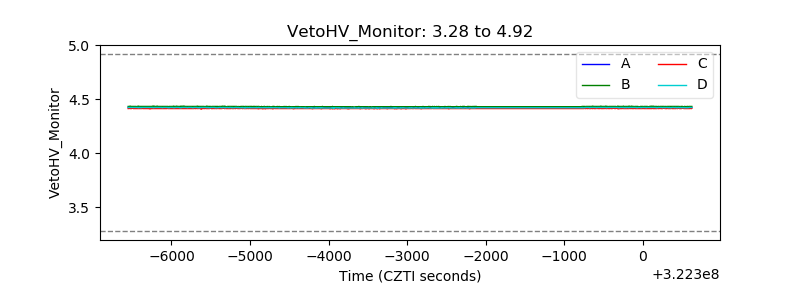 |
| Veto LLD | 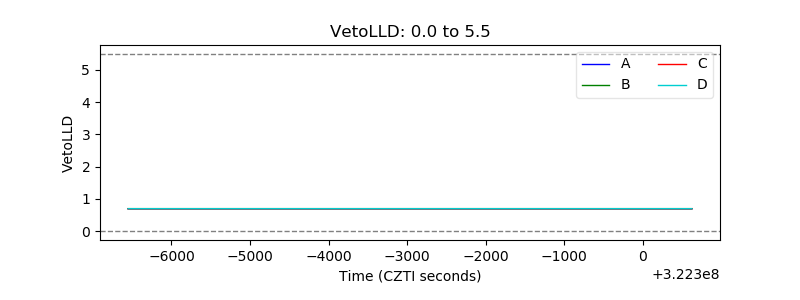 |
| Alpha Counter | 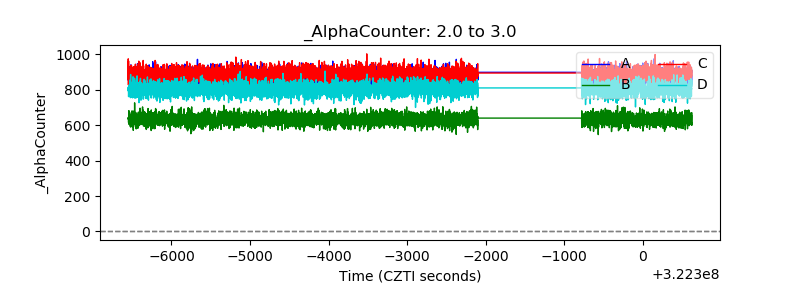 |
| _CPM_Rate | 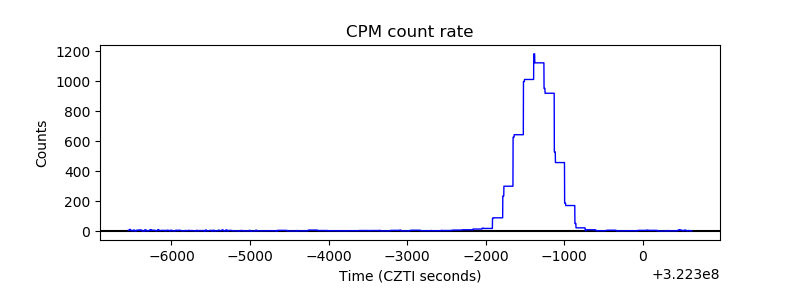 |
| CZT Counter | 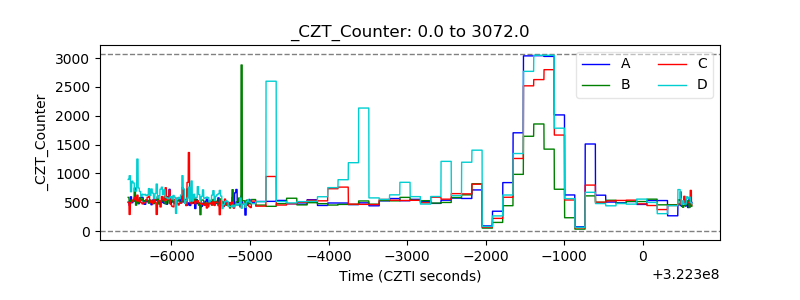 |
| +2.5 Volts monitor |  |
| +5 Volts monitor |  |
| _ROLL_ROT | 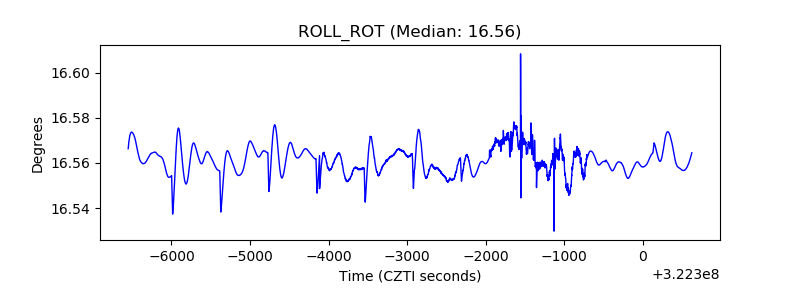 |
| _Roll_DEC | 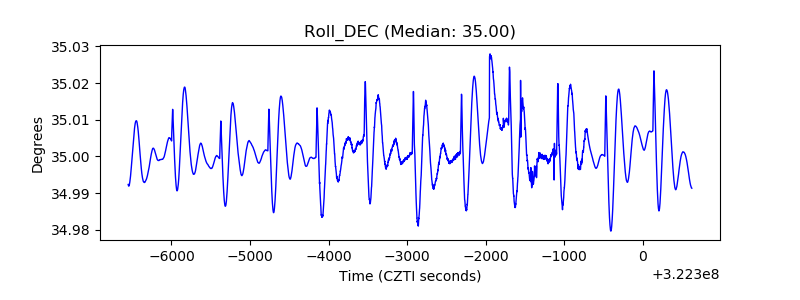 |
| _Roll_RA | 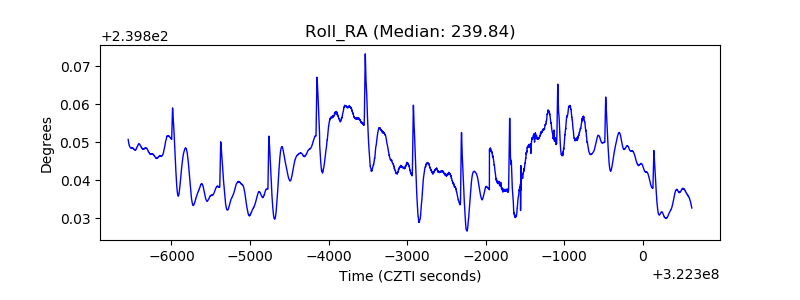 |
| Veto Counter | 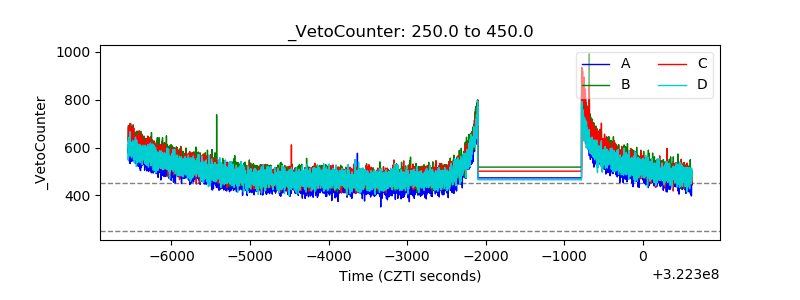 |