| Param | Original file | Final file |
|---|---|---|
| Filename | modeM0/AS1A07_067T01_9000003578_24189cztM0_level2.evt | modeM0/AS1A07_067T01_9000003578_24189cztM0_level2_quad_clean.evt |
| Size (bytes) | 484,104,960 | 92,842,560 |
| Size | 461.7 MB | 88.5 MB |
| Events in quadrant A | 3,409,631 | 595,017 |
| Events in quadrant B | 3,347,470 | 608,123 |
| Events in quadrant C | 3,366,765 | 578,317 |
| Events in quadrant D | 4,091,166 | 571,989 |
| Mode M9 | |||
|---|---|---|---|
| Quadrant | BADHDUFLAG | Total packets | Discarded packets |
| A | 0 | 11 | 0 |
| B | 0 | 11 | 0 |
| C | 0 | 11 | 0 |
| D | 0 | 11 | 0 |
| Mode SS | |||
|---|---|---|---|
| Quadrant | BADHDUFLAG | Total packets | Discarded packets |
| A | 0 | 132 | 0 |
| B | 0 | 132 | 0 |
| C | 0 | 132 | 0 |
| D | 0 | 132 | 0 |
| Mode M0 | |||
|---|---|---|---|
| Quadrant | BADHDUFLAG | Total packets | Discarded packets |
| A | 0 | 13879 | 2 |
| B | 0 | 13669 | 2 |
| C | 0 | 13796 | 2 |
| D | 0 | 16108 | 2 |
| Quadrant | Total seconds | Saturated seconds | Saturation percentage |
|---|---|---|---|
| A | 6573 | 151 | 2.297277% |
| B | 6574 | 108 | 1.642835% |
| C | 6574 | 138 | 2.099179% |
| D | 6574 | 207 | 3.148768% |
Noise dominated data is calculated using 1-second bins in cleaned event files. If a bin has >2000 counts, and if more than 50% of those come from <1% of pixels, then it is considered to be noise-dominated and hence unusable.
| Quadrant | # 1 sec bins | Bins with >0 counts | Bins with >2000 counts | High rate bins dominated by noise | Noise dominated (total time) | Noise dominated (detector-on time) | Marked lightcurve |
|---|---|---|---|---|---|---|---|
| A | 7653 | 6573 | 29 | 29 | 0.38% | 0.44% | 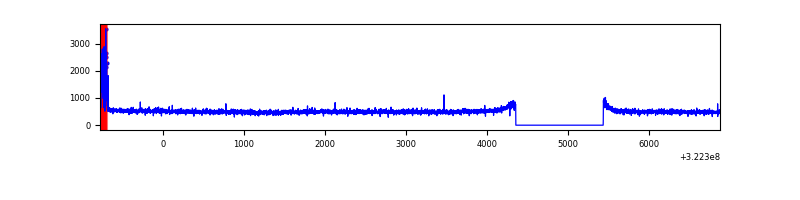 |
| B | 7654 | 6575 | 1 | 1 | 0.01% | 0.02% | 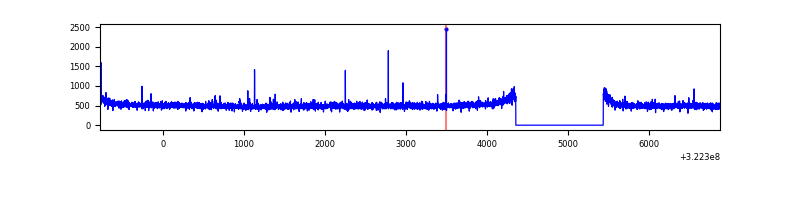 |
| C | 7654 | 6574 | 5 | 5 | 0.07% | 0.08% | 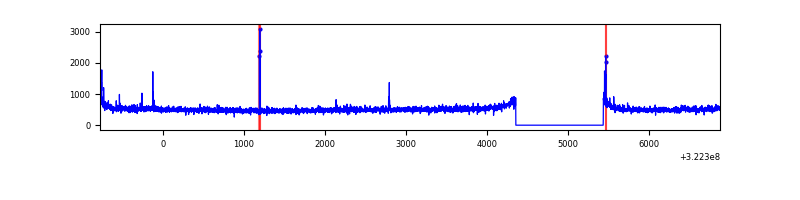 |
| D | 7654 | 6575 | 127 | 127 | 1.66% | 1.93% | 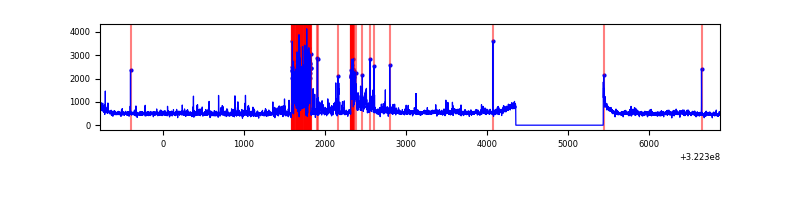 |
Top three noisy pixels from each quadrant. If the there are fewer than three noisy pixels in the level2.evt file, extra rows are filled as -1
| Pixel properties | Quadrant properties | ||||||
|---|---|---|---|---|---|---|---|
| Quadrant | DetID | PixID | Counts | Sigma | Mean | Median | Sigma |
| A | 6 | 16 | 111791 | 649.09 | 856 | 840 | 170.9 |
| A | 13 | 254 | 9915 | 53.09 | 856 | 840 | 170.9 |
| A | 0 | 226 | 7578 | 39.42 | 856 | 840 | 170.9 |
| B | 12 | 111 | 18972 | 113.21 | 847 | 826 | 160.3 |
| B | 11 | 111 | 17004 | 100.93 | 847 | 826 | 160.3 |
| B | 14 | 111 | 15265 | 90.08 | 847 | 826 | 160.3 |
| C | 14 | 238 | 132496 | 703.63 | 807 | 812 | 187.2 |
| C | 2 | 16 | 38763 | 202.78 | 807 | 812 | 187.2 |
| C | 7 | 247 | 25412 | 131.44 | 807 | 812 | 187.2 |
| D | 1 | 52 | 661491 | 3326.9 | 825 | 800 | 198.6 |
| D | 8 | 195 | 160231 | 802.81 | 825 | 800 | 198.6 |
| D | 7 | 238 | 118041 | 590.36 | 825 | 800 | 198.6 |
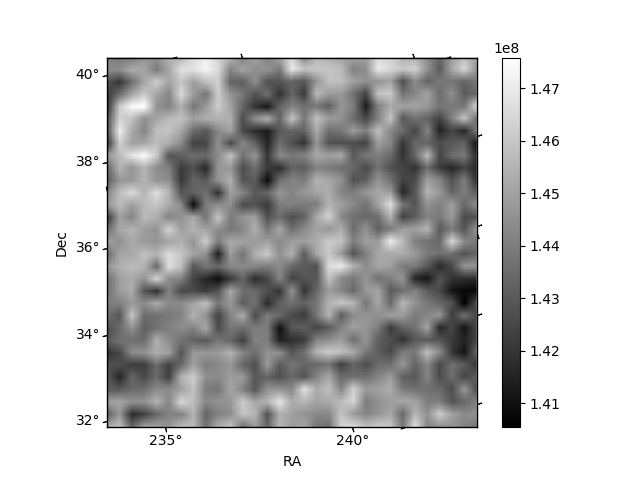
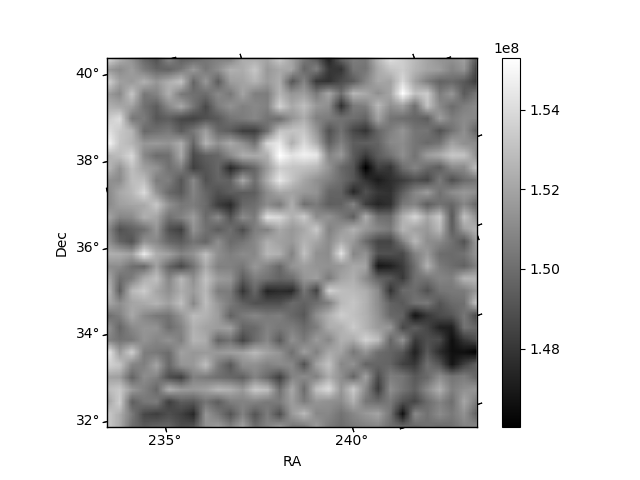
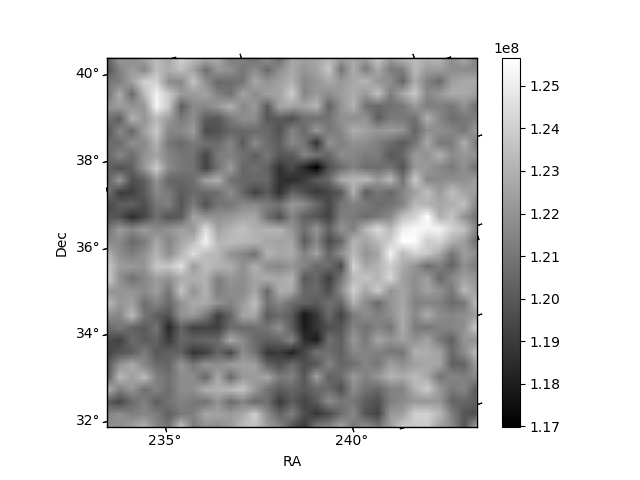
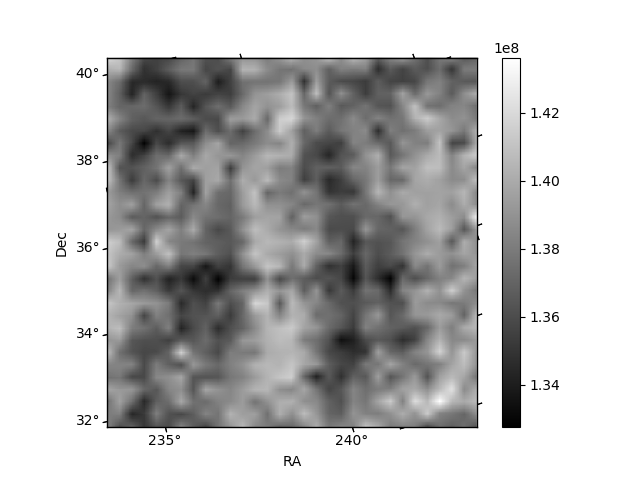
Histogram calculated using DETX and DETY for each event in the final _common_clean file
| Quadrant A |  |
 |
Quadrant B |
|---|---|---|---|
| Quadrant D |  |
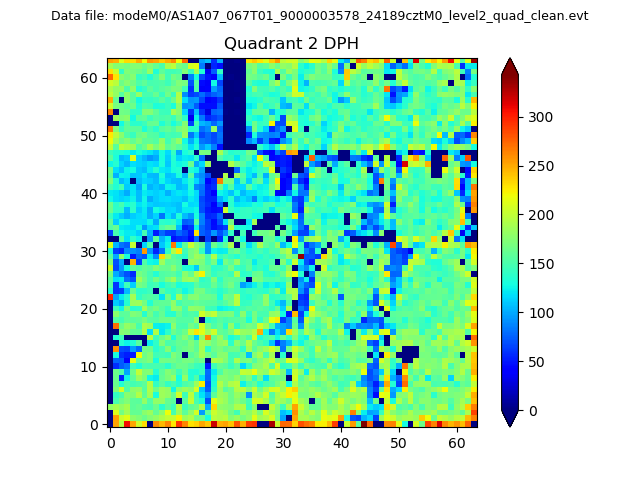 |
Quadrant C |
| Plot type | Count rate plots | Images |
|---|---|---|
| Comparison with Poisson distribution Blue bars denote a histogram of data divided into 1 sec bins. Red curve is a Poisson curve with rate = median count rate of data. |
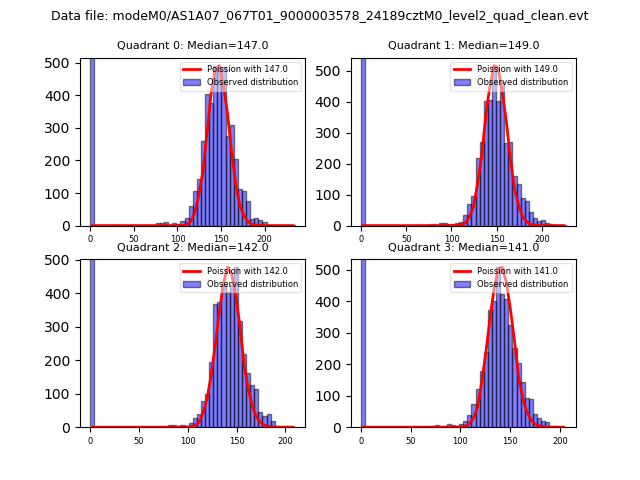 |
 |
| Quadrant-wise count rates Data is divided into 100 sec bins |
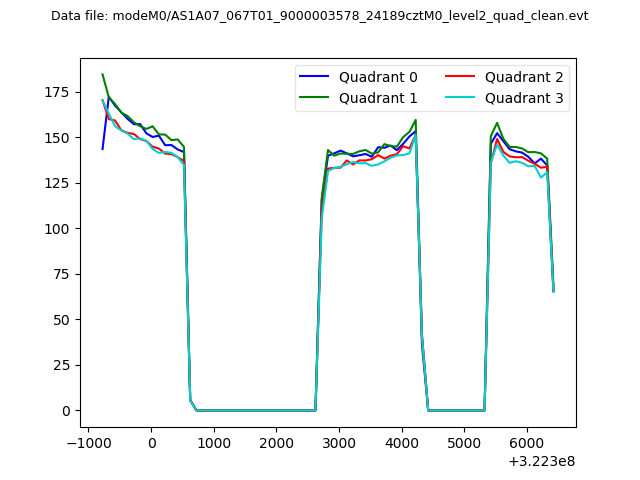 |
|
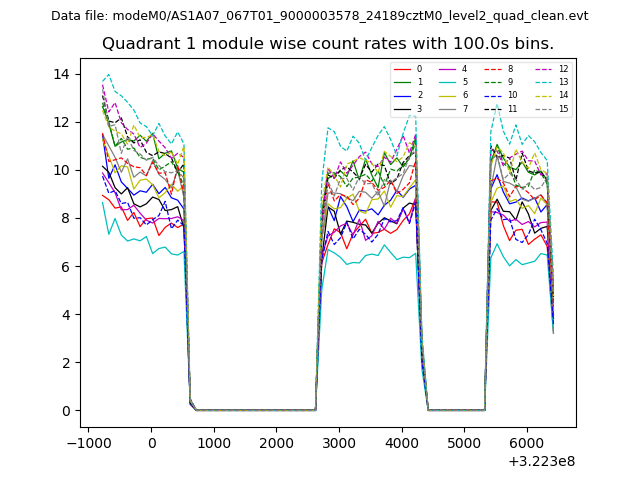
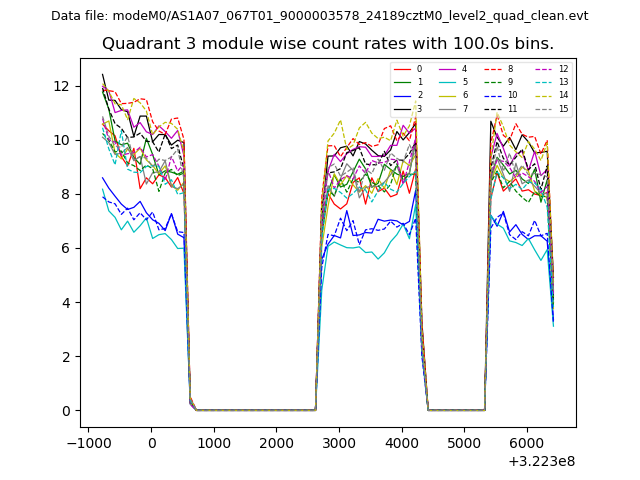
| Module-wise count rates for Quadrant A Data is divided into 100 sec bins |
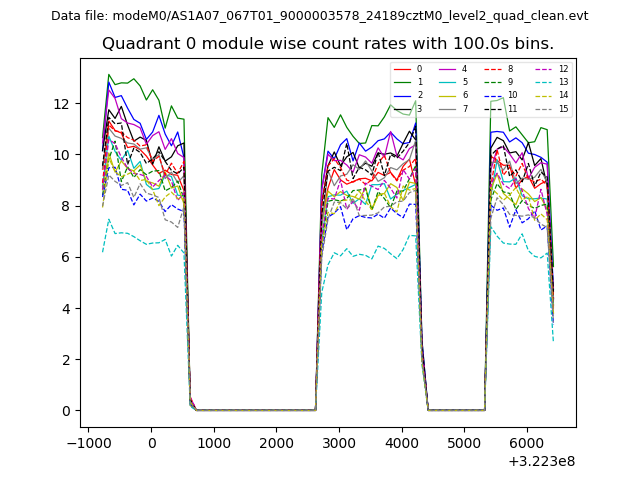 |
 |
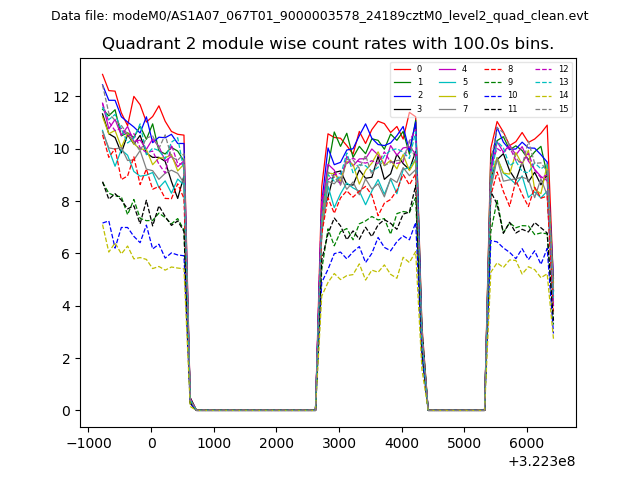
| Module-wise count rates for Quadrant B Data is divided into 100 sec bins |
 |
 |
| Module-wise count rates for Quadrant C Data is divided into 100 sec bins |
 |
 |
| Module-wise count rates for Quadrant D Data is divided into 100 sec bins |
 |
 |
| Parameter | Plot |
|---|---|
| CZT HV Monitor | 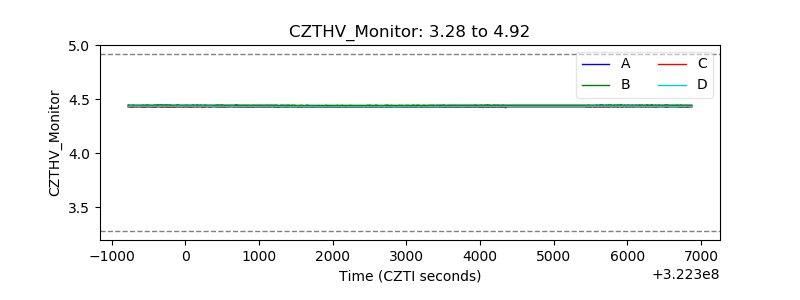 |
| D_VDD | 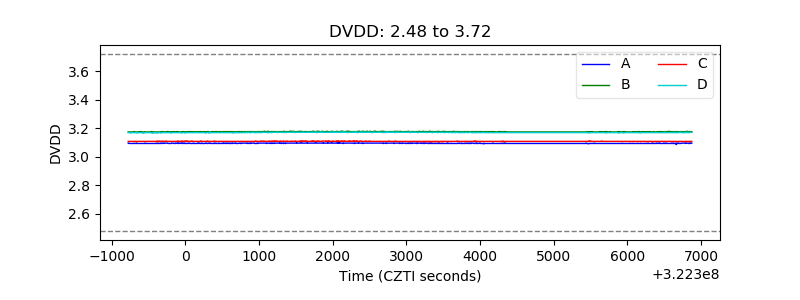 |
| Temperature 1 | 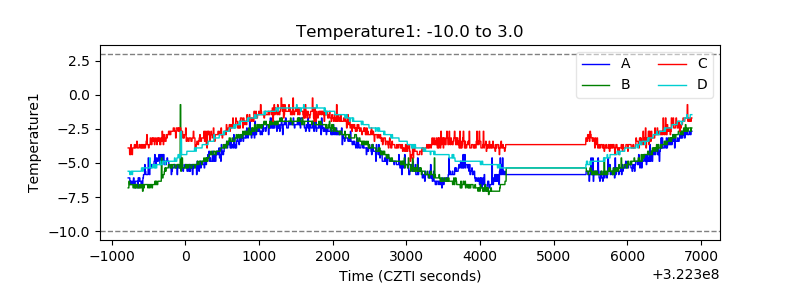 |
| Veto HV Monitor | 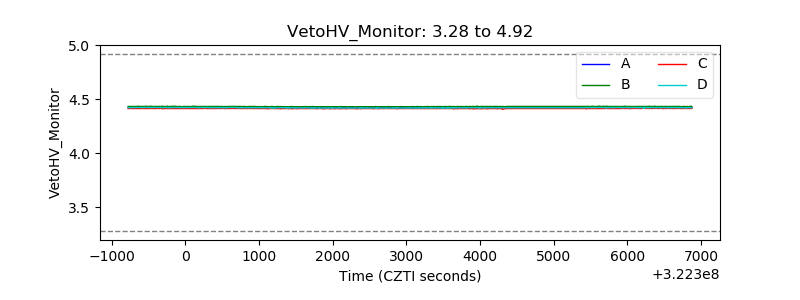 |
| Veto LLD |  |
| Alpha Counter | 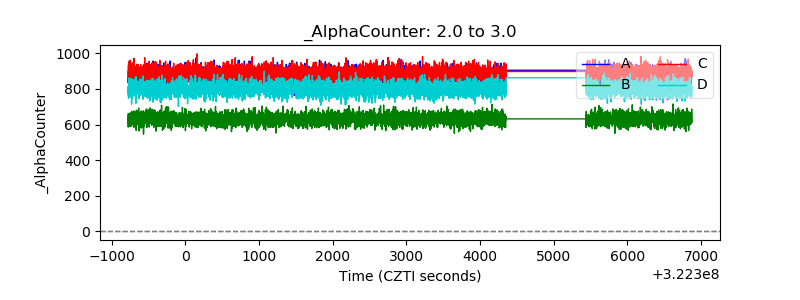 |
| _CPM_Rate | 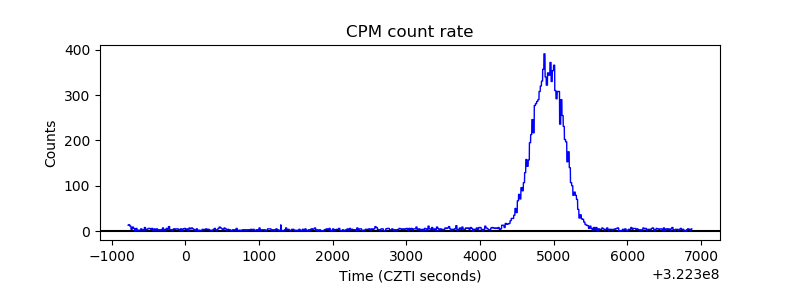 |
| CZT Counter | 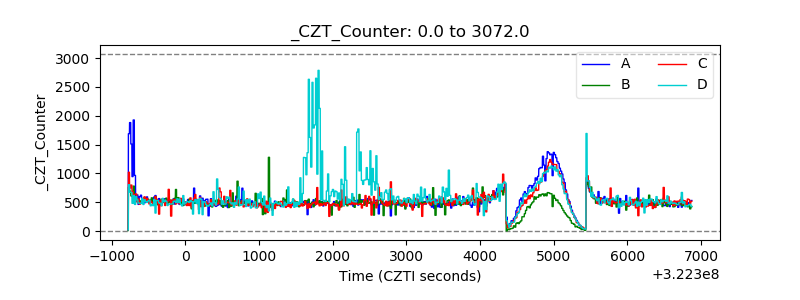 |
| +2.5 Volts monitor |  |
| +5 Volts monitor | 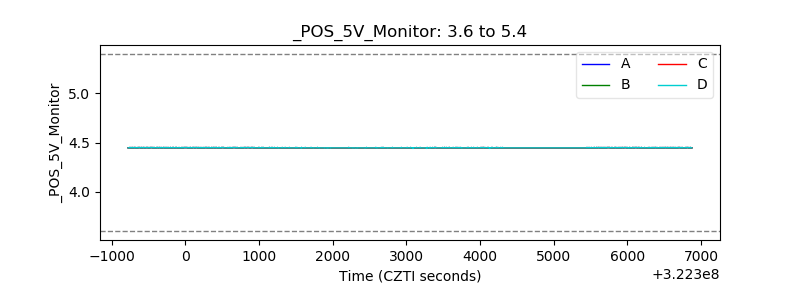 |
| _ROLL_ROT | 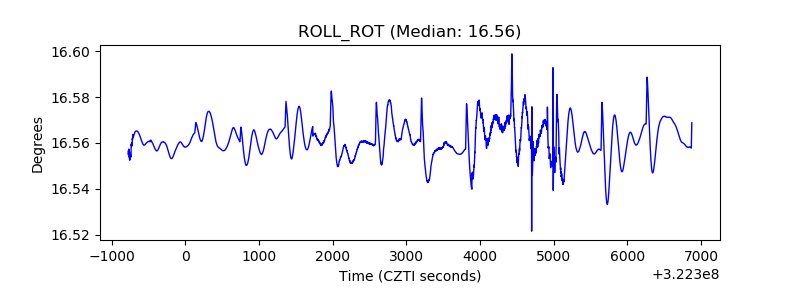 |
| _Roll_DEC | 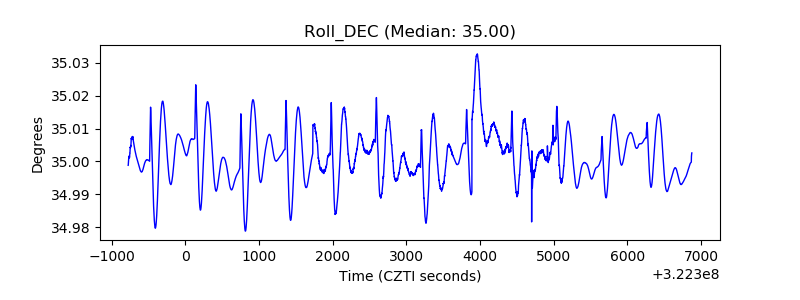 |
| _Roll_RA |  |
| Veto Counter | 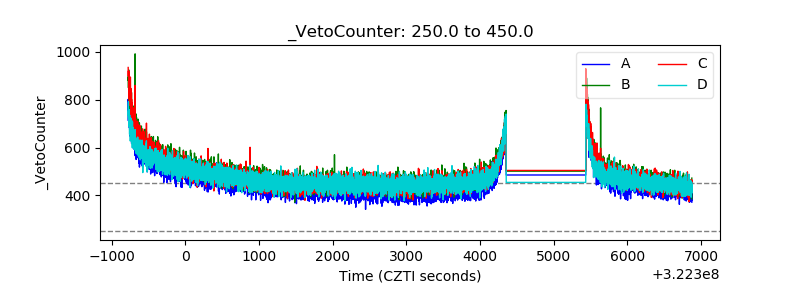 |