| Param | Original file | Final file |
|---|---|---|
| Filename | modeM0/AS1A07_067T01_9000003578_24190cztM0_level2.evt | modeM0/AS1A07_067T01_9000003578_24190cztM0_level2_quad_clean.evt |
| Size (bytes) | 541,630,080 | 89,565,120 |
| Size | 516.5 MB | 85.4 MB |
| Events in quadrant A | 3,657,851 | 559,581 |
| Events in quadrant B | 3,527,661 | 571,471 |
| Events in quadrant C | 4,574,769 | 543,291 |
| Events in quadrant D | 4,155,656 | 537,749 |
| Mode M9 | |||
|---|---|---|---|
| Quadrant | BADHDUFLAG | Total packets | Discarded packets |
| A | 0 | 8 | 0 |
| B | 0 | 9 | 0 |
| C | 0 | 9 | 0 |
| D | 0 | 9 | 0 |
| Mode SS | |||
|---|---|---|---|
| Quadrant | BADHDUFLAG | Total packets | Discarded packets |
| A | 0 | 146 | 0 |
| B | 0 | 146 | 0 |
| C | 0 | 146 | 0 |
| D | 0 | 146 | 0 |
| Mode M0 | |||
|---|---|---|---|
| Quadrant | BADHDUFLAG | Total packets | Discarded packets |
| A | 0 | 15259 | 2 |
| B | 0 | 14815 | 2 |
| C | 0 | 17814 | 2 |
| D | 0 | 16649 | 2 |
| Quadrant | Total seconds | Saturated seconds | Saturation percentage |
|---|---|---|---|
| A | 7179 | 134 | 1.866555% |
| B | 7179 | 144 | 2.005850% |
| C | 7179 | 411 | 5.725031% |
| D | 7178 | 176 | 2.451936% |
Noise dominated data is calculated using 1-second bins in cleaned event files. If a bin has >2000 counts, and if more than 50% of those come from <1% of pixels, then it is considered to be noise-dominated and hence unusable.
| Quadrant | # 1 sec bins | Bins with >0 counts | Bins with >2000 counts | High rate bins dominated by noise | Noise dominated (total time) | Noise dominated (detector-on time) | Marked lightcurve |
|---|---|---|---|---|---|---|---|
| A | 7869 | 7179 | 0 | 0 | 0.00% | 0.00% | 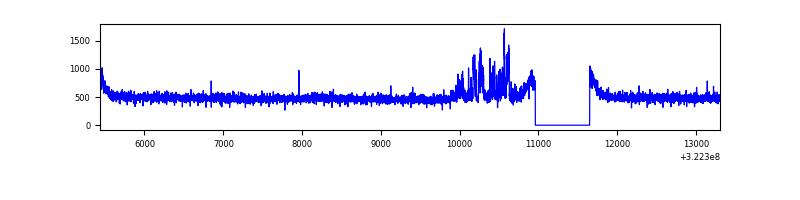 |
| B | 7869 | 7179 | 0 | 0 | 0.00% | 0.00% | 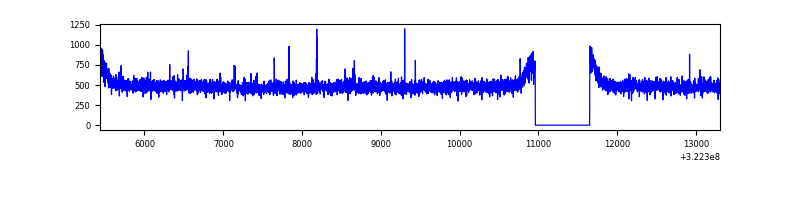 |
| C | 7869 | 7179 | 171 | 171 | 2.17% | 2.38% | 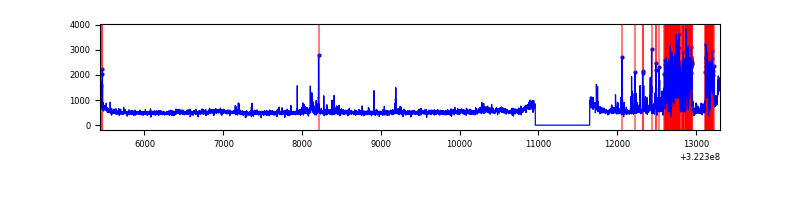 |
| D | 7868 | 7178 | 50 | 50 | 0.64% | 0.70% | 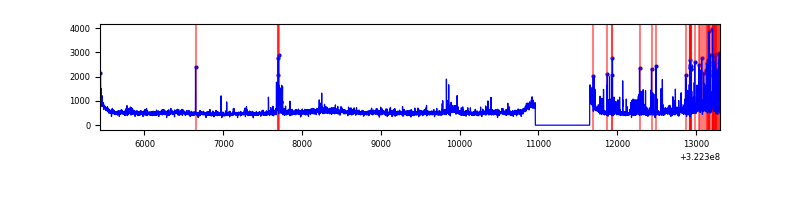 |
Top three noisy pixels from each quadrant. If the there are fewer than three noisy pixels in the level2.evt file, extra rows are filled as -1
| Pixel properties | Quadrant properties | ||||||
|---|---|---|---|---|---|---|---|
| Quadrant | DetID | PixID | Counts | Sigma | Mean | Median | Sigma |
| A | 6 | 16 | 150734 | 824.29 | 908 | 890 | 181.8 |
| A | 13 | 254 | 11072 | 56.01 | 908 | 890 | 181.8 |
| A | 3 | 1 | 10205 | 51.24 | 908 | 890 | 181.8 |
| B | 12 | 111 | 20792 | 115.77 | 895 | 871 | 172.1 |
| B | 11 | 111 | 18661 | 103.38 | 895 | 871 | 172.1 |
| B | 14 | 111 | 16900 | 93.15 | 895 | 871 | 172.1 |
| C | 2 | 16 | 859689 | 4345.37 | 849 | 852 | 197.6 |
| C | 7 | 247 | 241986 | 1220.04 | 849 | 852 | 197.6 |
| C | 14 | 238 | 136398 | 685.81 | 849 | 852 | 197.6 |
| D | 7 | 238 | 416957 | 1974.51 | 876 | 850 | 210.7 |
| D | 1 | 52 | 236503 | 1118.22 | 876 | 850 | 210.7 |
| D | 8 | 195 | 185937 | 878.27 | 876 | 850 | 210.7 |
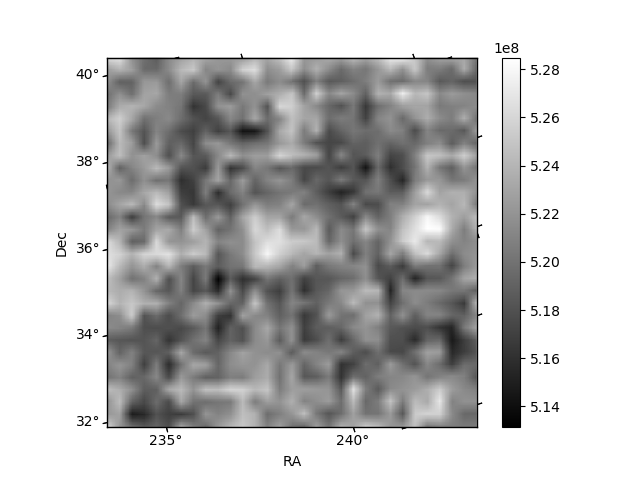
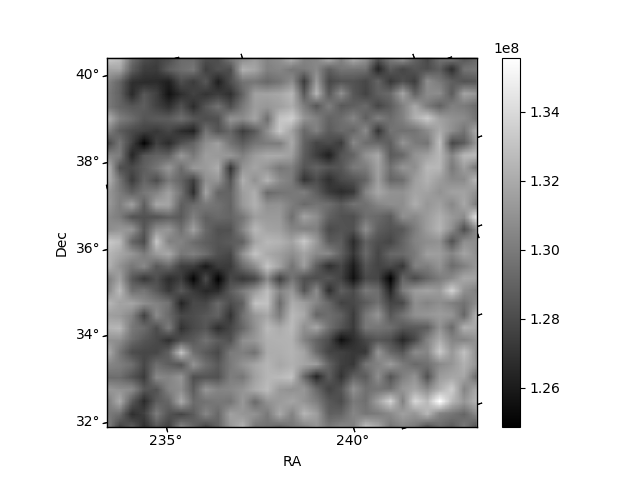
Histogram calculated using DETX and DETY for each event in the final _common_clean file
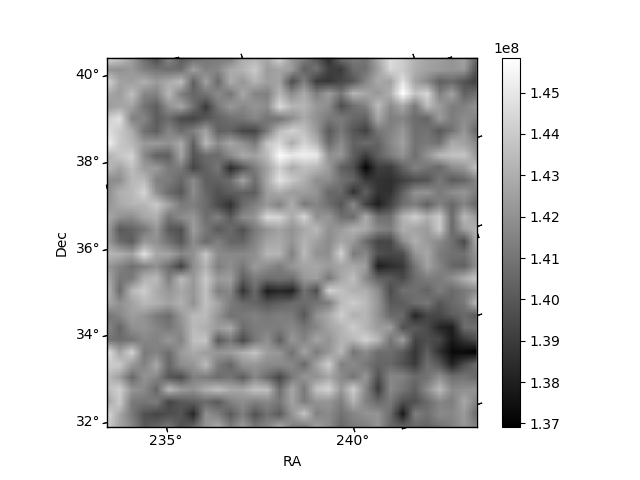
| Quadrant A | 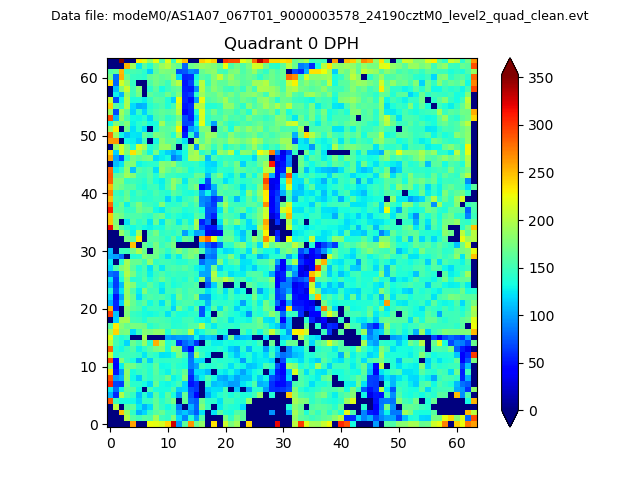 |
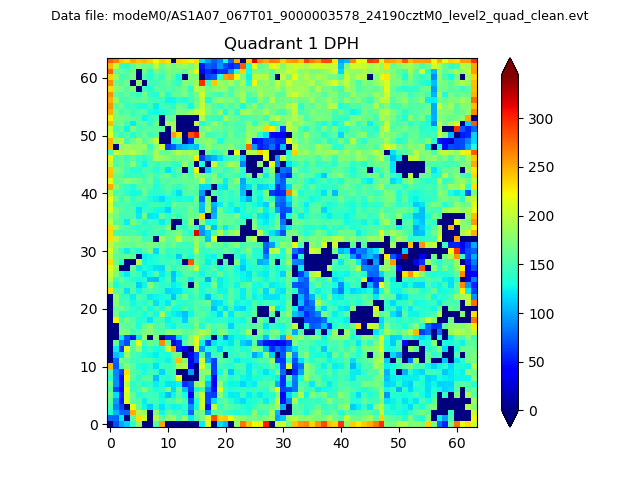 |
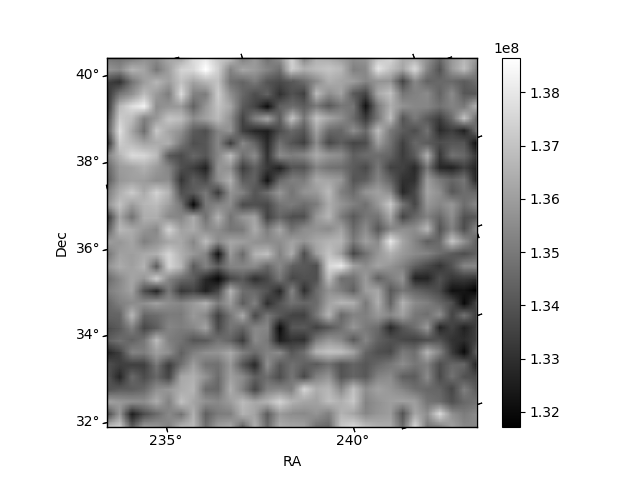
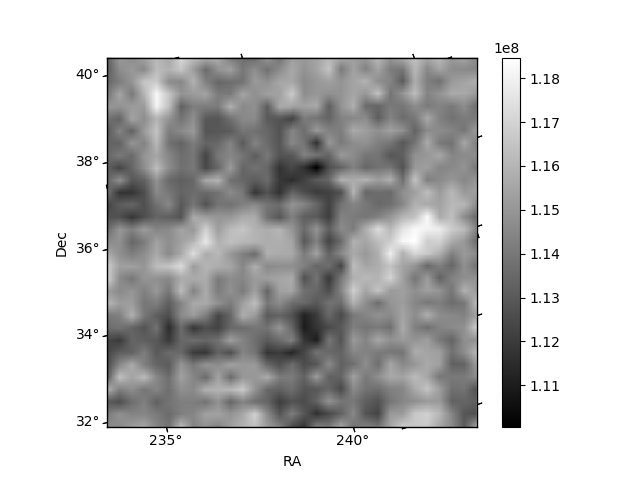
Quadrant B |
|---|---|---|---|
| Quadrant D | 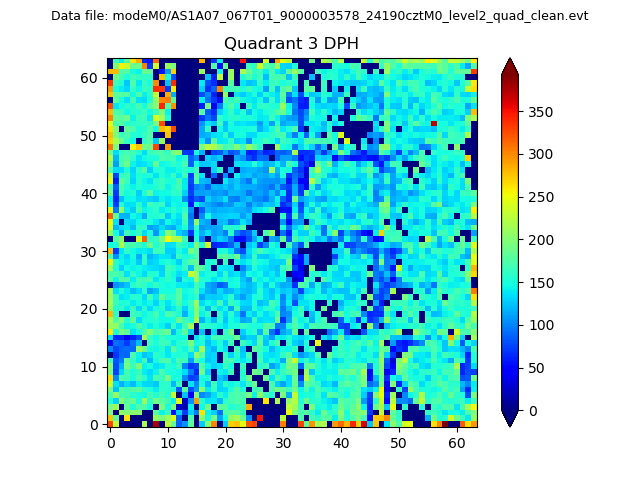 |
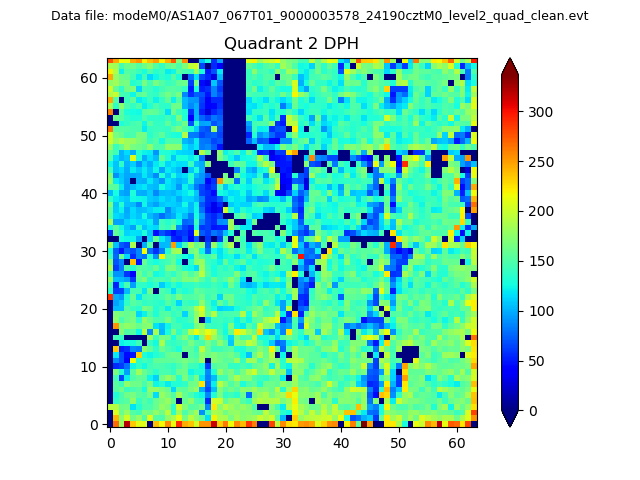 |
Quadrant C |
| Plot type | Count rate plots | Images |
|---|---|---|
| Comparison with Poisson distribution Blue bars denote a histogram of data divided into 1 sec bins. Red curve is a Poisson curve with rate = median count rate of data. |
 |
 |
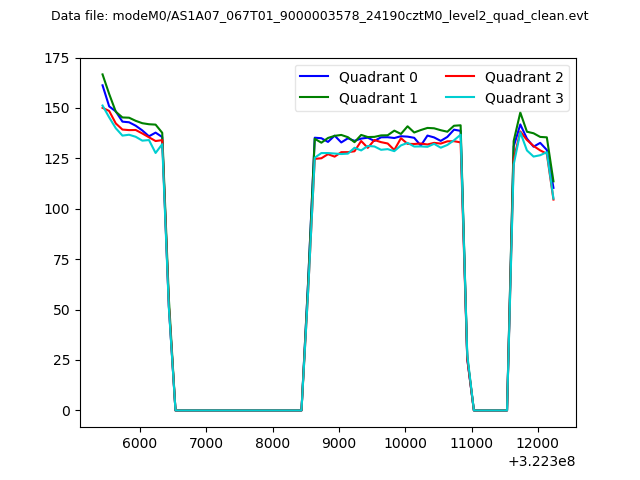
| Quadrant-wise count rates Data is divided into 100 sec bins |
 |
|
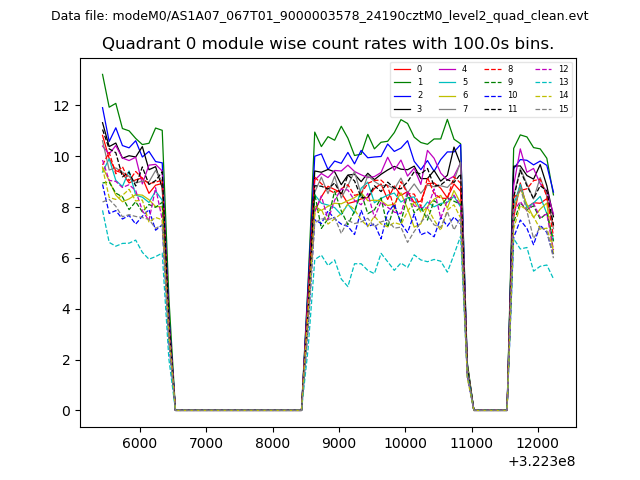
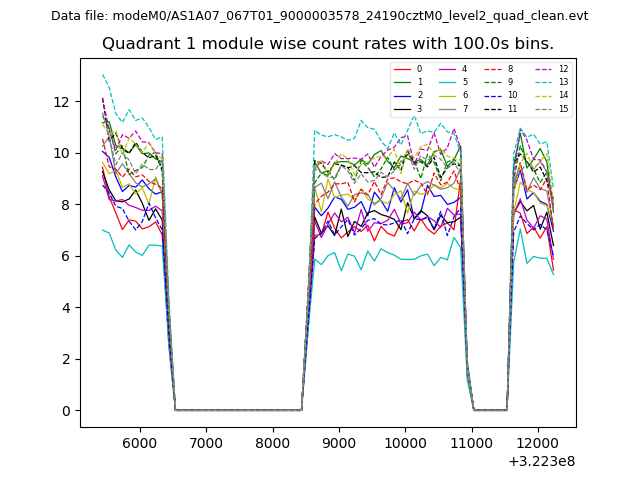
| Module-wise count rates for Quadrant A Data is divided into 100 sec bins |
 |
 |
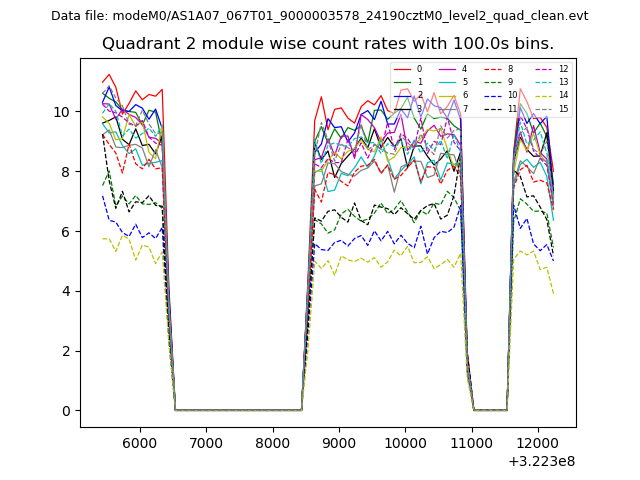
| Module-wise count rates for Quadrant B Data is divided into 100 sec bins |
 |
 |
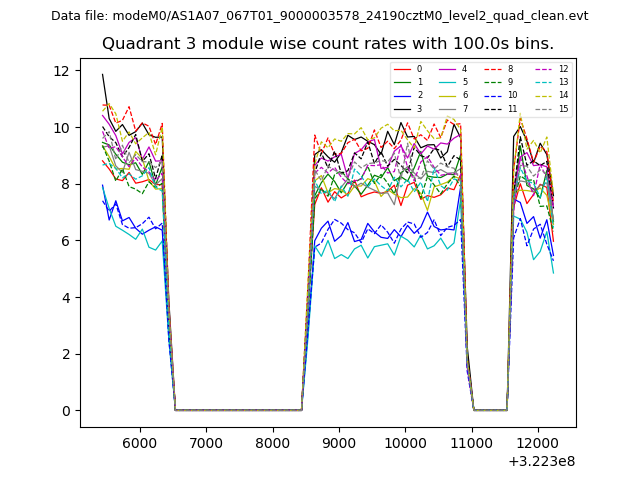
| Module-wise count rates for Quadrant C Data is divided into 100 sec bins |
 |
 |
| Module-wise count rates for Quadrant D Data is divided into 100 sec bins |
 |
 |
| Parameter | Plot |
|---|---|
| CZT HV Monitor |  |
| D_VDD | 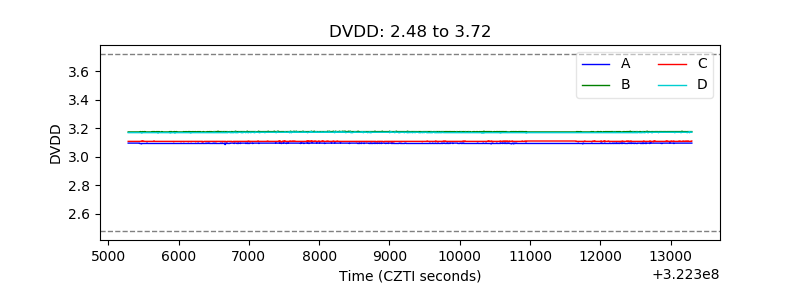 |
| Temperature 1 | 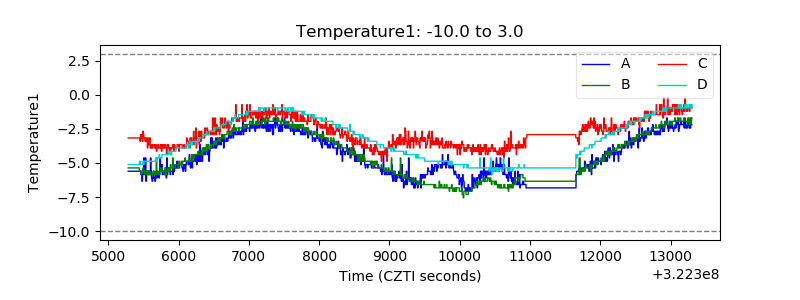 |
| Veto HV Monitor | 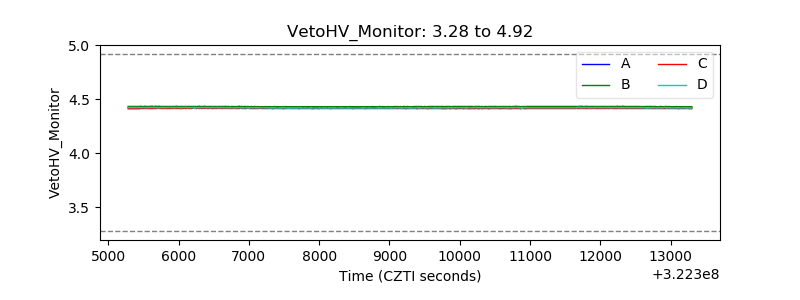 |
| Veto LLD | 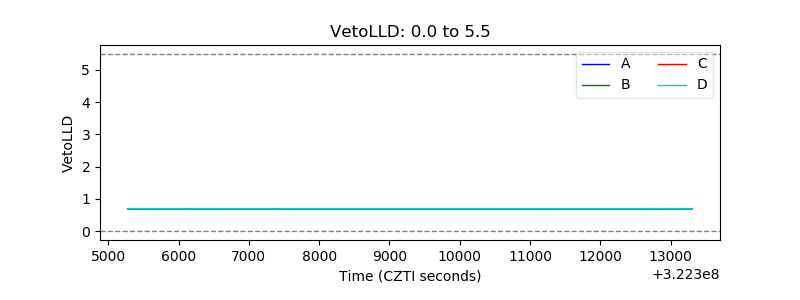 |
| Alpha Counter | 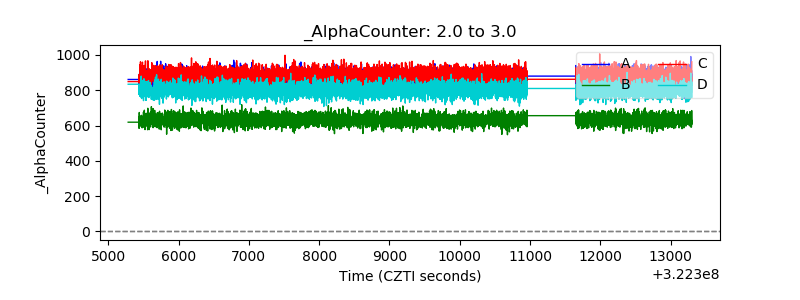 |
| _CPM_Rate | 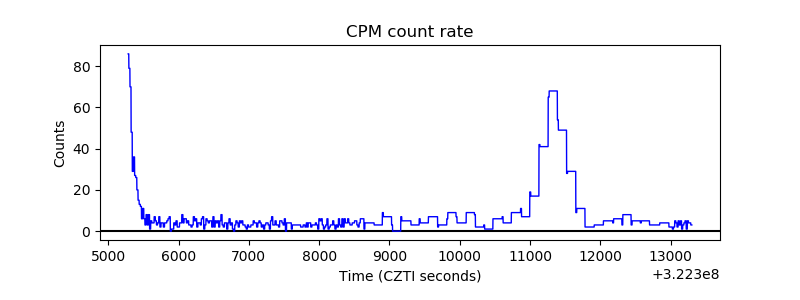 |
| CZT Counter | 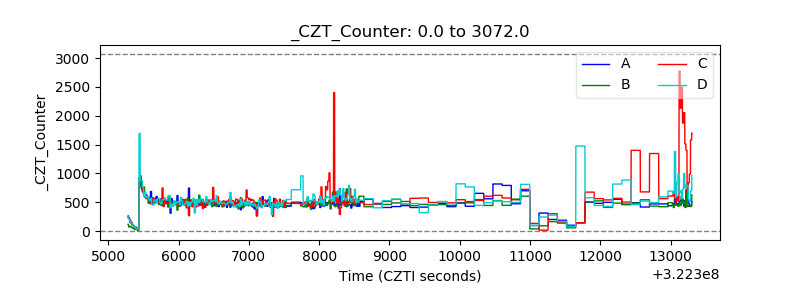 |
| +2.5 Volts monitor |  |
| +5 Volts monitor |  |
| _ROLL_ROT | 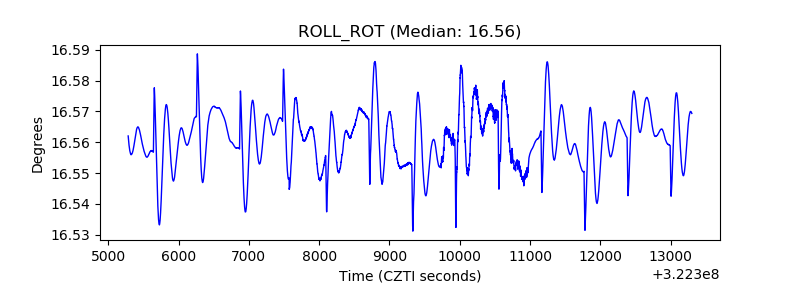 |
| _Roll_DEC | 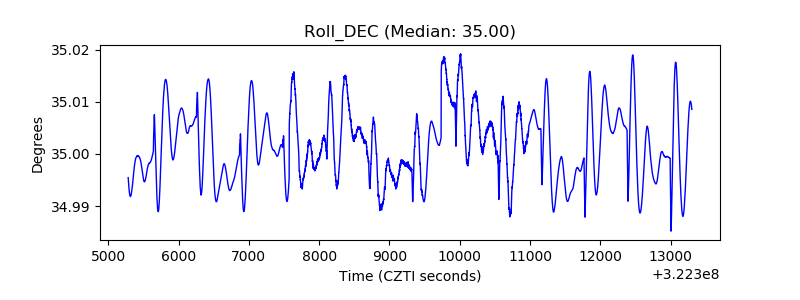 |
| _Roll_RA | 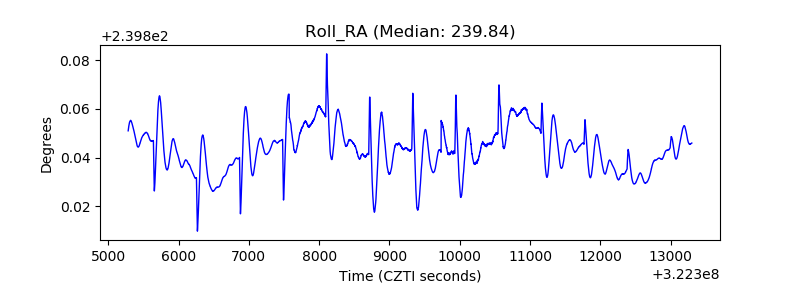 |
| Veto Counter | 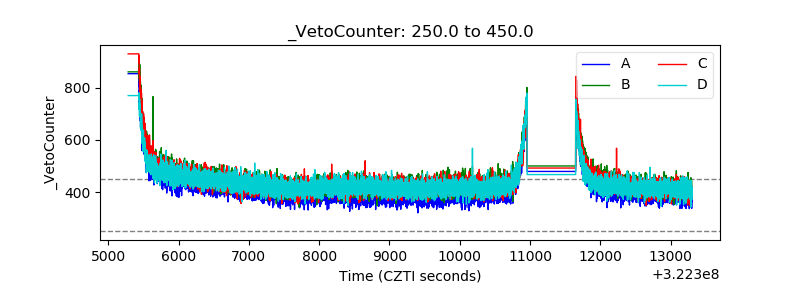 |