| Param | Original file | Final file |
|---|---|---|
| Filename | modeM0/AS1A07_067T01_9000003578_24192cztM0_level2.evt | modeM0/AS1A07_067T01_9000003578_24192cztM0_level2_quad_clean.evt |
| Size (bytes) | 609,079,680 | 82,180,800 |
| Size | 580.9 MB | 78.4 MB |
| Events in quadrant A | 3,662,033 | 500,683 |
| Events in quadrant B | 3,679,407 | 508,539 |
| Events in quadrant C | 4,806,830 | 480,380 |
| Events in quadrant D | 5,781,741 | 469,058 |
| Mode M9 | |||
|---|---|---|---|
| Quadrant | BADHDUFLAG | Total packets | Discarded packets |
| A | 0 | 1 | 0 |
| B | 0 | 1 | 0 |
| C | 0 | 1 | 0 |
| D | 0 | 1 | 0 |
| Mode SS | |||
|---|---|---|---|
| Quadrant | BADHDUFLAG | Total packets | Discarded packets |
| A | 0 | 156 | 0 |
| B | 0 | 156 | 0 |
| C | 0 | 156 | 0 |
| D | 0 | 156 | 0 |
| Mode M0 | |||
|---|---|---|---|
| Quadrant | BADHDUFLAG | Total packets | Discarded packets |
| A | 0 | 15709 | 2 |
| B | 0 | 15694 | 2 |
| C | 0 | 18673 | 2 |
| D | 0 | 22106 | 2 |
| Quadrant | Total seconds | Saturated seconds | Saturation percentage |
|---|---|---|---|
| A | 7607 | 146 | 1.919285% |
| B | 7608 | 152 | 1.997897% |
| C | 7608 | 300 | 3.943218% |
| D | 7608 | 445 | 5.849106% |
Noise dominated data is calculated using 1-second bins in cleaned event files. If a bin has >2000 counts, and if more than 50% of those come from <1% of pixels, then it is considered to be noise-dominated and hence unusable.
| Quadrant | # 1 sec bins | Bins with >0 counts | Bins with >2000 counts | High rate bins dominated by noise | Noise dominated (total time) | Noise dominated (detector-on time) | Marked lightcurve |
|---|---|---|---|---|---|---|---|
| A | 7747 | 7608 | 0 | 0 | 0.00% | 0.00% | 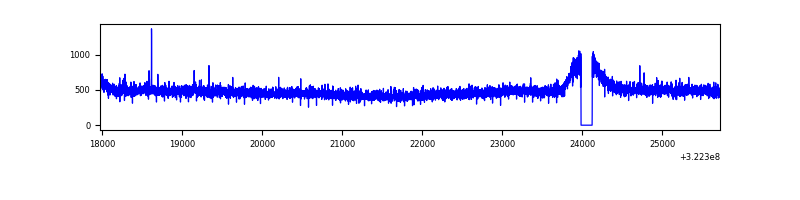 |
| B | 7748 | 7609 | 0 | 0 | 0.00% | 0.00% | 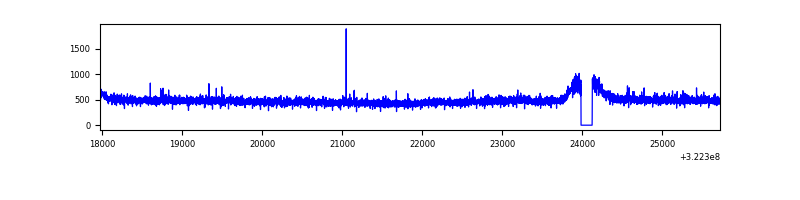 |
| C | 7748 | 7608 | 80 | 80 | 1.03% | 1.05% | 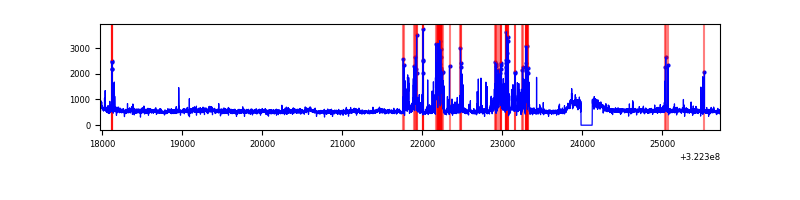 |
| D | 7748 | 7609 | 280 | 280 | 3.61% | 3.68% | 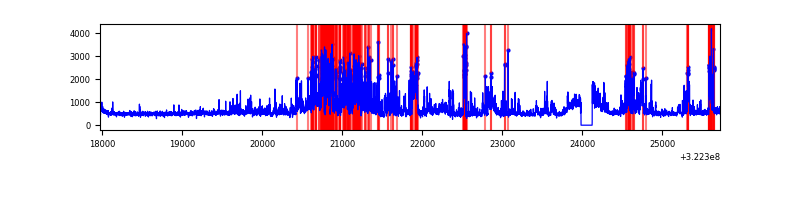 |
Top three noisy pixels from each quadrant. If the there are fewer than three noisy pixels in the level2.evt file, extra rows are filled as -1
| Pixel properties | Quadrant properties | ||||||
|---|---|---|---|---|---|---|---|
| Quadrant | DetID | PixID | Counts | Sigma | Mean | Median | Sigma |
| A | 13 | 254 | 11018 | 52.94 | 946 | 924 | 190.7 |
| A | 3 | 1 | 9457 | 44.75 | 946 | 924 | 190.7 |
| A | 3 | 137 | 8582 | 40.16 | 946 | 924 | 190.7 |
| B | 12 | 111 | 22376 | 118.56 | 935 | 913 | 181.0 |
| B | 11 | 111 | 19806 | 104.37 | 935 | 913 | 181.0 |
| B | 14 | 111 | 17108 | 89.46 | 935 | 913 | 181.0 |
| C | 2 | 16 | 661558 | 3156.11 | 892 | 894 | 209.3 |
| C | 7 | 247 | 518409 | 2472.26 | 892 | 894 | 209.3 |
| C | 14 | 238 | 139902 | 664.07 | 892 | 894 | 209.3 |
| D | 7 | 238 | 2221851 | 9980.64 | 906 | 877 | 222.5 |
| D | 8 | 195 | 119566 | 533.37 | 906 | 877 | 222.5 |
| D | 2 | 234 | 31912 | 139.47 | 906 | 877 | 222.5 |
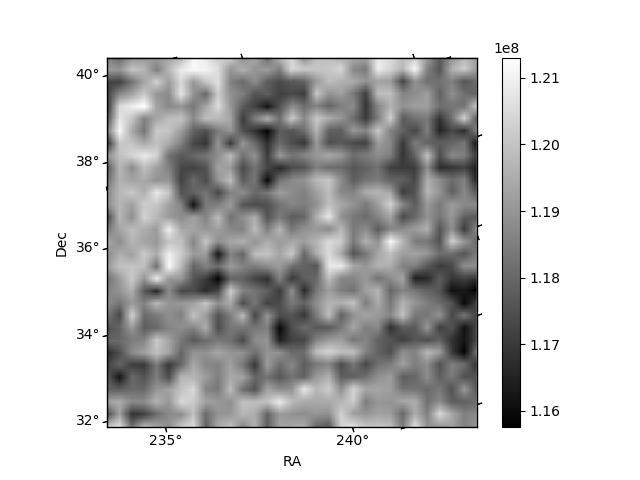
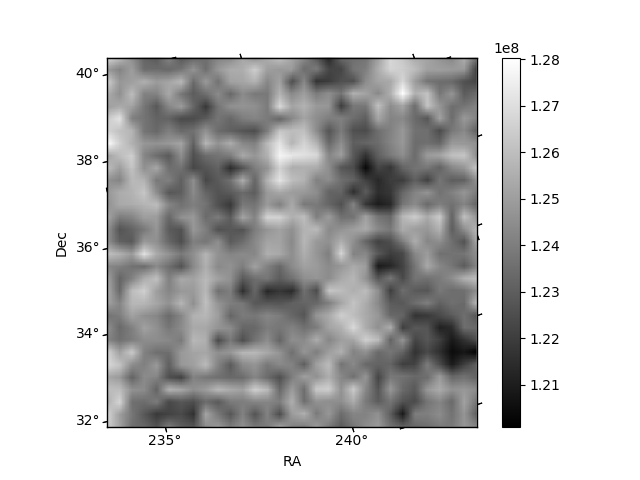
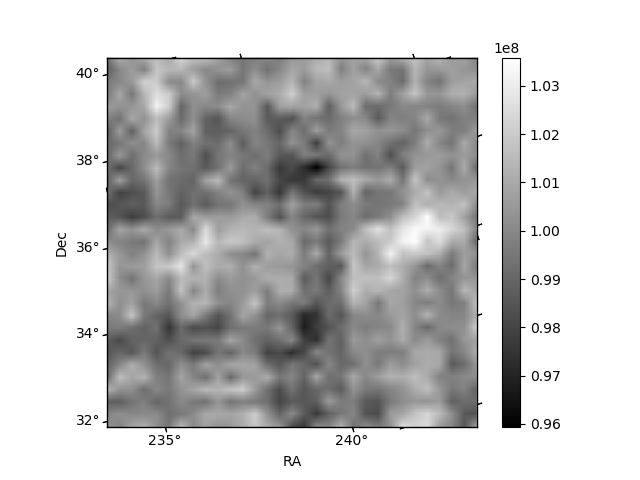
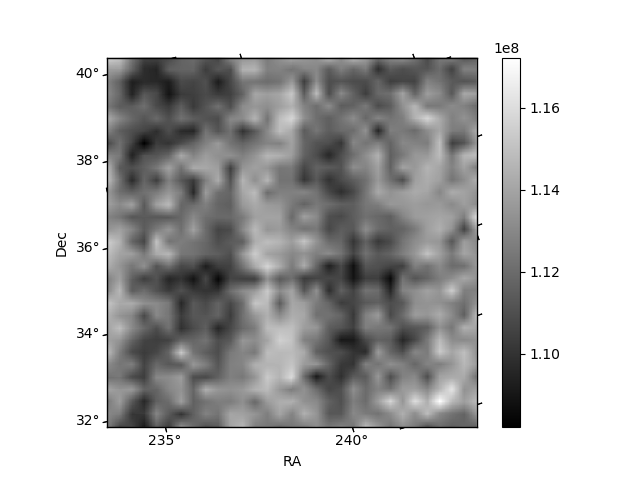
Histogram calculated using DETX and DETY for each event in the final _common_clean file
| Quadrant A | 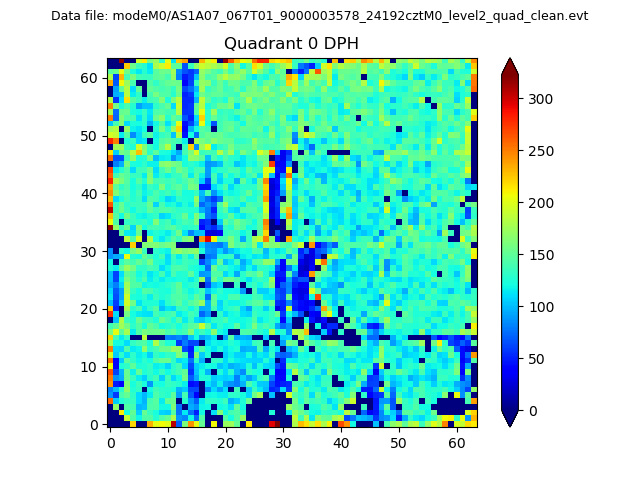 |
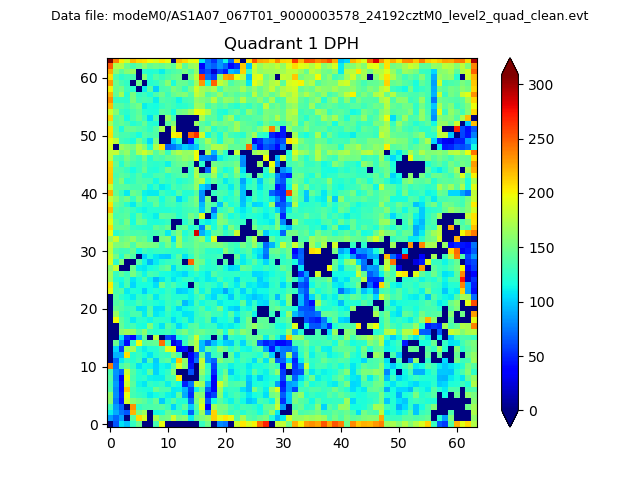 |
Quadrant B |
|---|---|---|---|
| Quadrant D | 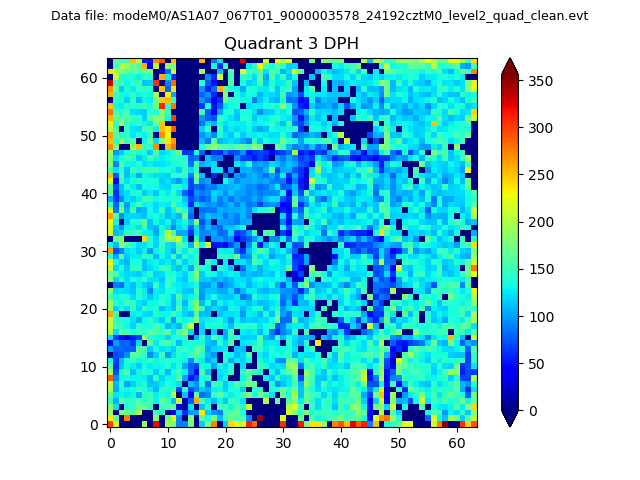 |
 |
Quadrant C |
| Plot type | Count rate plots | Images |
|---|---|---|
| Comparison with Poisson distribution Blue bars denote a histogram of data divided into 1 sec bins. Red curve is a Poisson curve with rate = median count rate of data. |
 |
 |
| Quadrant-wise count rates Data is divided into 100 sec bins |
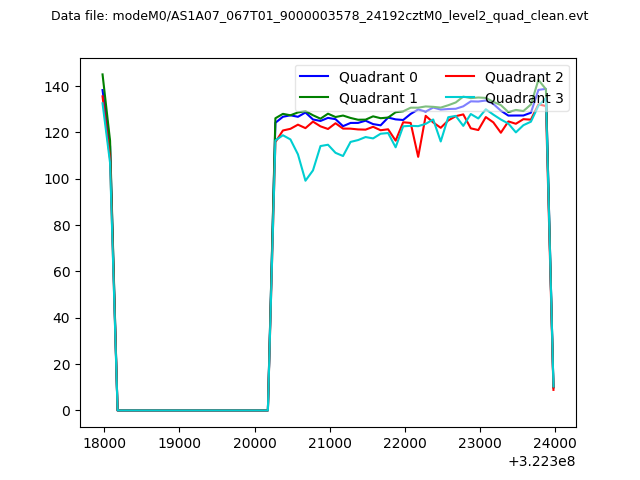 |
|
| Module-wise count rates for Quadrant A Data is divided into 100 sec bins |
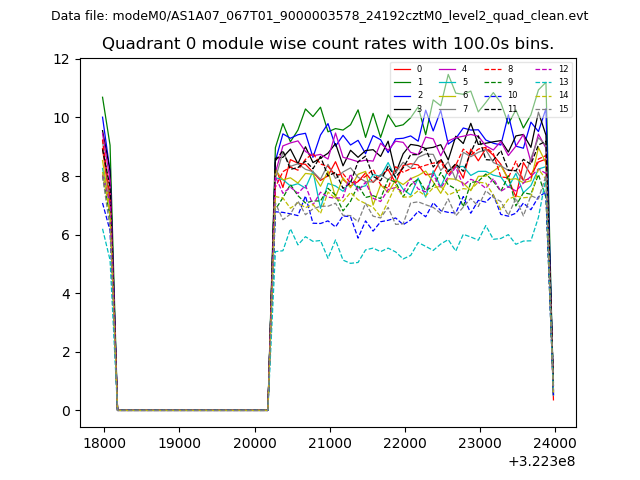 |
 |
| Module-wise count rates for Quadrant B Data is divided into 100 sec bins |
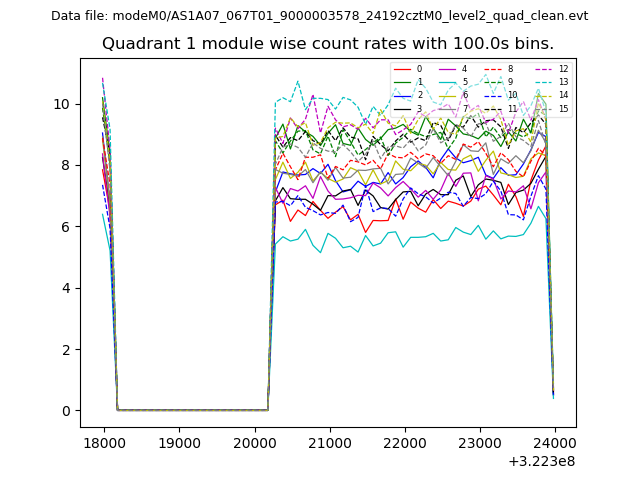 |
 |
| Module-wise count rates for Quadrant C Data is divided into 100 sec bins |
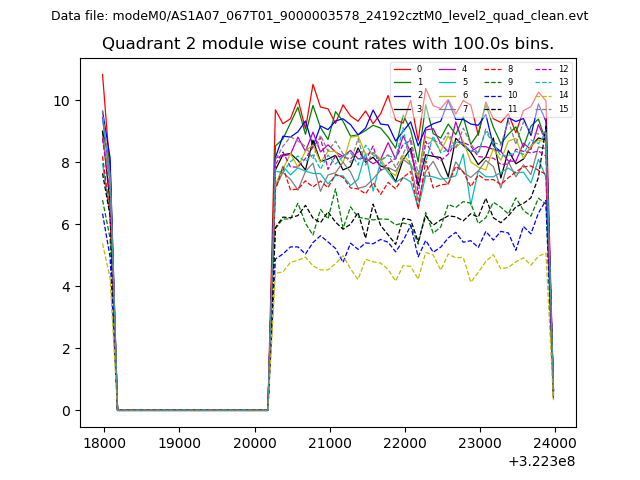 |
 |
| Module-wise count rates for Quadrant D Data is divided into 100 sec bins |
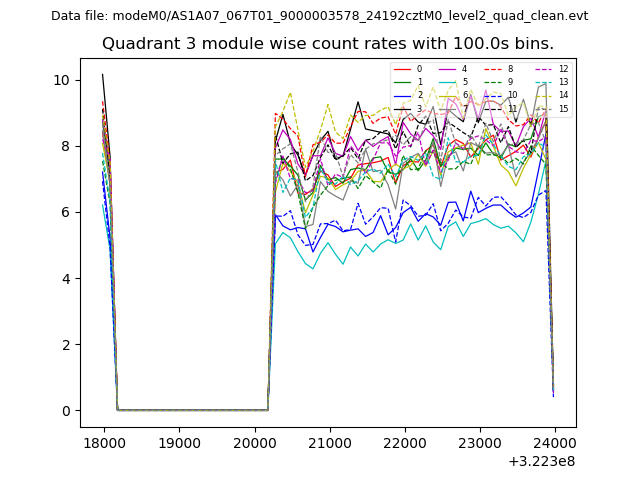 |
 |
| Parameter | Plot |
|---|---|
| CZT HV Monitor | 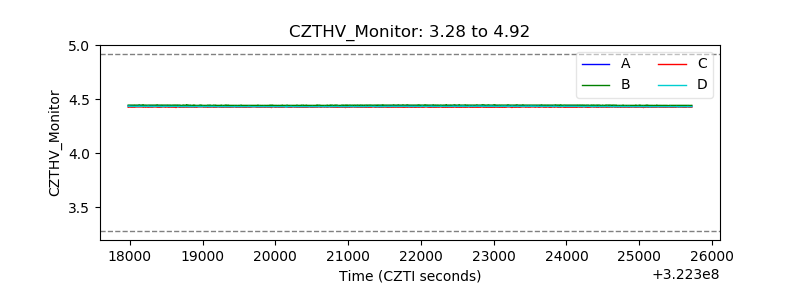 |
| D_VDD | 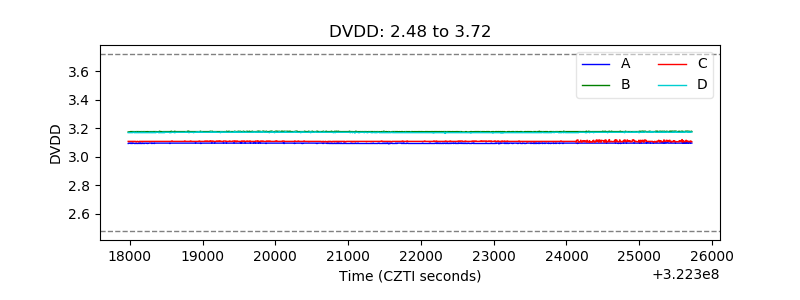 |
| Temperature 1 | 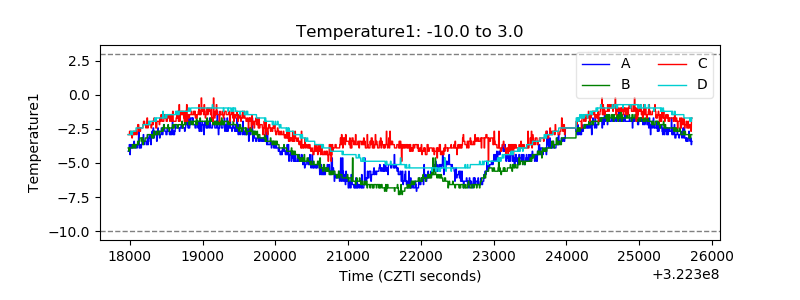 |
| Veto HV Monitor | 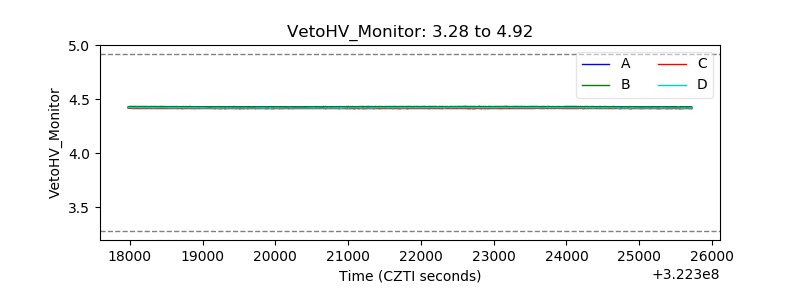 |
| Veto LLD | 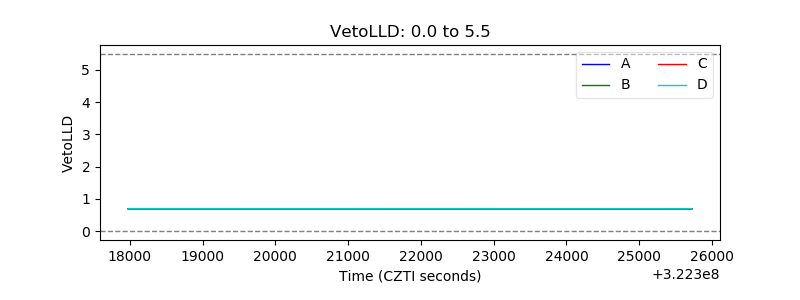 |
| Alpha Counter | 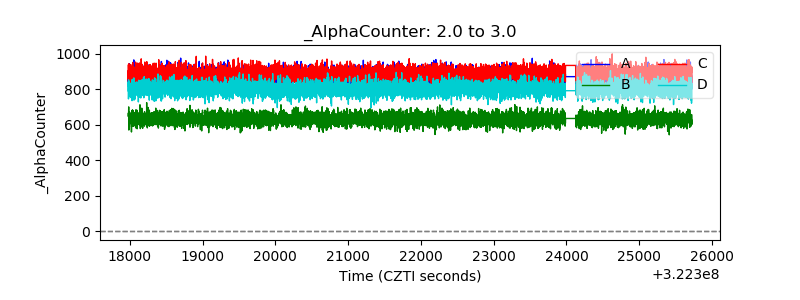 |
| _CPM_Rate | 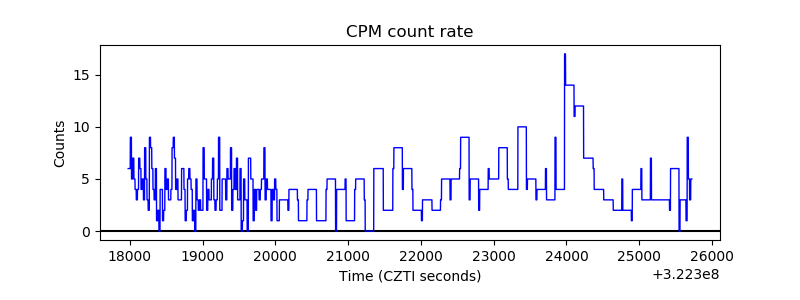 |
| CZT Counter | 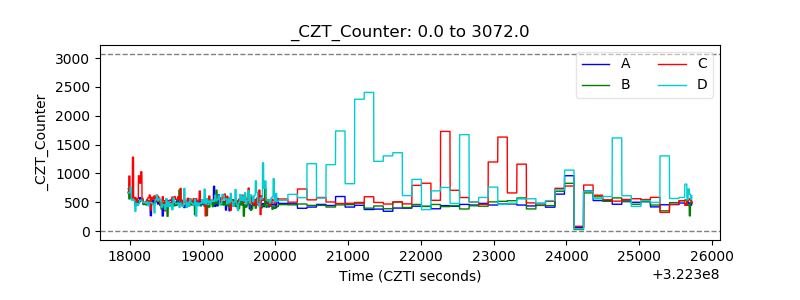 |
| +2.5 Volts monitor |  |
| +5 Volts monitor |  |
| _ROLL_ROT | 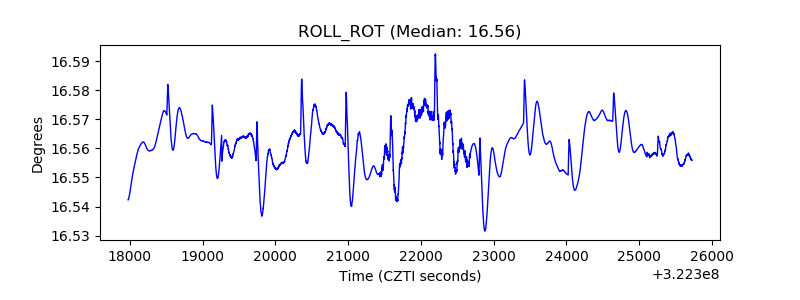 |
| _Roll_DEC | 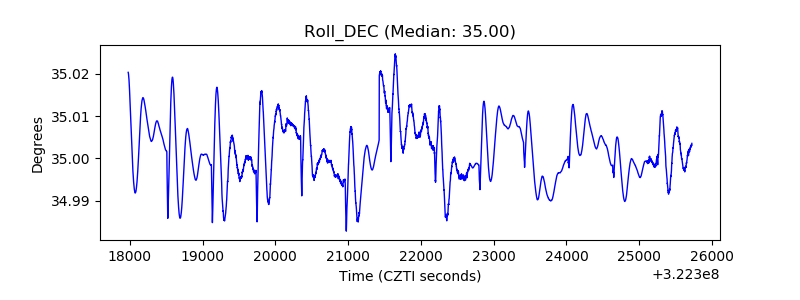 |
| _Roll_RA |  |
| Veto Counter | 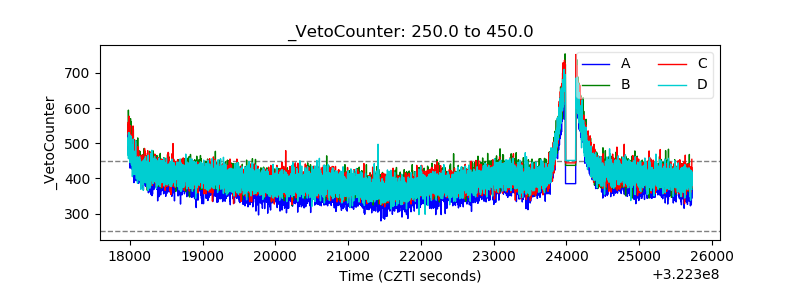 |