| Param | Original file | Final file |
|---|---|---|
| Filename | modeM0/AS1A07_067T01_9000003578_24195cztM0_level2.evt | modeM0/AS1A07_067T01_9000003578_24195cztM0_level2_quad_clean.evt |
| Size (bytes) | 880,931,520 | 166,515,840 |
| Size | 840.1 MB | 158.8 MB |
| Events in quadrant A | 6,228,737 | 1,044,921 |
| Events in quadrant B | 6,279,634 | 1,062,550 |
| Events in quadrant C | 6,941,300 | 1,015,927 |
| Events in quadrant D | 6,341,809 | 1,014,224 |
| Mode M9 | |||
|---|---|---|---|
| Quadrant | BADHDUFLAG | Total packets | Discarded packets |
| A | 0 | 16 | 0 |
| B | 0 | 16 | 0 |
| C | 0 | 16 | 0 |
| D | 0 | 16 | 0 |
| Mode SS | |||
|---|---|---|---|
| Quadrant | BADHDUFLAG | Total packets | Discarded packets |
| A | 0 | 268 | 0 |
| B | 0 | 268 | 0 |
| C | 0 | 268 | 0 |
| D | 0 | 268 | 0 |
| Mode M0 | |||
|---|---|---|---|
| Quadrant | BADHDUFLAG | Total packets | Discarded packets |
| A | 0 | 27017 | 3 |
| B | 0 | 27032 | 3 |
| C | 0 | 28803 | 3 |
| D | 0 | 27536 | 3 |
| Quadrant | Total seconds | Saturated seconds | Saturation percentage |
|---|---|---|---|
| A | 13105 | 153 | 1.167493% |
| B | 13106 | 163 | 1.243705% |
| C | 13106 | 313 | 2.388219% |
| D | 13106 | 120 | 0.915611% |
Noise dominated data is calculated using 1-second bins in cleaned event files. If a bin has >2000 counts, and if more than 50% of those come from <1% of pixels, then it is considered to be noise-dominated and hence unusable.
| Quadrant | # 1 sec bins | Bins with >0 counts | Bins with >2000 counts | High rate bins dominated by noise | Noise dominated (total time) | Noise dominated (detector-on time) | Marked lightcurve |
|---|---|---|---|---|---|---|---|
| A | 14765 | 13107 | 17 | 17 | 0.12% | 0.13% | 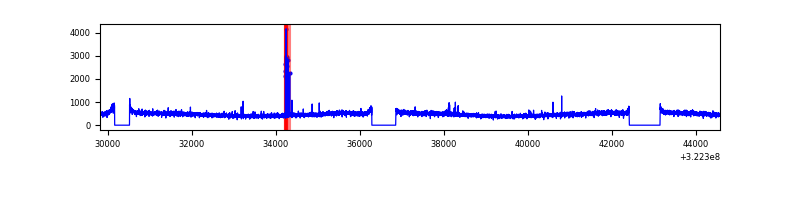 |
| B | 14766 | 13106 | 3 | 3 | 0.02% | 0.02% | 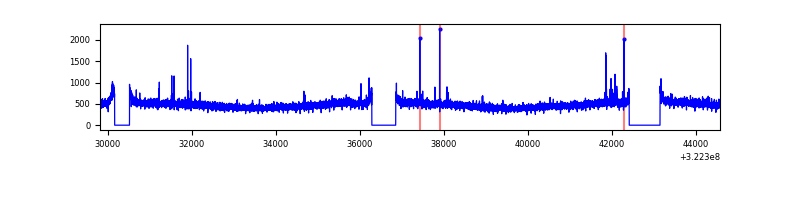 |
| C | 14766 | 13106 | 72 | 72 | 0.49% | 0.55% | 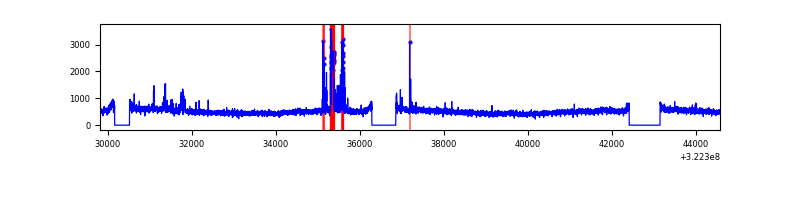 |
| D | 14766 | 13109 | 4 | 4 | 0.03% | 0.03% | 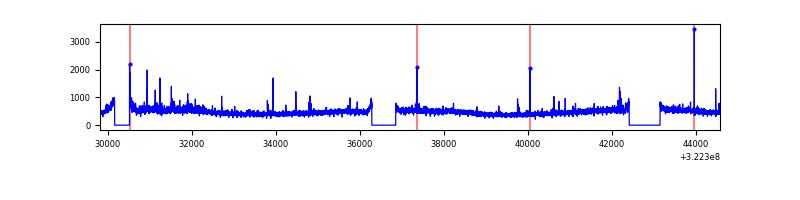 |
Top three noisy pixels from each quadrant. If the there are fewer than three noisy pixels in the level2.evt file, extra rows are filled as -1
| Pixel properties | Quadrant properties | ||||||
|---|---|---|---|---|---|---|---|
| Quadrant | DetID | PixID | Counts | Sigma | Mean | Median | Sigma |
| A | 6 | 16 | 60131 | 182.38 | 1595 | 1561 | 321.1 |
| A | 13 | 254 | 20699 | 59.59 | 1595 | 1561 | 321.1 |
| A | 3 | 1 | 20278 | 58.28 | 1595 | 1561 | 321.1 |
| B | 12 | 111 | 37625 | 117.98 | 1588 | 1541 | 305.8 |
| B | 11 | 111 | 33353 | 104.01 | 1588 | 1541 | 305.8 |
| B | 14 | 111 | 28652 | 88.64 | 1588 | 1541 | 305.8 |
| C | 7 | 247 | 368446 | 1039.51 | 1521 | 1529 | 353.0 |
| C | 2 | 16 | 305210 | 860.35 | 1521 | 1529 | 353.0 |
| C | 14 | 238 | 243305 | 684.97 | 1521 | 1529 | 353.0 |
| D | 8 | 195 | 243256 | 642.62 | 1556 | 1512 | 376.2 |
| D | 7 | 238 | 152532 | 401.45 | 1556 | 1512 | 376.2 |
| D | 2 | 234 | 57422 | 148.62 | 1556 | 1512 | 376.2 |
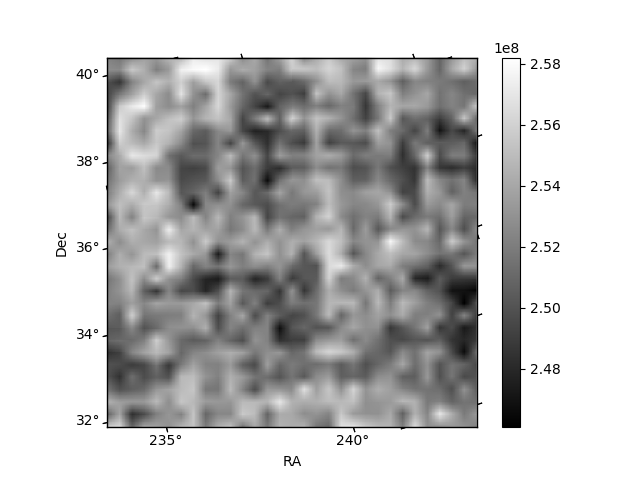
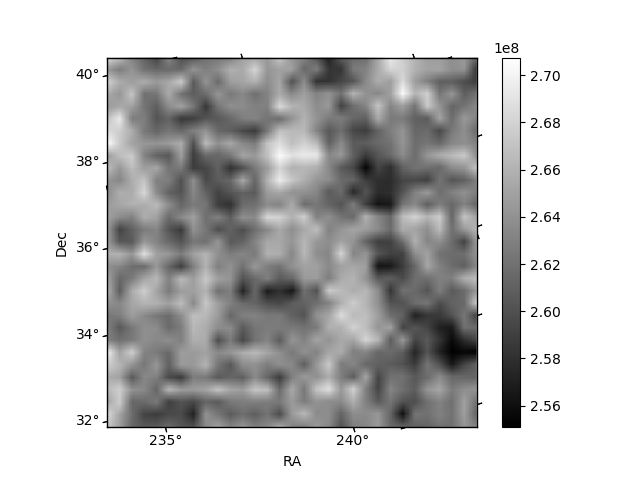
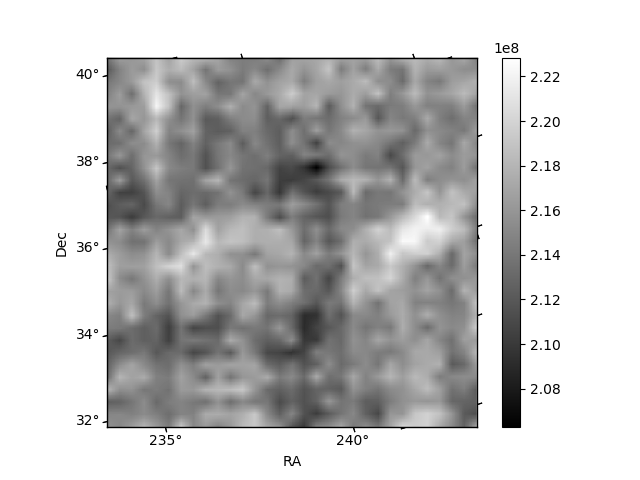
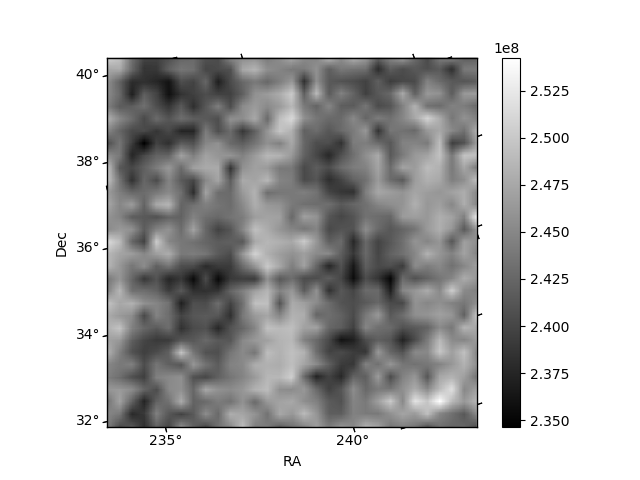
Histogram calculated using DETX and DETY for each event in the final _common_clean file
| Quadrant A | 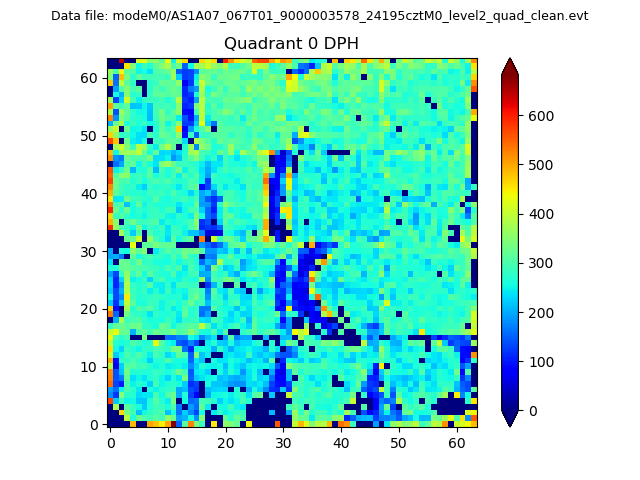 |
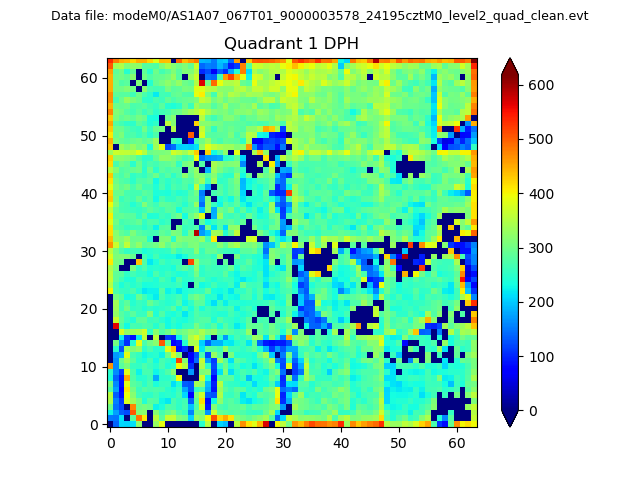 |
Quadrant B |
|---|---|---|---|
| Quadrant D | 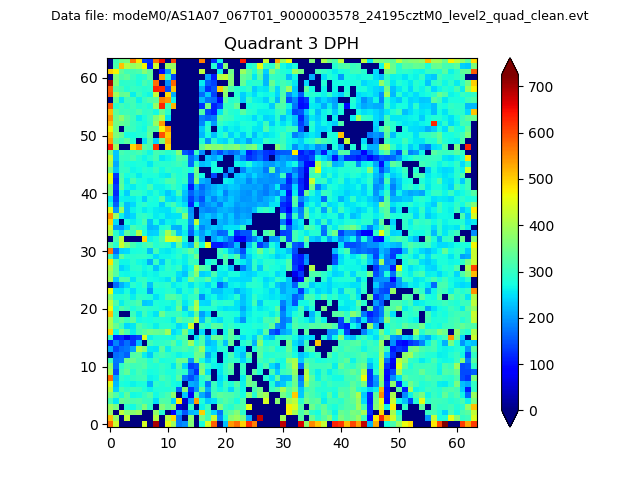 |
 |
Quadrant C |
| Plot type | Count rate plots | Images |
|---|---|---|
| Comparison with Poisson distribution Blue bars denote a histogram of data divided into 1 sec bins. Red curve is a Poisson curve with rate = median count rate of data. |
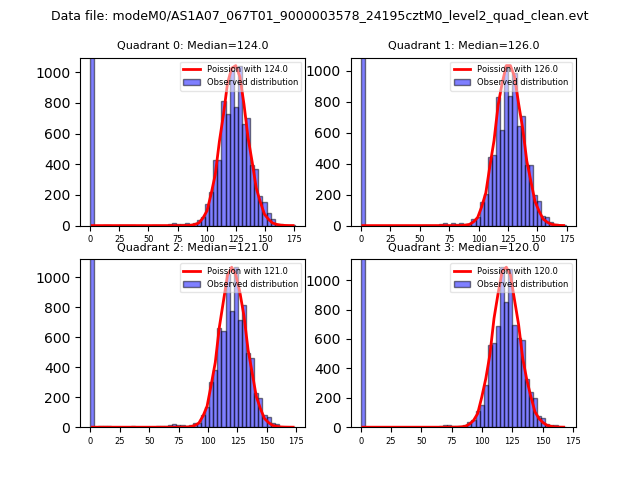 |
 |
| Quadrant-wise count rates Data is divided into 100 sec bins |
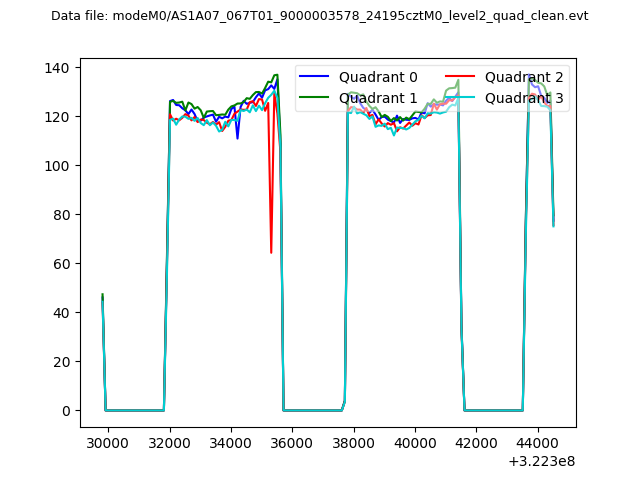 |
|
| Module-wise count rates for Quadrant A Data is divided into 100 sec bins |
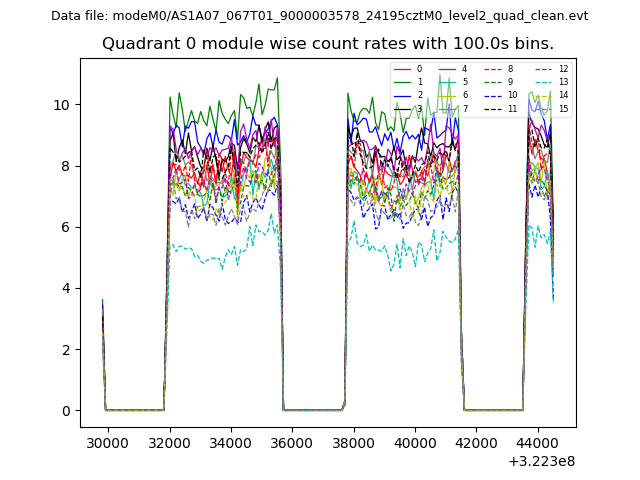 |
 |
| Module-wise count rates for Quadrant B Data is divided into 100 sec bins |
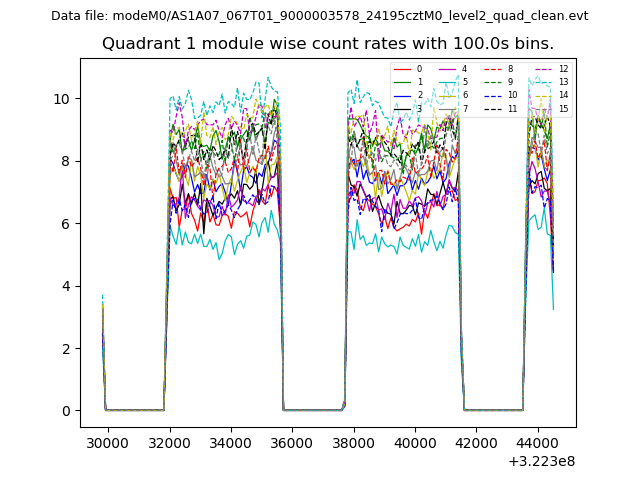 |
 |
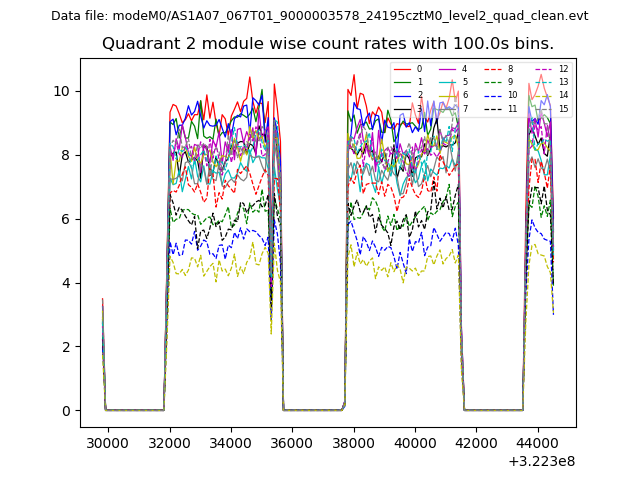
| Module-wise count rates for Quadrant C Data is divided into 100 sec bins |
 |
 |
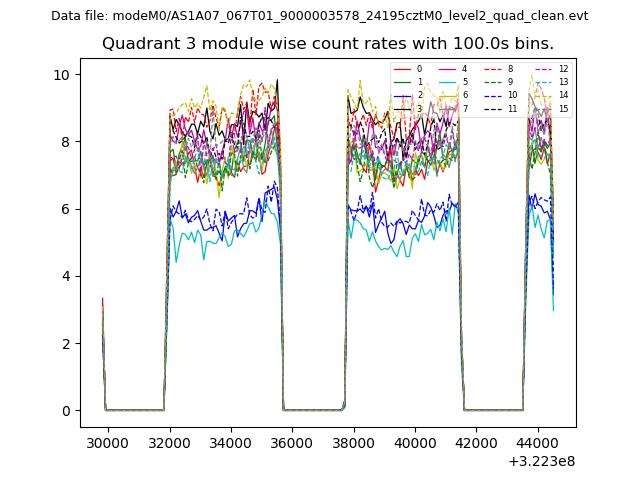
| Module-wise count rates for Quadrant D Data is divided into 100 sec bins |
 |
 |
| Parameter | Plot |
|---|---|
| CZT HV Monitor | 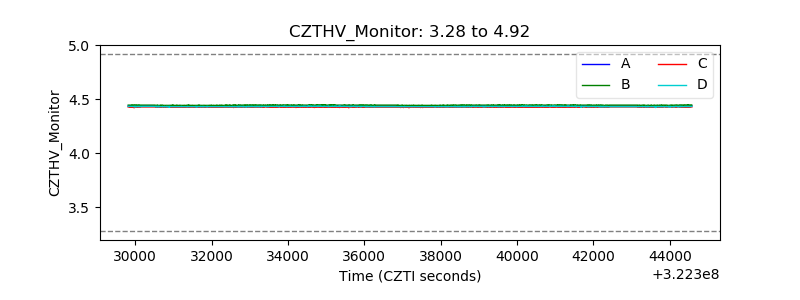 |
| D_VDD | 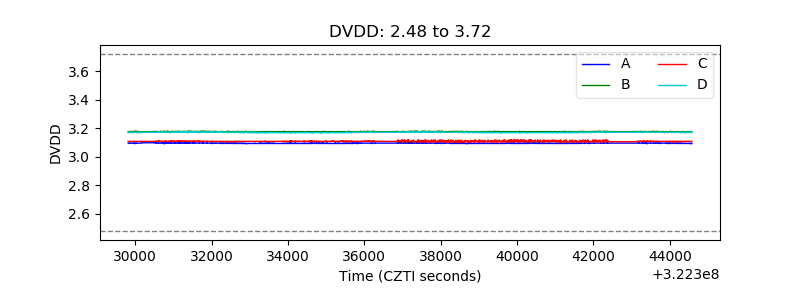 |
| Temperature 1 | 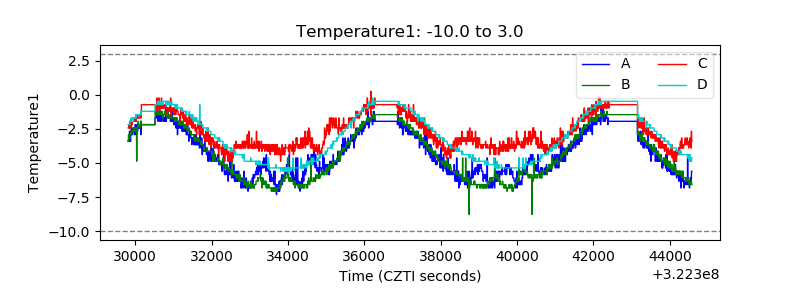 |
| Veto HV Monitor | 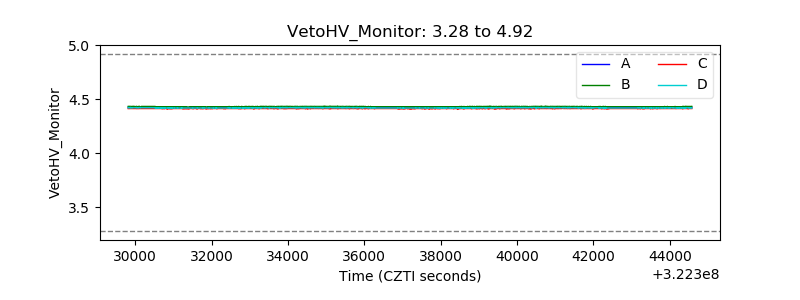 |
| Veto LLD | 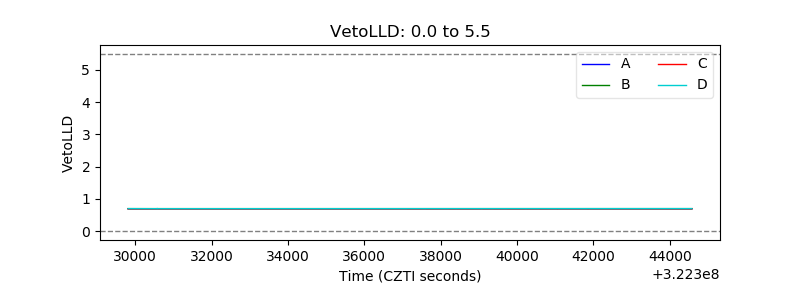 |
| Alpha Counter | 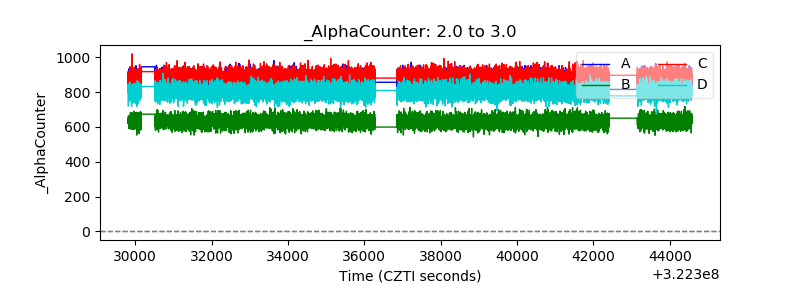 |
| _CPM_Rate | 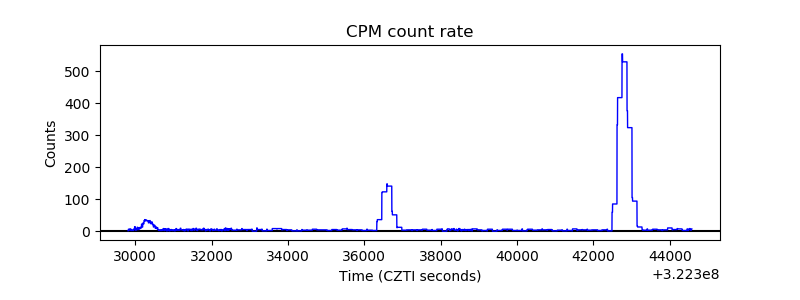 |
| CZT Counter |  |
| +2.5 Volts monitor |  |
| +5 Volts monitor |  |
| _ROLL_ROT | 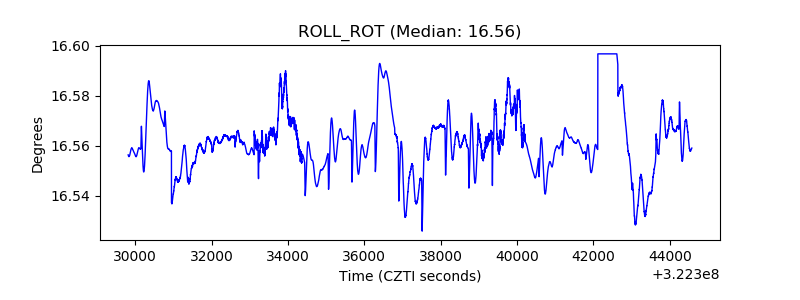 |
| _Roll_DEC | 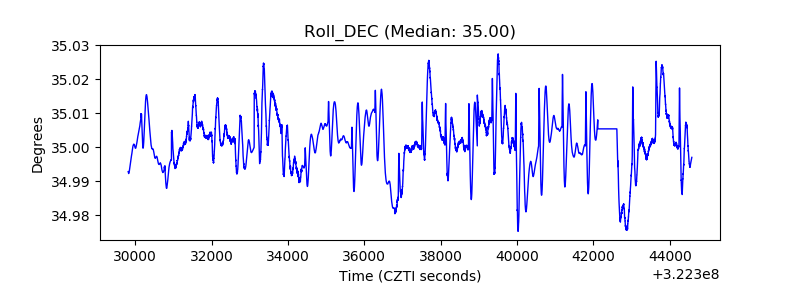 |
| _Roll_RA |  |
| Veto Counter | 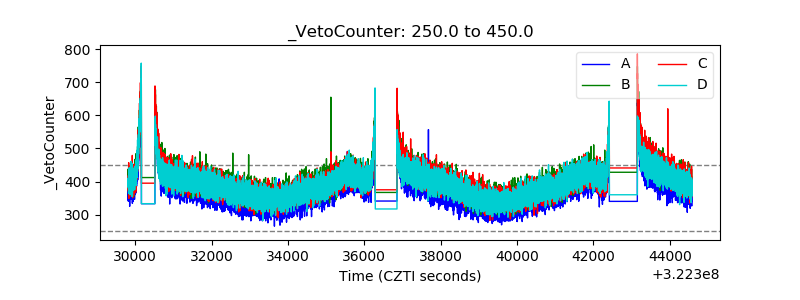 |