| Param | Original file | Final file |
|---|---|---|
| Filename | modeM0/AS1A07_067T01_9000003578_24199cztM0_level2.evt | modeM0/AS1A07_067T01_9000003578_24199cztM0_level2_quad_clean.evt |
| Size (bytes) | 38,214,720 | 10,874,880 |
| Size | 36.4 MB | 10.4 MB |
| Events in quadrant A | 261,485 | 73,058 |
| Events in quadrant B | 273,935 | 76,259 |
| Events in quadrant C | 287,661 | 71,748 |
| Events in quadrant D | 300,056 | 68,219 |
| Mode M9 | |||
|---|---|---|---|
| Quadrant | BADHDUFLAG | Total packets | Discarded packets |
| A | 0 | 8 | 0 |
| B | 0 | 9 | 0 |
| C | 0 | 9 | 0 |
| D | 0 | 9 | 0 |
| Mode SS | |||
|---|---|---|---|
| Quadrant | BADHDUFLAG | Total packets | Discarded packets |
| A | 0 | 10 | 0 |
| B | 0 | 10 | 0 |
| C | 0 | 10 | 0 |
| D | 0 | 10 | 0 |
| Mode M0 | |||
|---|---|---|---|
| Quadrant | BADHDUFLAG | Total packets | Discarded packets |
| A | 0 | 1058 | 1 |
| B | 0 | 1142 | 1 |
| C | 0 | 1232 | 1 |
| D | 0 | 1230 | 1 |
| Quadrant | Total seconds | Saturated seconds | Saturation percentage |
|---|---|---|---|
| A | 447 | 1 | 0.223714% |
| B | 447 | 4 | 0.894855% |
| C | 447 | 11 | 2.460850% |
| D | 447 | 2 | 0.447427% |
Noise dominated data is calculated using 1-second bins in cleaned event files. If a bin has >2000 counts, and if more than 50% of those come from <1% of pixels, then it is considered to be noise-dominated and hence unusable.
| Quadrant | # 1 sec bins | Bins with >0 counts | Bins with >2000 counts | High rate bins dominated by noise | Noise dominated (total time) | Noise dominated (detector-on time) | Marked lightcurve |
|---|---|---|---|---|---|---|---|
| A | 447 | 447 | 0 | 0 | 0.00% | 0.00% | 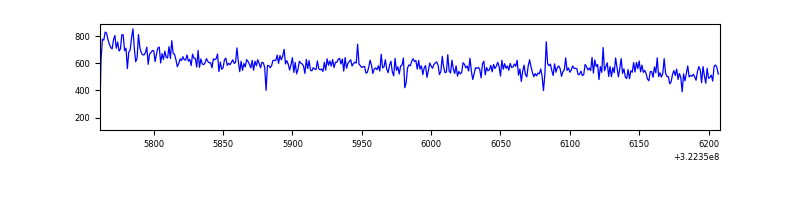 |
| B | 447 | 447 | 0 | 0 | 0.00% | 0.00% |  |
| C | 447 | 447 | 0 | 0 | 0.00% | 0.00% | 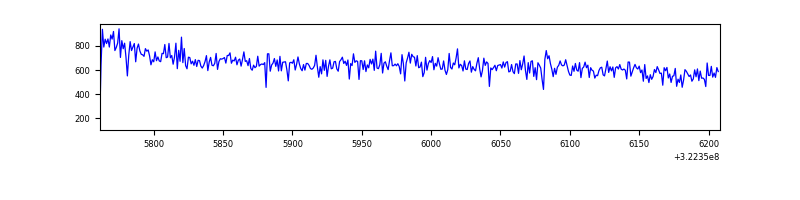 |
| D | 447 | 447 | 1 | 1 | 0.22% | 0.22% | 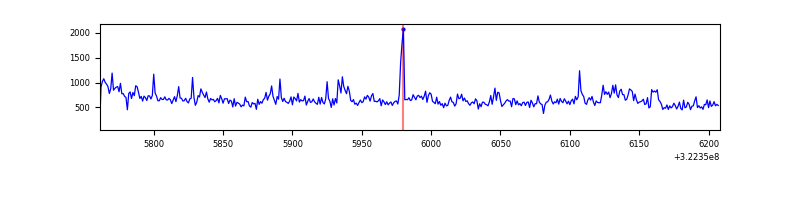 |
Top three noisy pixels from each quadrant. If the there are fewer than three noisy pixels in the level2.evt file, extra rows are filled as -1
| Pixel properties | Quadrant properties | ||||||
|---|---|---|---|---|---|---|---|
| Quadrant | DetID | PixID | Counts | Sigma | Mean | Median | Sigma |
| A | 13 | 254 | 772 | 44.99 | 67 | 66 | 15.7 |
| A | 3 | 137 | 598 | 33.9 | 67 | 66 | 15.7 |
| A | 0 | 226 | 550 | 30.84 | 67 | 66 | 15.7 |
| B | 4 | 171 | 1774 | 112.01 | 69 | 67 | 15.2 |
| B | 12 | 111 | 1686 | 106.23 | 69 | 67 | 15.2 |
| B | 11 | 111 | 1373 | 85.69 | 69 | 67 | 15.2 |
| C | 7 | 247 | 14733 | 826.83 | 67 | 67 | 17.7 |
| C | 14 | 238 | 10493 | 587.79 | 67 | 67 | 17.7 |
| C | 13 | 61 | 416 | 19.68 | 67 | 67 | 17.7 |
| D | 12 | 218 | 28211 | 1554.84 | 66 | 64 | 18.1 |
| D | 7 | 238 | 12452 | 684.31 | 66 | 64 | 18.1 |
| D | 8 | 195 | 6268 | 342.71 | 66 | 64 | 18.1 |
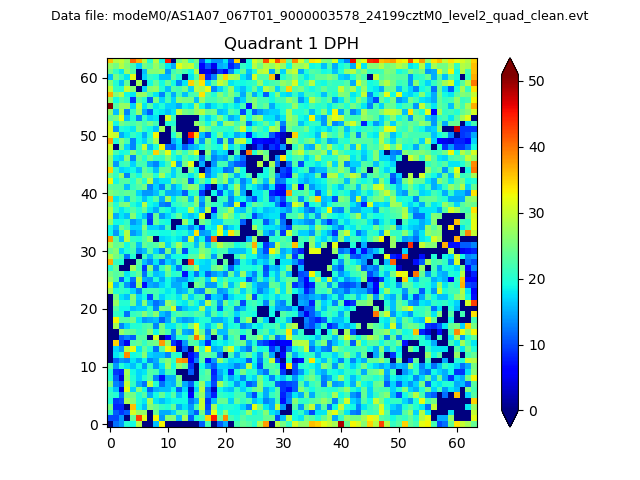
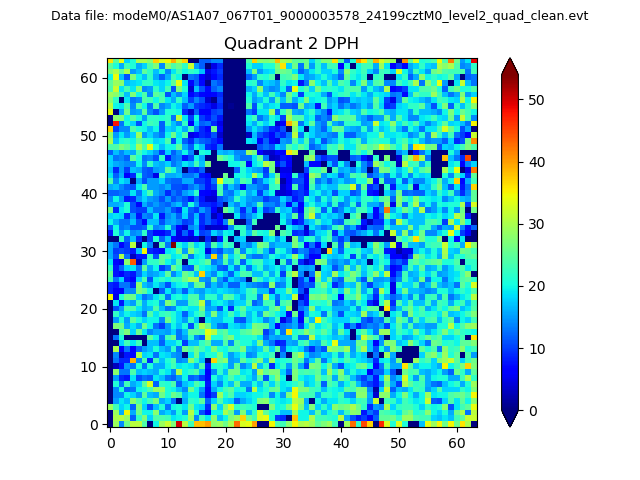
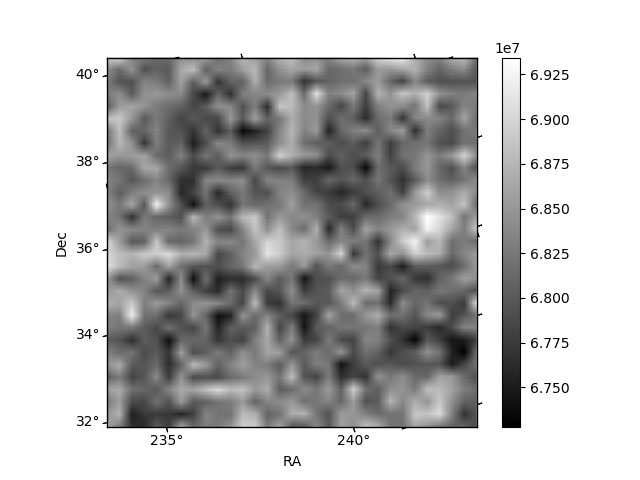
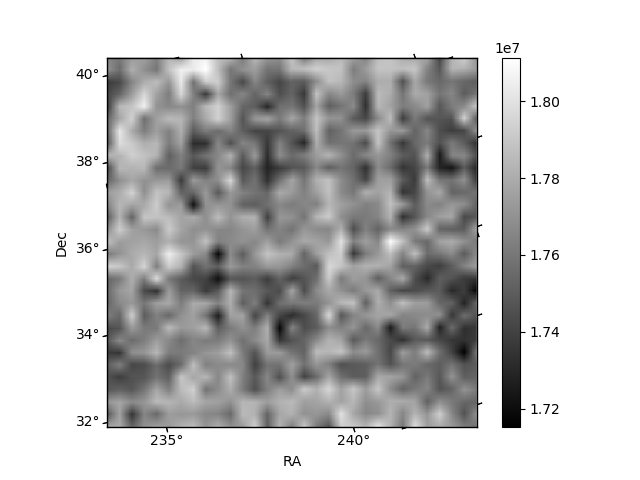
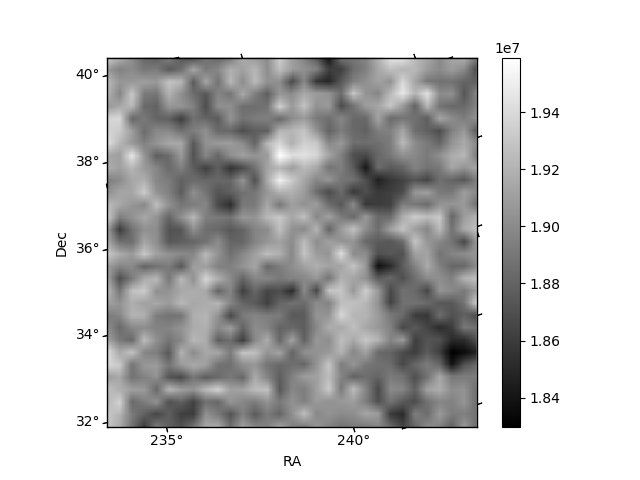
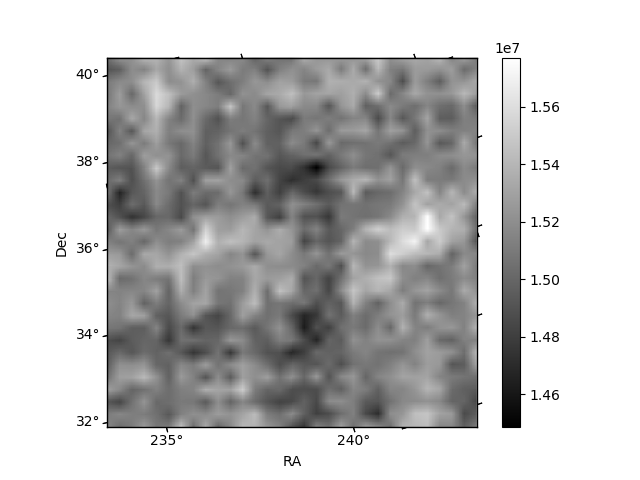
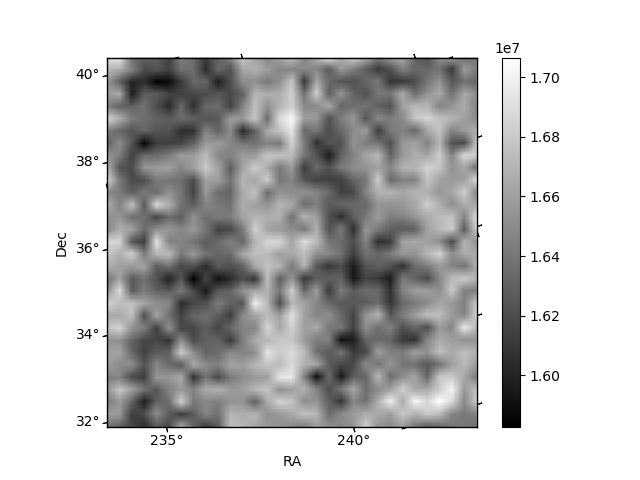
Histogram calculated using DETX and DETY for each event in the final _common_clean file
| Quadrant A | 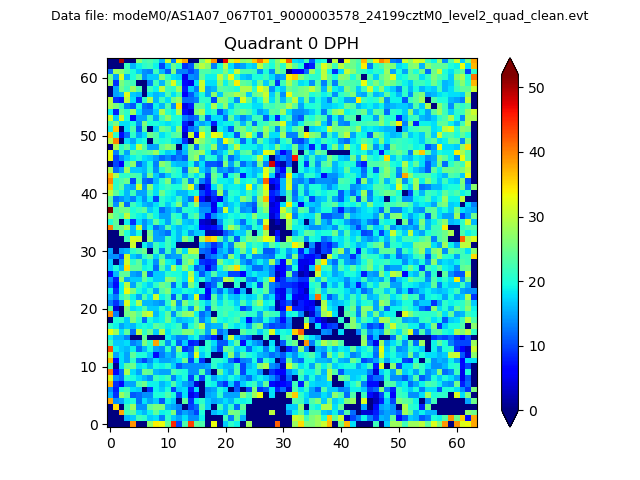 |
 |
Quadrant B |
|---|---|---|---|
| Quadrant D | 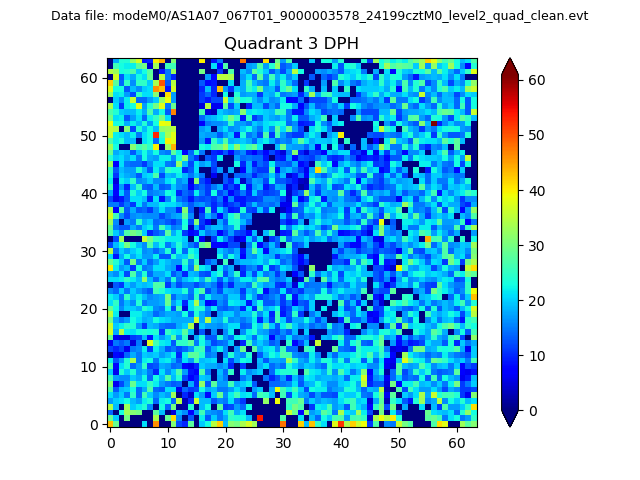 |
 |
Quadrant C |
| Plot type | Count rate plots | Images |
|---|---|---|
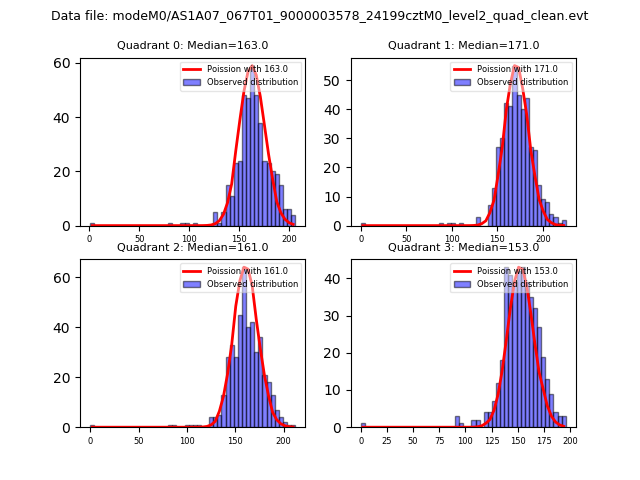
| Comparison with Poisson distribution Blue bars denote a histogram of data divided into 1 sec bins. Red curve is a Poisson curve with rate = median count rate of data. |
 |
 |
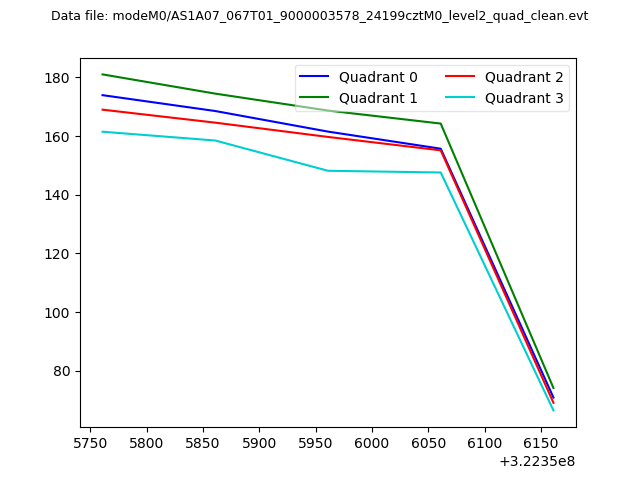
| Quadrant-wise count rates Data is divided into 100 sec bins |
 |
|
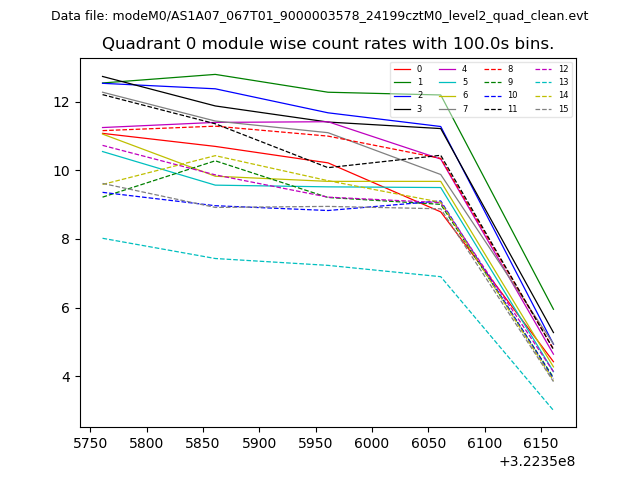
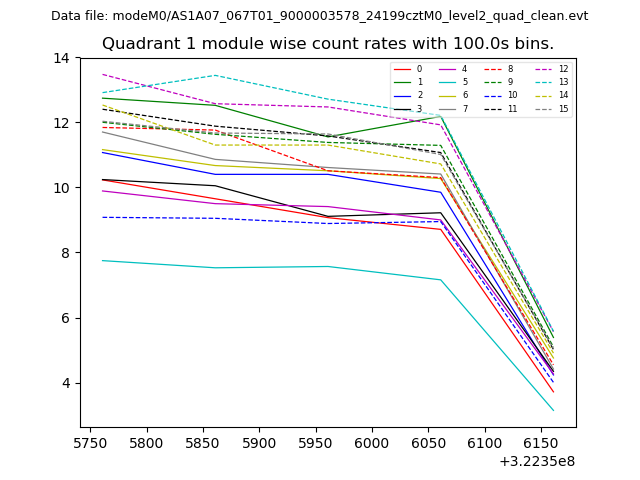
| Module-wise count rates for Quadrant A Data is divided into 100 sec bins |
 |
 |
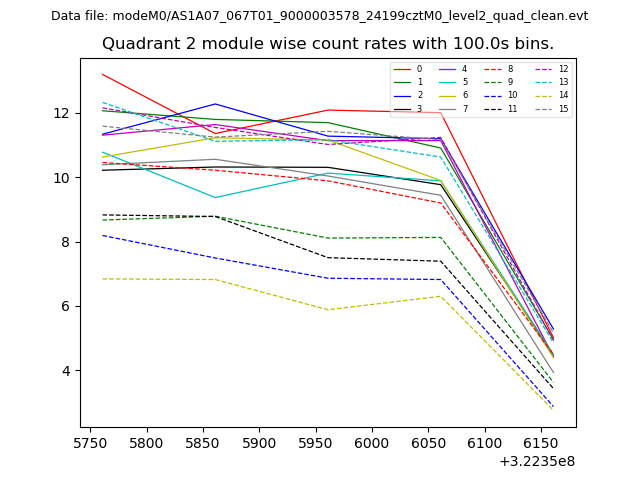
| Module-wise count rates for Quadrant B Data is divided into 100 sec bins |
 |
 |
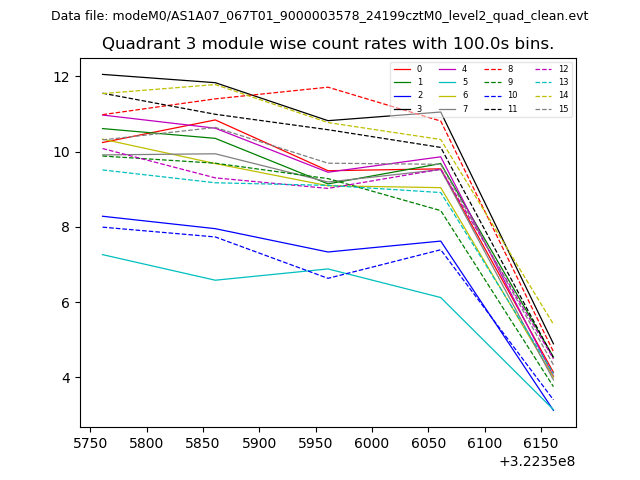
| Module-wise count rates for Quadrant C Data is divided into 100 sec bins |
 |
 |
| Module-wise count rates for Quadrant D Data is divided into 100 sec bins |
 |
 |
| Parameter | Plot |
|---|---|
| CZT HV Monitor | 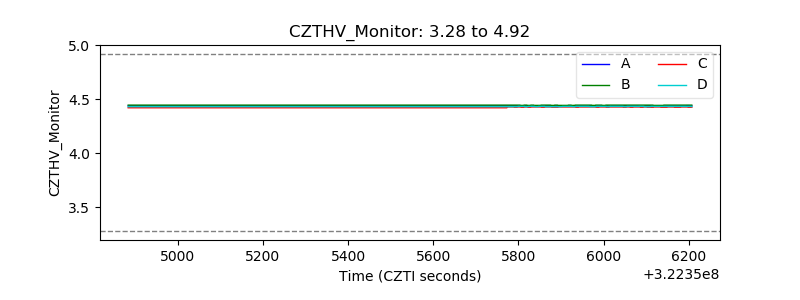 |
| D_VDD | 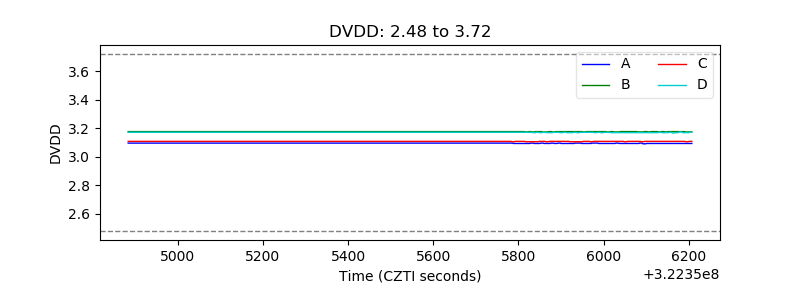 |
| Temperature 1 | 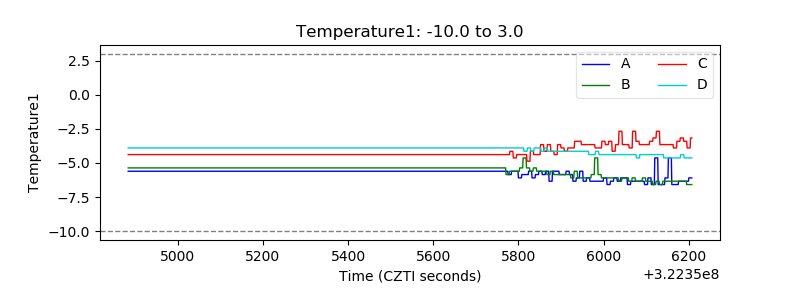 |
| Veto HV Monitor | 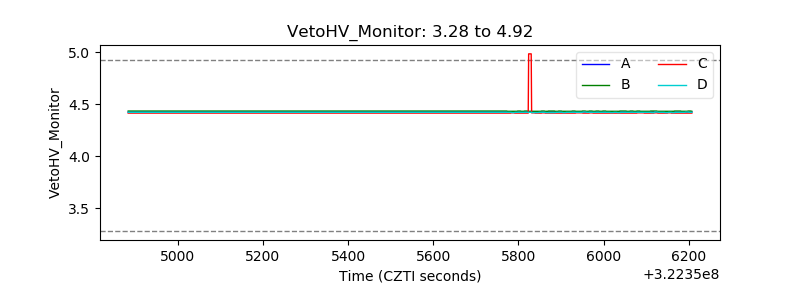 |
| Veto LLD | 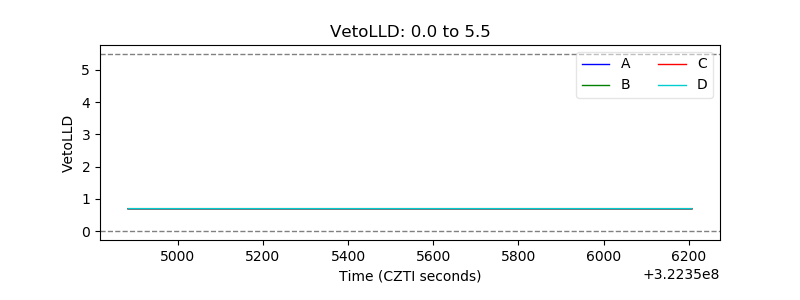 |
| Alpha Counter | 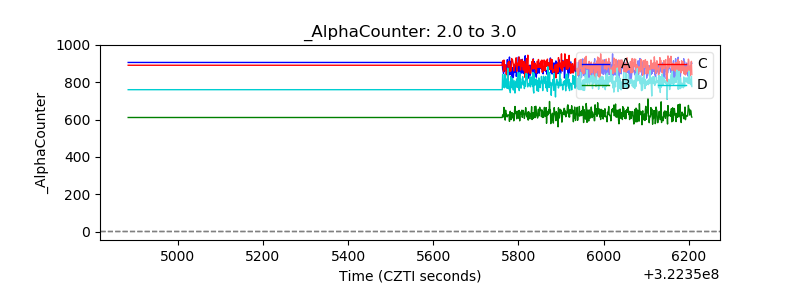 |
| _CPM_Rate | 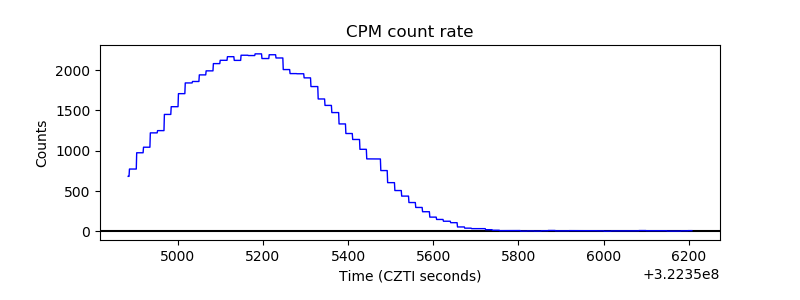 |
| CZT Counter | 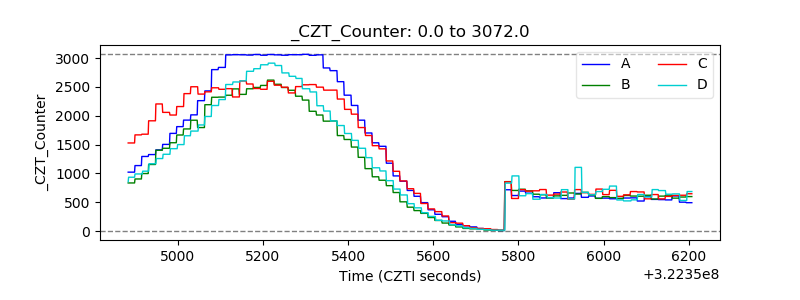 |
| +2.5 Volts monitor |  |
| +5 Volts monitor |  |
| _ROLL_ROT | 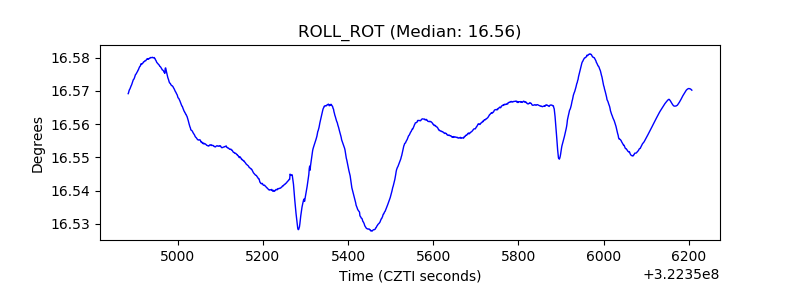 |
| _Roll_DEC | 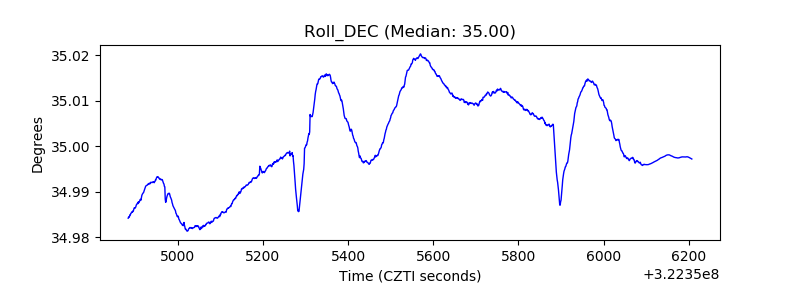 |
| _Roll_RA | 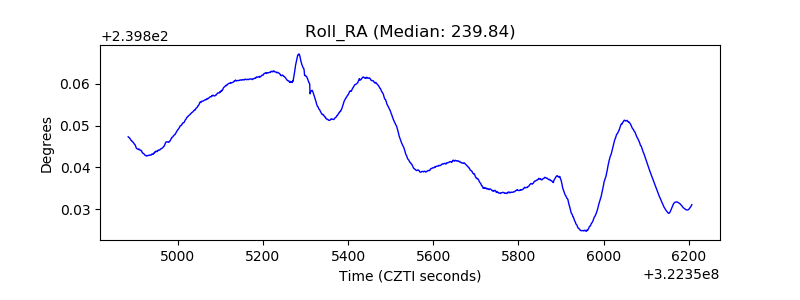 |
| Veto Counter | 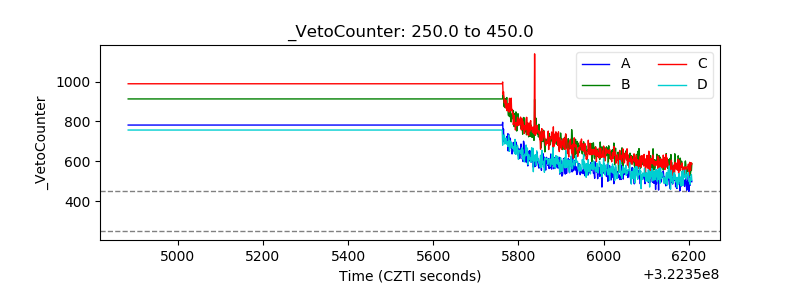 |