| Param | Original file | Final file |
|---|---|---|
| Filename | modeM0/AS1A07_160T05_9000003580cztM0_level2.fits | modeM0/AS1A07_160T05_9000003580cztM0_level2_quad_clean.evt |
| Size (bytes) | 501,946,560 | 436,124,160 |
| Size | 478.7 MB | 415.9 MB |
| Events in quadrant A | 3,175,000 | 2,645,100 |
| Events in quadrant B | 3,021,524 | 2,622,069 |
| Events in quadrant C | 2,974,836 | 2,341,586 |
| Events in quadrant D | 2,638,624 | 2,206,468 |
| Mode SS | |||
|---|---|---|---|
| Quadrant | BADHDUFLAG | Total packets | Discarded packets |
| A | 0 | 1006 | 0 |
| B | 0 | 1006 | 0 |
| C | 0 | 1006 | 0 |
| D | 0 | 1006 | 0 |
| Mode M9 | |||
|---|---|---|---|
| Quadrant | BADHDUFLAG | Total packets | Discarded packets |
| A | 0 | 81 | 0 |
| B | 0 | 81 | 0 |
| C | 0 | 81 | 0 |
| D | 0 | 81 | 0 |
| Mode M0 | |||
|---|---|---|---|
| Quadrant | BADHDUFLAG | Total packets | Discarded packets |
| A | 0 | 102949 | 0 |
| B | 0 | 103047 | 0 |
| C | 0 | 114361 | 0 |
| D | 0 | 120767 | 0 |
| Quadrant | Total seconds | Saturated seconds | Saturation percentage |
|---|---|---|---|
| A | 49426 | 744 | 1.505281% |
| B | 49426 | 834 | 1.687371% |
| C | 49426 | 1852 | 3.747016% |
| D | 49426 | 1005 | 2.033343% |
Noise dominated data is calculated using 1-second bins in cleaned event files. If a bin has >2000 counts, and if more than 50% of those come from <1% of pixels, then it is considered to be noise-dominated and hence unusable.
| Quadrant | # 1 sec bins | Bins with >0 counts | Bins with >2000 counts | High rate bins dominated by noise | Noise dominated (total time) | Noise dominated (detector-on time) | Marked lightcurve |
|---|---|---|---|---|---|---|---|
| A | 57486 | 49422 | 0 | 0 | 0.00% | 0.00% |  |
| B | 57486 | 49421 | 0 | 0 | 0.00% | 0.00% |  |
| C | 57486 | 49396 | 0 | 0 | 0.00% | 0.00% |  |
| D | 57486 | 49423 | 0 | 0 | 0.00% | 0.00% |  |
Top three noisy pixels from each quadrant. If the there are fewer than three noisy pixels in the level2.evt file, extra rows are filled as -1
| Pixel properties | Quadrant properties | ||||||
|---|---|---|---|---|---|---|---|
| Quadrant | DetID | PixID | Counts | Sigma | Mean | Median | Sigma |
| A | 0 | 29 | 2993 | 10.93 | 826 | 780 | 202.4 |
| A | 7 | 110 | 2452 | 8.26 | 826 | 780 | 202.4 |
| A | 9 | 19 | 2401 | 8.01 | 826 | 780 | 202.4 |
| B | 2 | 9 | 2384 | 10.4 | 800 | 768 | 155.4 |
| B | 2 | 8 | 2023 | 8.08 | 800 | 768 | 155.4 |
| B | 5 | 128 | 1990 | 7.87 | 800 | 768 | 155.4 |
| C | 12 | 241 | 2073 | 6.66 | 786 | 738 | 200.4 |
| C | 3 | 126 | 2065 | 6.62 | 786 | 738 | 200.4 |
| C | 12 | 250 | 1989 | 6.24 | 786 | 738 | 200.4 |
| D | 3 | 14 | 1909 | 6.04 | 754 | 687 | 202.2 |
| D | 15 | 46 | 1884 | 5.92 | 754 | 687 | 202.2 |
| D | 6 | 231 | 1873 | 5.87 | 754 | 687 | 202.2 |
Histogram calculated using DETX and DETY for each event in the final _common_clean file
| Quadrant A |  |
 |
Quadrant B |
|---|---|---|---|
| Quadrant D | 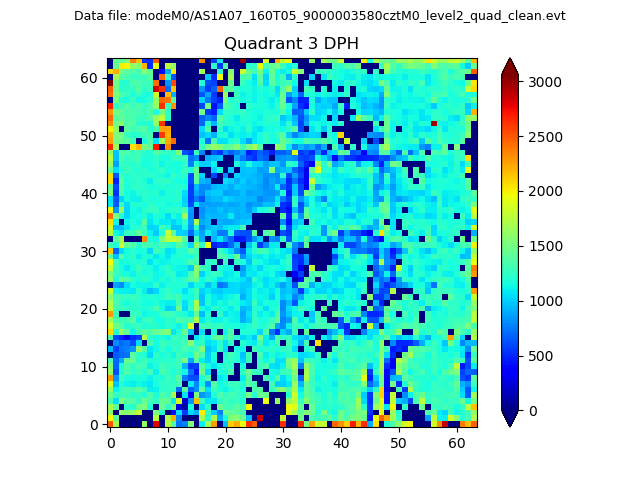 |
 |
Quadrant C |
| Plot type | Count rate plots | Images |
|---|---|---|
| Comparison with Poisson distribution Blue bars denote a histogram of data divided into 1 sec bins. Red curve is a Poisson curve with rate = median count rate of data. |
 |
 |
| Quadrant-wise count rates Data is divided into 100 sec bins |
 |
|
| Module-wise count rates for Quadrant A Data is divided into 100 sec bins |
 |
 |
| Module-wise count rates for Quadrant B Data is divided into 100 sec bins |
 |
 |
| Module-wise count rates for Quadrant C Data is divided into 100 sec bins |
 |
 |
| Module-wise count rates for Quadrant D Data is divided into 100 sec bins |
 |
 |
| Parameter | Plot |
|---|---|
| CZT HV Monitor |  |
| D_VDD |  |
| Temperature 1 |  |
| Veto HV Monitor |  |
| Veto LLD |  |
| Alpha Counter |  |
| _CPM_Rate |  |
| CZT Counter |  |
| +2.5 Volts monitor |  |
| +5 Volts monitor |  |
| _ROLL_ROT |  |
| _Roll_DEC |  |
| _Roll_RA |  |
| Veto Counter |  |