| Param | Original file | Final file |
|---|---|---|
| Filename | modeM0/AS1A07_160T05_9000003580_24199cztM0_level2.evt | modeM0/AS1A07_160T05_9000003580_24199cztM0_level2_quad_clean.evt |
| Size (bytes) | 330,269,760 | 71,101,440 |
| Size | 315.0 MB | 67.8 MB |
| Events in quadrant A | 2,358,326 | 461,691 |
| Events in quadrant B | 2,398,500 | 471,587 |
| Events in quadrant C | 2,568,498 | 439,172 |
| Events in quadrant D | 2,336,445 | 430,194 |
| Mode SS | |||
|---|---|---|---|
| Quadrant | BADHDUFLAG | Total packets | Discarded packets |
| A | 0 | 102 | 0 |
| B | 0 | 102 | 0 |
| C | 0 | 102 | 0 |
| D | 0 | 102 | 0 |
| Mode M9 | |||
|---|---|---|---|
| Quadrant | BADHDUFLAG | Total packets | Discarded packets |
| A | 0 | 12 | 0 |
| B | 0 | 12 | 0 |
| C | 0 | 12 | 0 |
| D | 0 | 12 | 0 |
| Mode M0 | |||
|---|---|---|---|
| Quadrant | BADHDUFLAG | Total packets | Discarded packets |
| A | 0 | 10272 | 1 |
| B | 0 | 10356 | 1 |
| C | 0 | 11030 | 1 |
| D | 0 | 10542 | 1 |
| Quadrant | Total seconds | Saturated seconds | Saturation percentage |
|---|---|---|---|
| A | 4995 | 14 | 0.280280% |
| B | 4995 | 26 | 0.520521% |
| C | 4995 | 52 | 1.041041% |
| D | 4995 | 21 | 0.420420% |
Noise dominated data is calculated using 1-second bins in cleaned event files. If a bin has >2000 counts, and if more than 50% of those come from <1% of pixels, then it is considered to be noise-dominated and hence unusable.
| Quadrant | # 1 sec bins | Bins with >0 counts | Bins with >2000 counts | High rate bins dominated by noise | Noise dominated (total time) | Noise dominated (detector-on time) | Marked lightcurve |
|---|---|---|---|---|---|---|---|
| A | 6205 | 4996 | 0 | 0 | 0.00% | 0.00% | 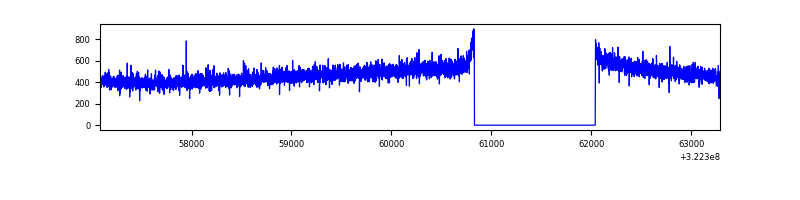 |
| B | 6205 | 4996 | 0 | 0 | 0.00% | 0.00% | 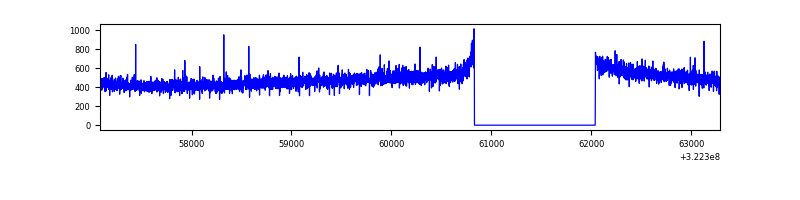 |
| C | 6205 | 4996 | 0 | 0 | 0.00% | 0.00% | 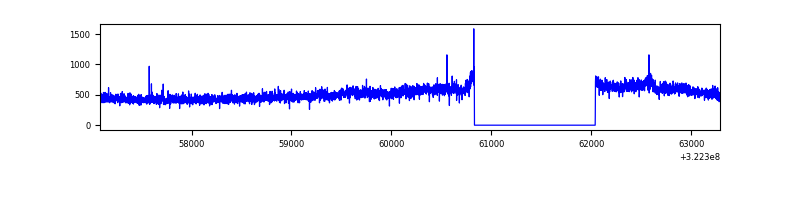 |
| D | 6205 | 4996 | 2 | 2 | 0.03% | 0.04% | 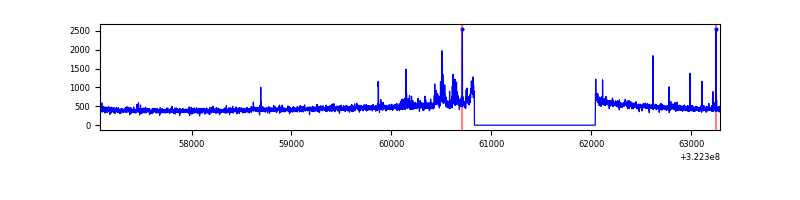 |
Top three noisy pixels from each quadrant. If the there are fewer than three noisy pixels in the level2.evt file, extra rows are filled as -1
| Pixel properties | Quadrant properties | ||||||
|---|---|---|---|---|---|---|---|
| Quadrant | DetID | PixID | Counts | Sigma | Mean | Median | Sigma |
| A | 13 | 254 | 7831 | 59.35 | 612 | 599 | 121.8 |
| A | 0 | 226 | 5340 | 38.91 | 612 | 599 | 121.8 |
| A | 3 | 137 | 5252 | 38.19 | 612 | 599 | 121.8 |
| B | 12 | 111 | 13775 | 114.64 | 611 | 597 | 114.9 |
| B | 11 | 111 | 12362 | 102.35 | 611 | 597 | 114.9 |
| B | 14 | 111 | 10991 | 90.42 | 611 | 597 | 114.9 |
| C | 7 | 247 | 175301 | 1279.14 | 585 | 590 | 136.6 |
| C | 14 | 238 | 93345 | 679.1 | 585 | 590 | 136.6 |
| C | 3 | 233 | 11629 | 80.82 | 585 | 590 | 136.6 |
| D | 8 | 195 | 75674 | 525.01 | 587 | 569 | 143.1 |
| D | 2 | 234 | 19460 | 132.05 | 587 | 569 | 143.1 |
| D | 12 | 218 | 16282 | 109.84 | 587 | 569 | 143.1 |
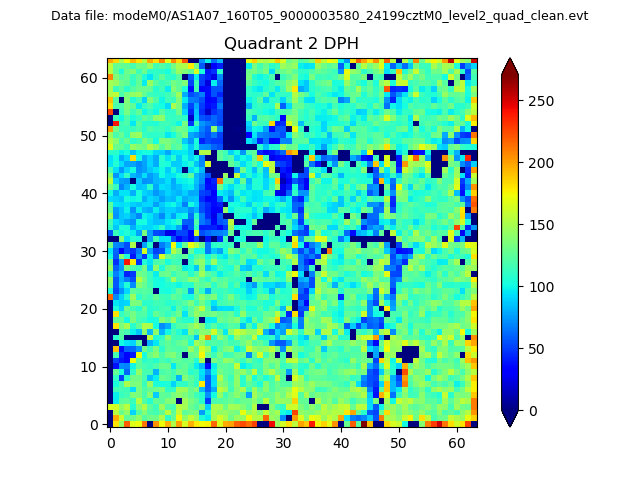
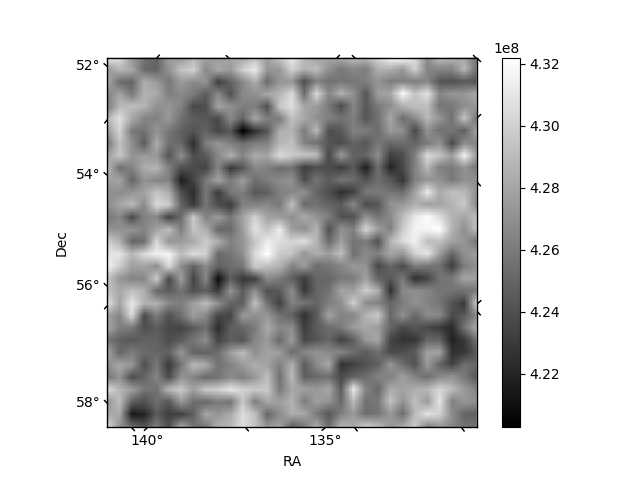
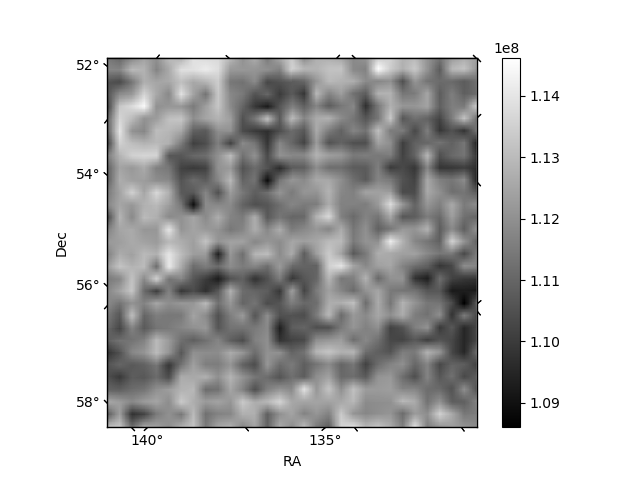
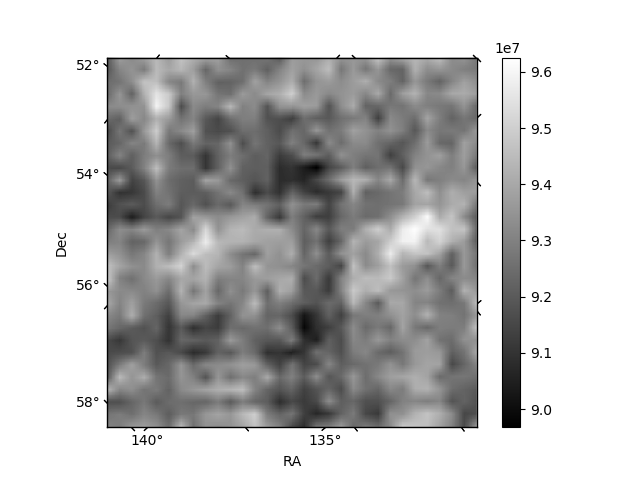
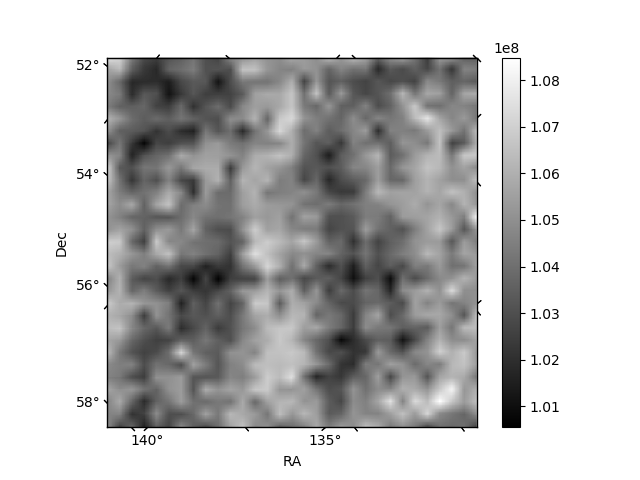
Histogram calculated using DETX and DETY for each event in the final _common_clean file
| Quadrant A | 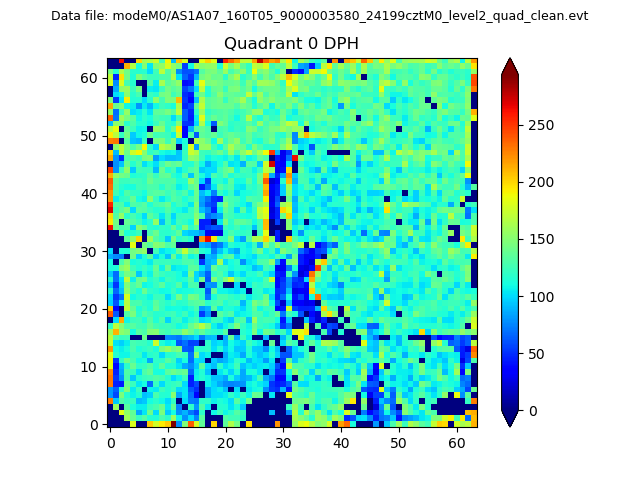 |
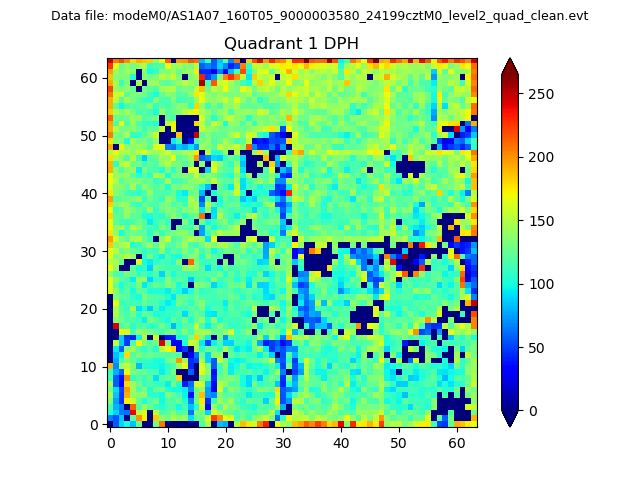 |
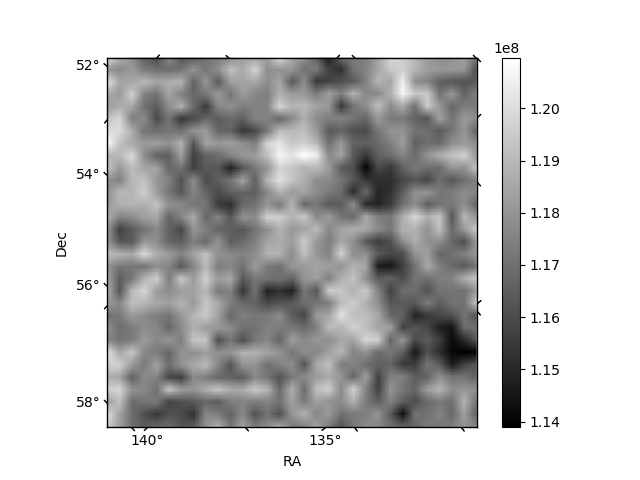
Quadrant B |
|---|---|---|---|
| Quadrant D | 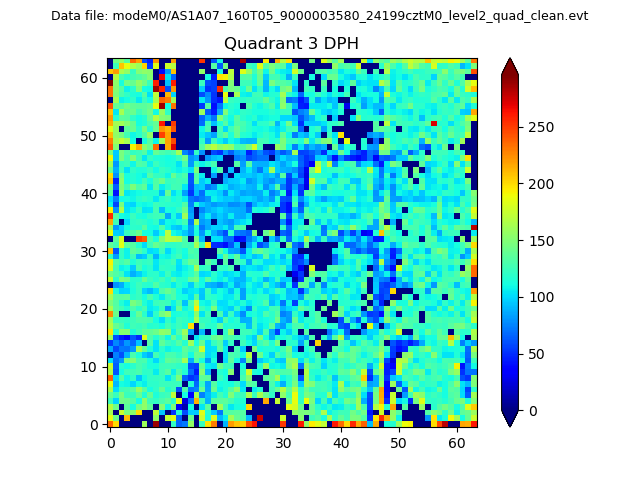 |
 |
Quadrant C |
| Plot type | Count rate plots | Images |
|---|---|---|
| Comparison with Poisson distribution Blue bars denote a histogram of data divided into 1 sec bins. Red curve is a Poisson curve with rate = median count rate of data. |
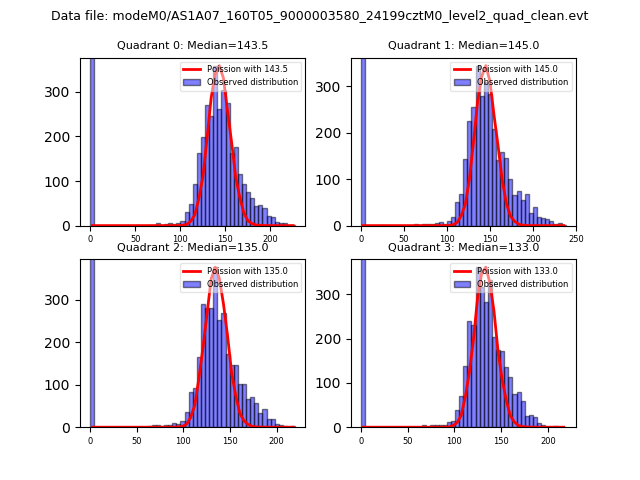 |
 |
| Quadrant-wise count rates Data is divided into 100 sec bins |
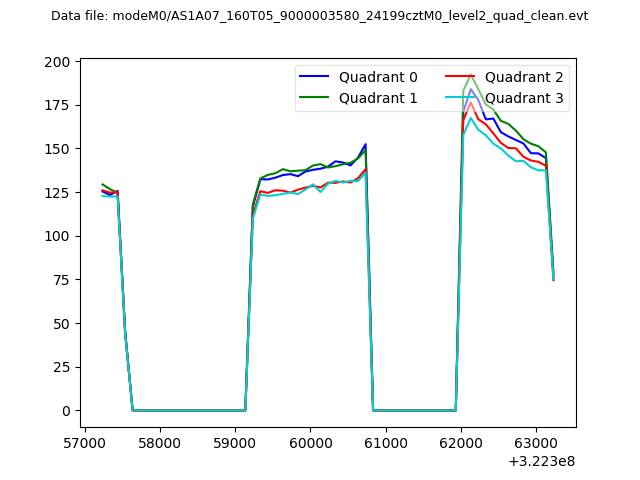 |
|
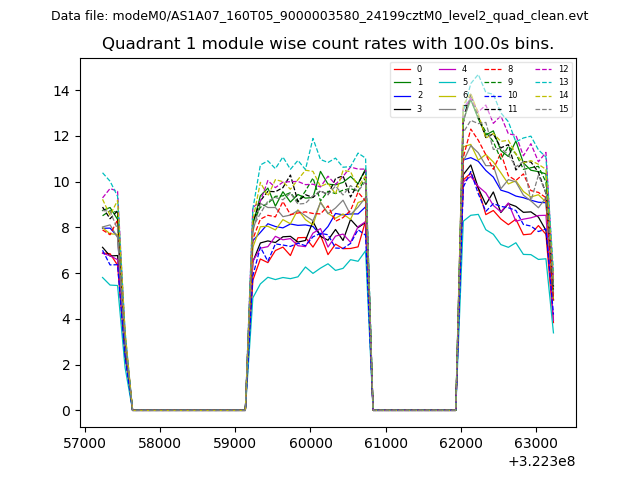
| Module-wise count rates for Quadrant A Data is divided into 100 sec bins |
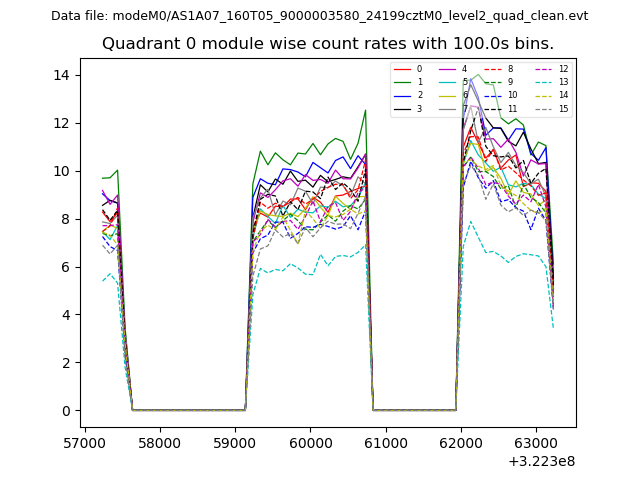 |
 |
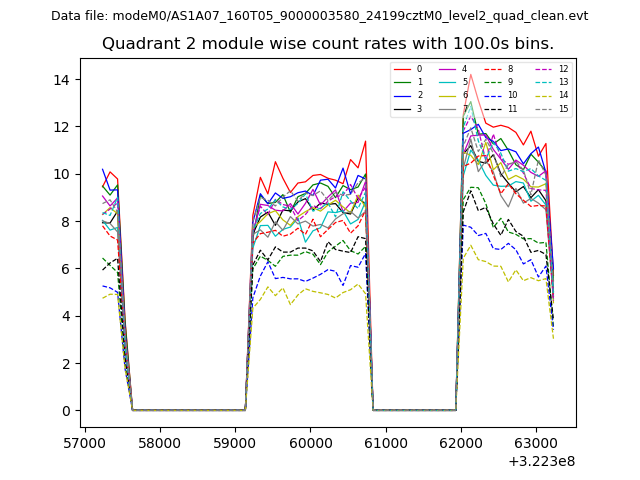
| Module-wise count rates for Quadrant B Data is divided into 100 sec bins |
 |
 |
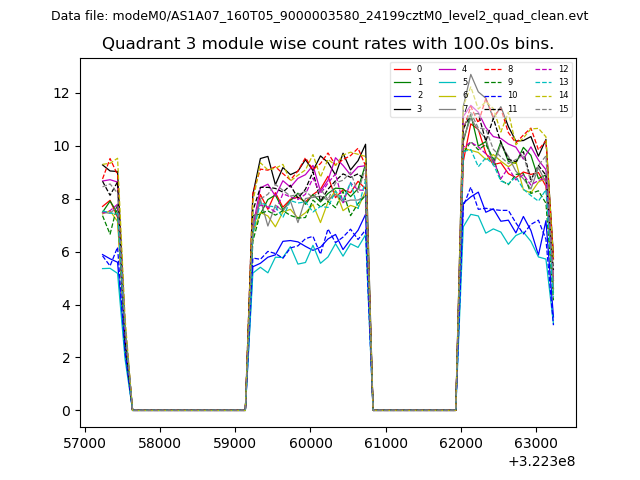
| Module-wise count rates for Quadrant C Data is divided into 100 sec bins |
 |
 |
| Module-wise count rates for Quadrant D Data is divided into 100 sec bins |
 |
 |
| Parameter | Plot |
|---|---|
| CZT HV Monitor | 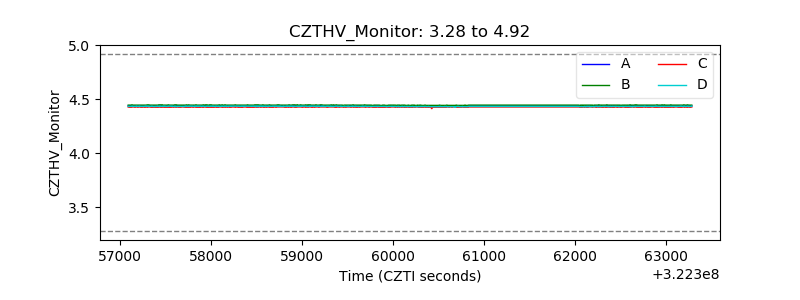 |
| D_VDD | 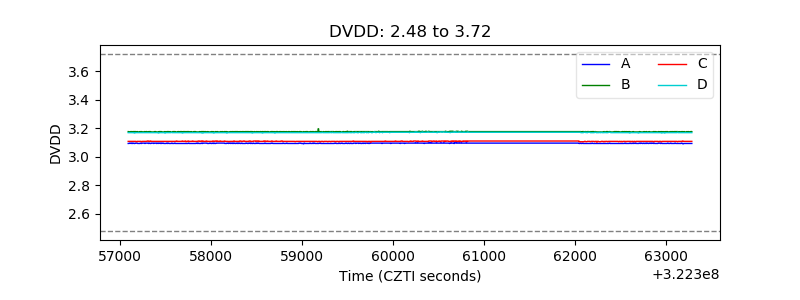 |
| Temperature 1 | 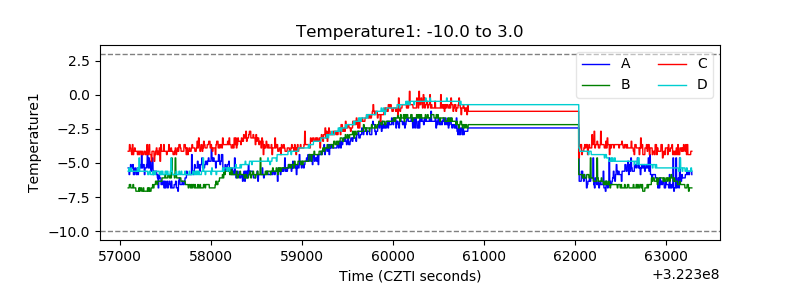 |
| Veto HV Monitor | 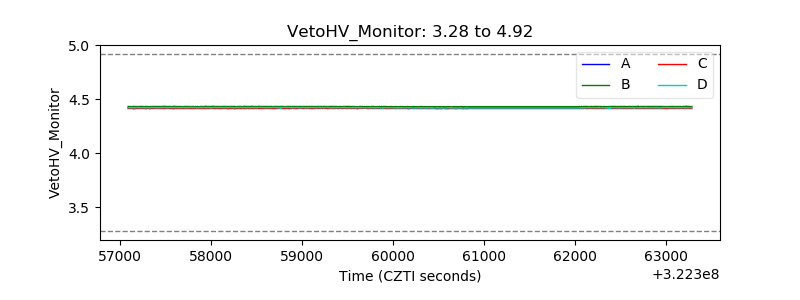 |
| Veto LLD | 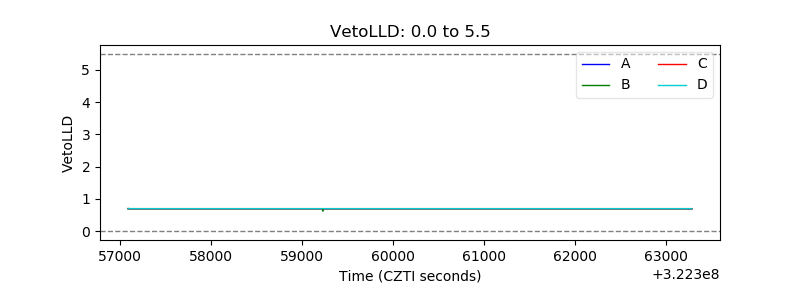 |
| Alpha Counter | 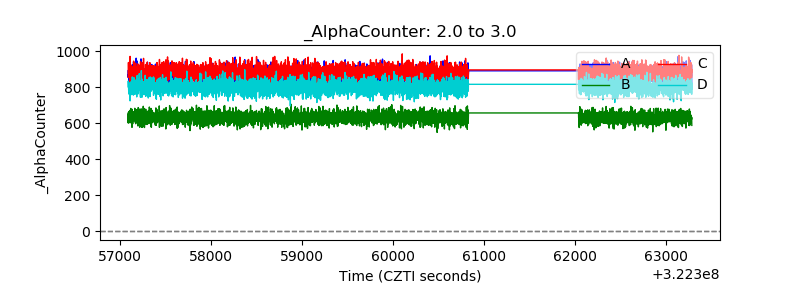 |
| _CPM_Rate | 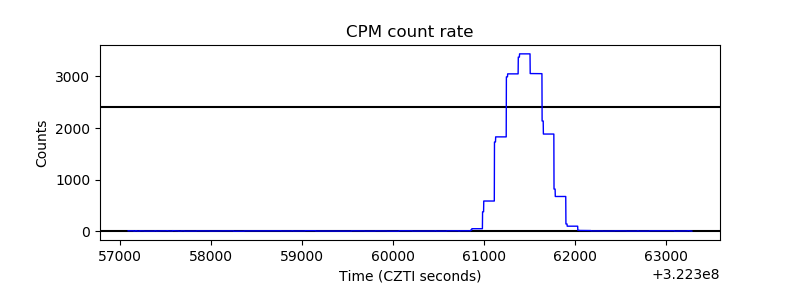 |
| CZT Counter | 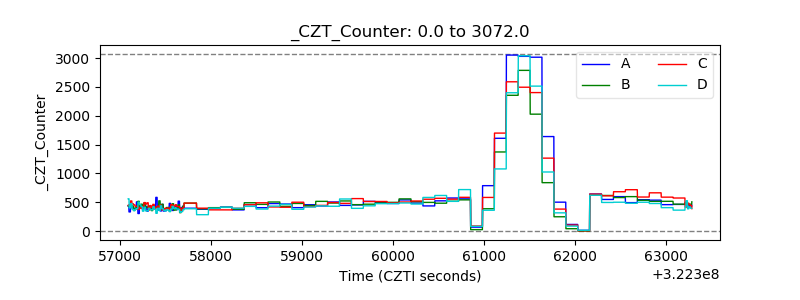 |
| +2.5 Volts monitor |  |
| +5 Volts monitor |  |
| _ROLL_ROT | 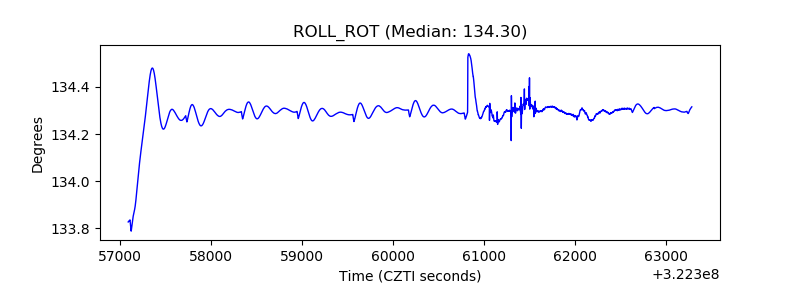 |
| _Roll_DEC |  |
| _Roll_RA | 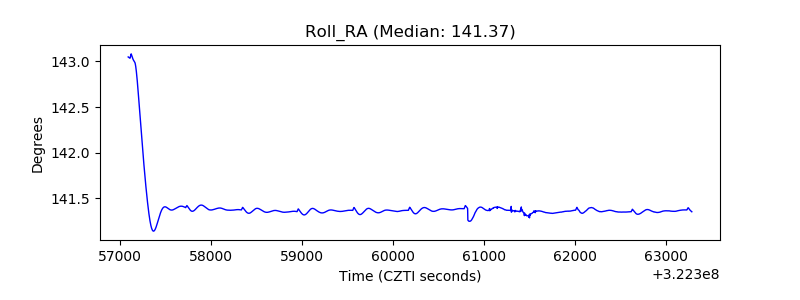 |
| Veto Counter | 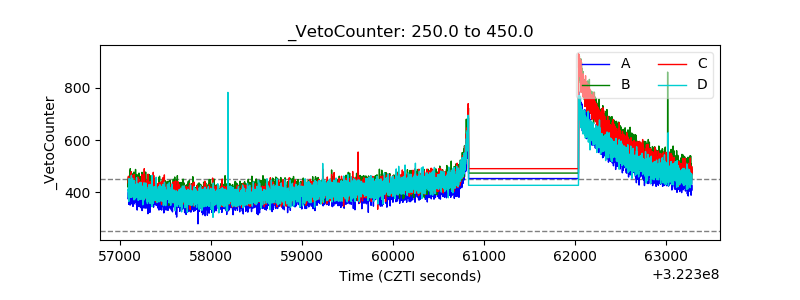 |