| Param | Original file | Final file |
|---|---|---|
| Filename | modeM0/AS1A07_160T05_9000003580_24200cztM0_level2.evt | modeM0/AS1A07_160T05_9000003580_24200cztM0_level2_quad_clean.evt |
| Size (bytes) | 445,443,840 | 102,576,960 |
| Size | 424.8 MB | 97.8 MB |
| Events in quadrant A | 3,155,364 | 685,885 |
| Events in quadrant B | 3,222,909 | 700,922 |
| Events in quadrant C | 3,453,493 | 651,882 |
| Events in quadrant D | 3,230,359 | 628,253 |
| Mode SS | |||
|---|---|---|---|
| Quadrant | BADHDUFLAG | Total packets | Discarded packets |
| A | 0 | 132 | 0 |
| B | 0 | 132 | 0 |
| C | 0 | 132 | 0 |
| D | 0 | 132 | 0 |
| Mode M9 | |||
|---|---|---|---|
| Quadrant | BADHDUFLAG | Total packets | Discarded packets |
| A | 0 | 24 | 0 |
| B | 0 | 24 | 0 |
| C | 0 | 24 | 0 |
| D | 0 | 24 | 0 |
| Mode M0 | |||
|---|---|---|---|
| Quadrant | BADHDUFLAG | Total packets | Discarded packets |
| A | 0 | 13239 | 2 |
| B | 0 | 13452 | 2 |
| C | 0 | 14156 | 2 |
| D | 0 | 13762 | 3 |
| Quadrant | Total seconds | Saturated seconds | Saturation percentage |
|---|---|---|---|
| A | 6293 | 31 | 0.492611% |
| B | 6294 | 53 | 0.842072% |
| C | 6294 | 79 | 1.255164% |
| D | 6293 | 79 | 1.255363% |
Noise dominated data is calculated using 1-second bins in cleaned event files. If a bin has >2000 counts, and if more than 50% of those come from <1% of pixels, then it is considered to be noise-dominated and hence unusable.
| Quadrant | # 1 sec bins | Bins with >0 counts | Bins with >2000 counts | High rate bins dominated by noise | Noise dominated (total time) | Noise dominated (detector-on time) | Marked lightcurve |
|---|---|---|---|---|---|---|---|
| A | 8798 | 6295 | 0 | 0 | 0.00% | 0.00% | 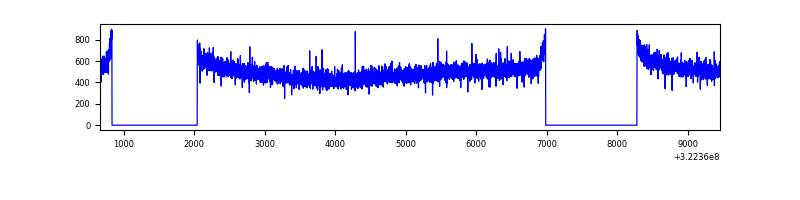 |
| B | 8799 | 6296 | 0 | 0 | 0.00% | 0.00% | 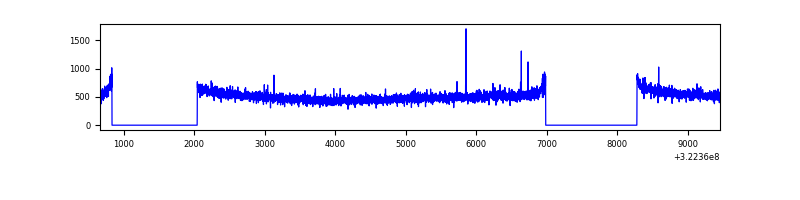 |
| C | 8799 | 6296 | 1 | 1 | 0.01% | 0.02% | 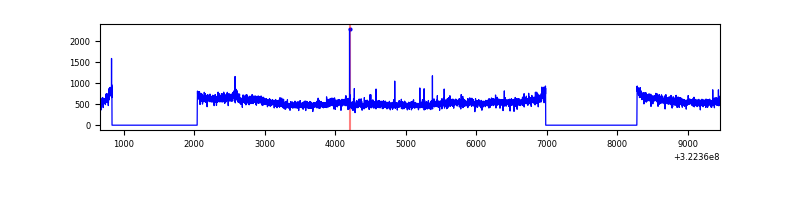 |
| D | 8798 | 6295 | 51 | 51 | 0.58% | 0.81% | 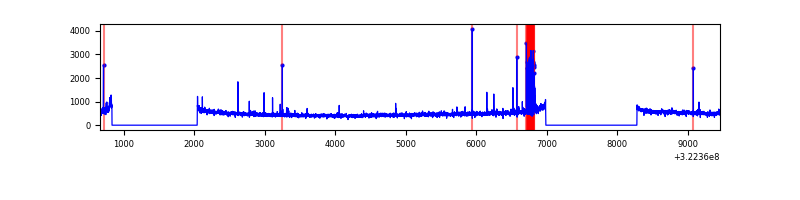 |
Top three noisy pixels from each quadrant. If the there are fewer than three noisy pixels in the level2.evt file, extra rows are filled as -1
| Pixel properties | Quadrant properties | ||||||
|---|---|---|---|---|---|---|---|
| Quadrant | DetID | PixID | Counts | Sigma | Mean | Median | Sigma |
| A | 13 | 254 | 10401 | 58.91 | 818 | 803 | 162.9 |
| A | 0 | 226 | 7157 | 39.0 | 818 | 803 | 162.9 |
| A | 3 | 137 | 6878 | 37.29 | 818 | 803 | 162.9 |
| B | 12 | 111 | 18032 | 112.61 | 821 | 801 | 153.0 |
| B | 11 | 111 | 15930 | 98.87 | 821 | 801 | 153.0 |
| B | 14 | 111 | 14381 | 88.75 | 821 | 801 | 153.0 |
| C | 7 | 247 | 248265 | 1378.06 | 781 | 788 | 179.6 |
| C | 14 | 238 | 126460 | 699.79 | 781 | 788 | 179.6 |
| C | 3 | 233 | 24574 | 132.45 | 781 | 788 | 179.6 |
| D | 7 | 38 | 127752 | 675.98 | 777 | 753 | 187.9 |
| D | 8 | 195 | 102884 | 543.62 | 777 | 753 | 187.9 |
| D | 7 | 238 | 27077 | 140.12 | 777 | 753 | 187.9 |
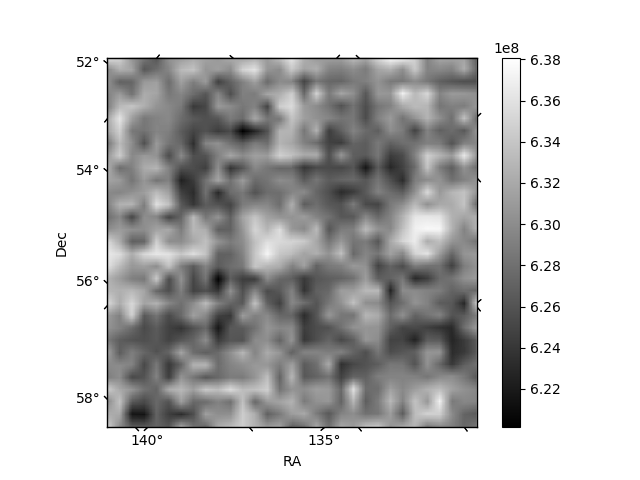
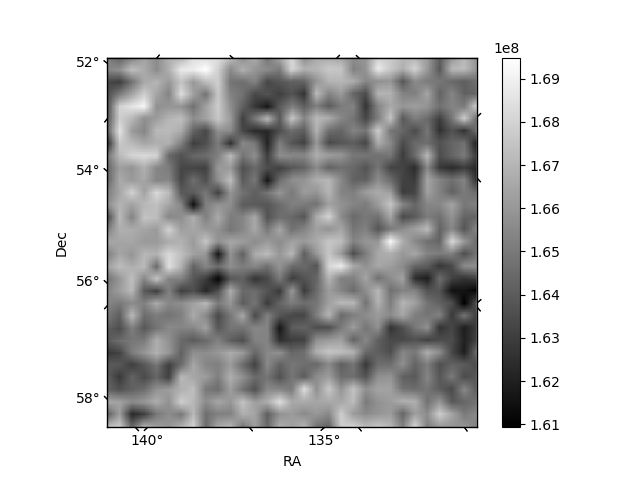
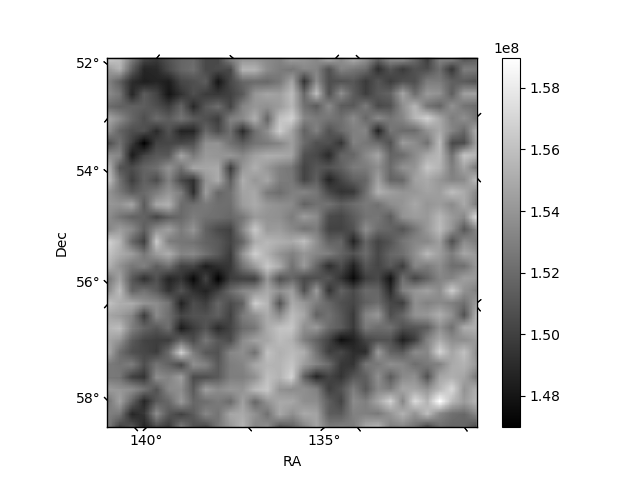
Histogram calculated using DETX and DETY for each event in the final _common_clean file
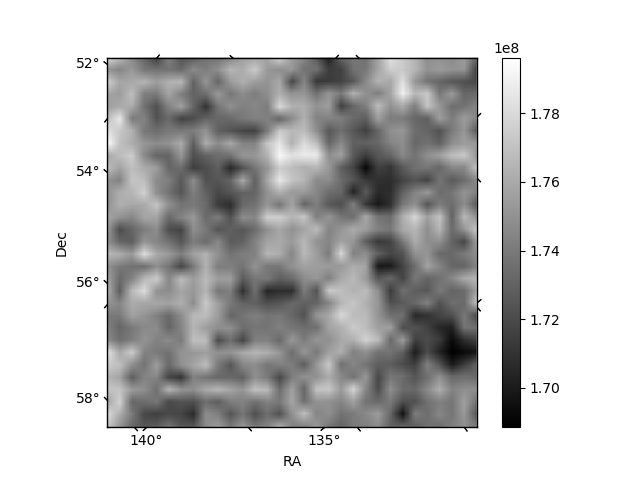
| Quadrant A | 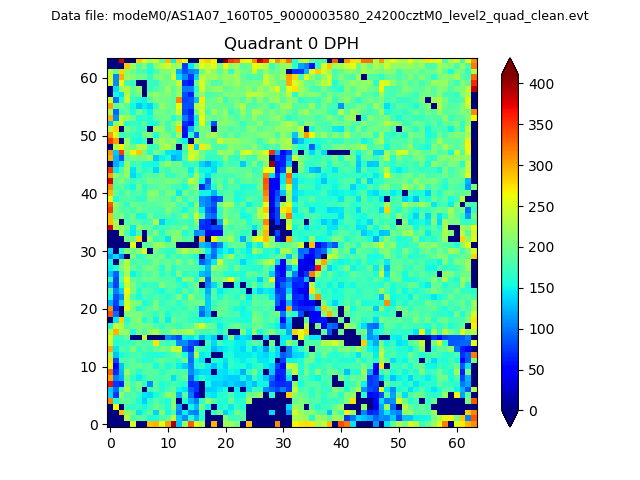 |
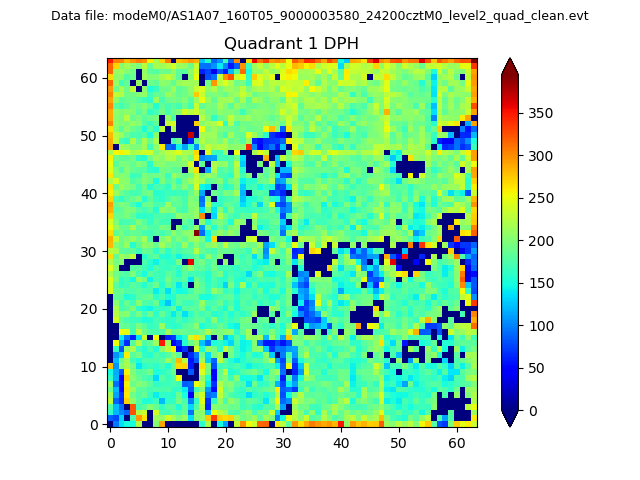 |
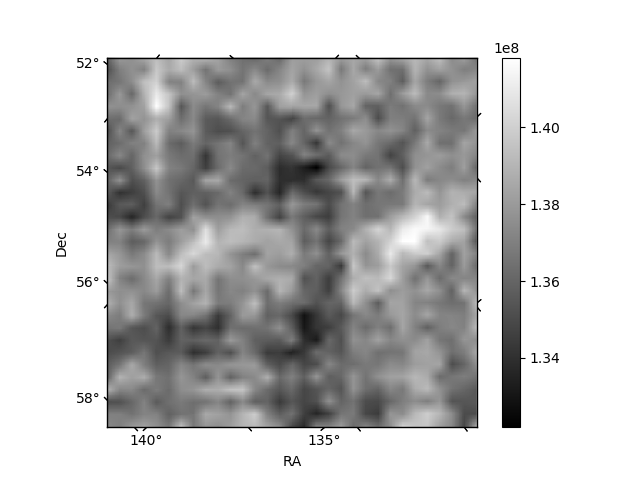
Quadrant B |
|---|---|---|---|
| Quadrant D | 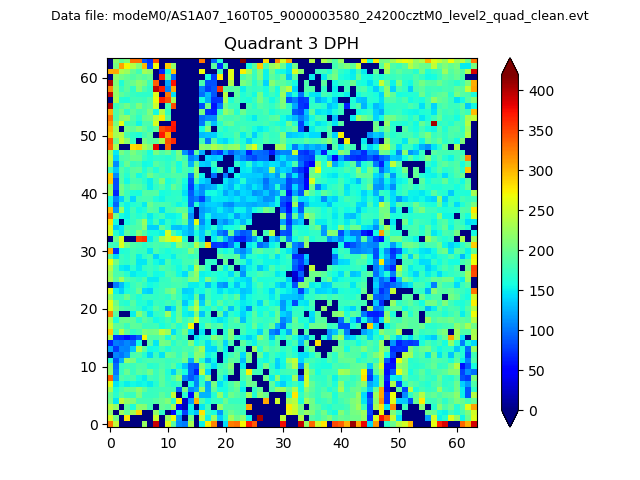 |
 |
Quadrant C |
| Plot type | Count rate plots | Images |
|---|---|---|
| Comparison with Poisson distribution Blue bars denote a histogram of data divided into 1 sec bins. Red curve is a Poisson curve with rate = median count rate of data. |
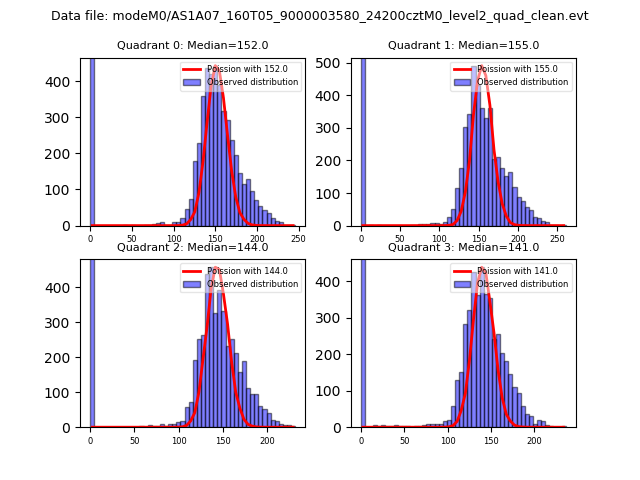 |
 |
| Quadrant-wise count rates Data is divided into 100 sec bins |
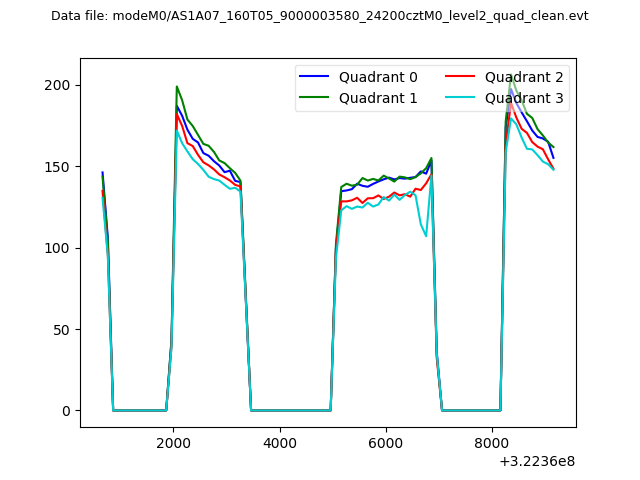 |
|
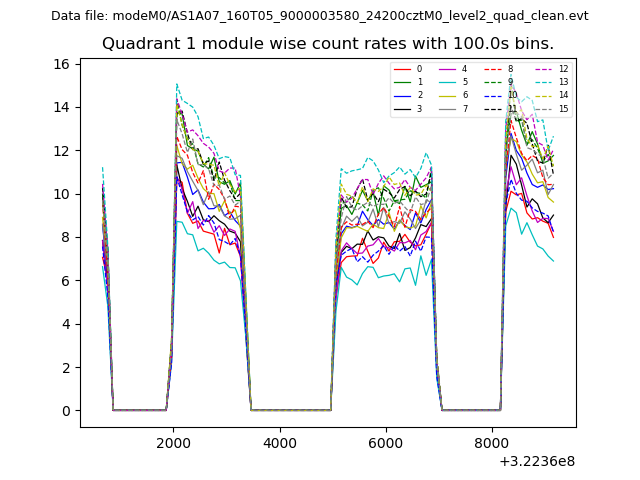
| Module-wise count rates for Quadrant A Data is divided into 100 sec bins |
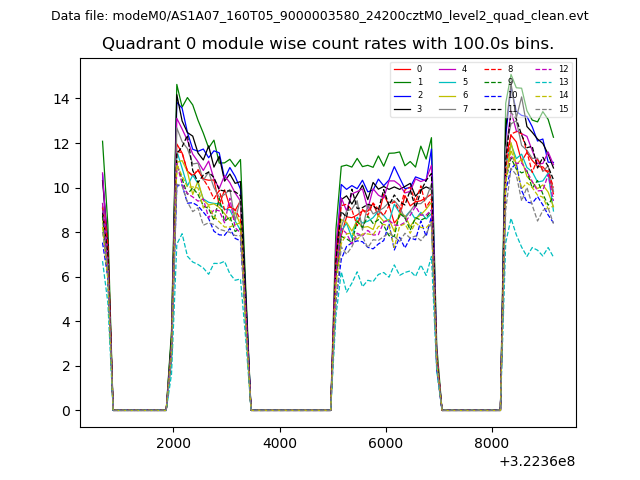 |
 |
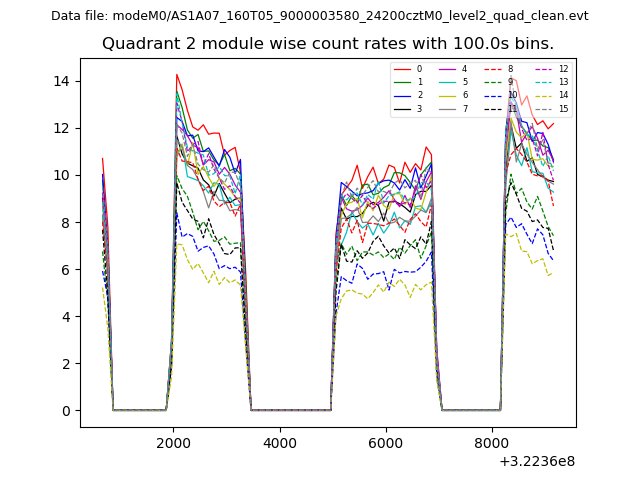
| Module-wise count rates for Quadrant B Data is divided into 100 sec bins |
 |
 |
| Module-wise count rates for Quadrant C Data is divided into 100 sec bins |
 |
 |
| Module-wise count rates for Quadrant D Data is divided into 100 sec bins |
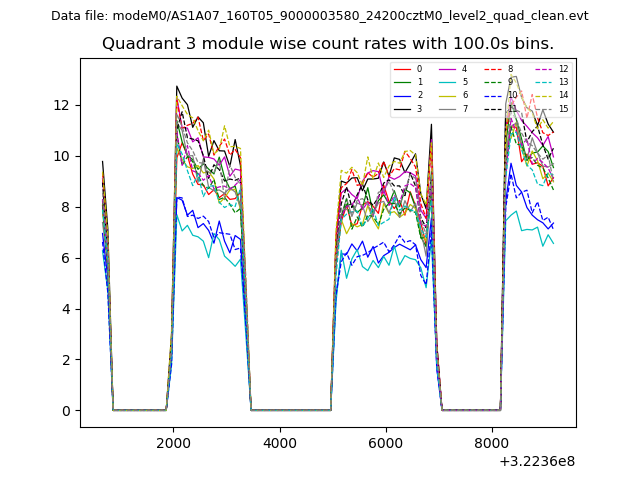 |
 |
| Parameter | Plot |
|---|---|
| CZT HV Monitor | 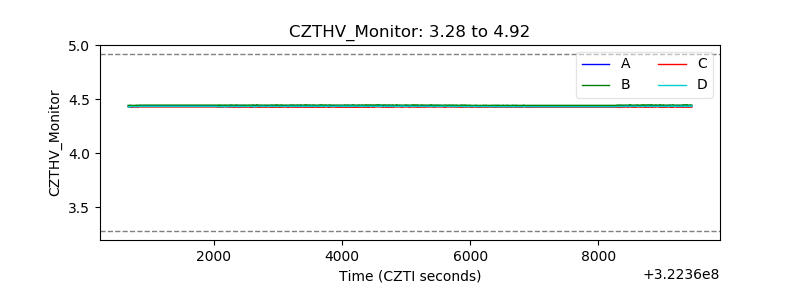 |
| D_VDD | 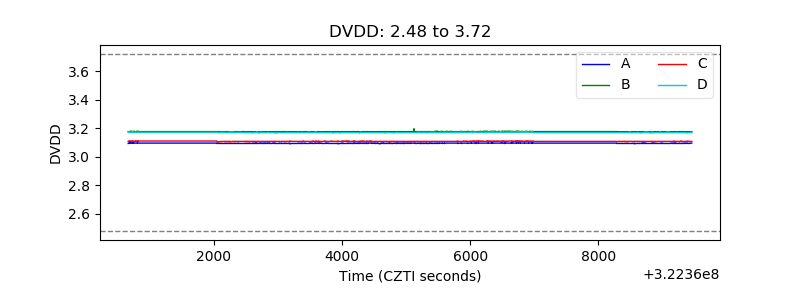 |
| Temperature 1 |  |
| Veto HV Monitor |  |
| Veto LLD | 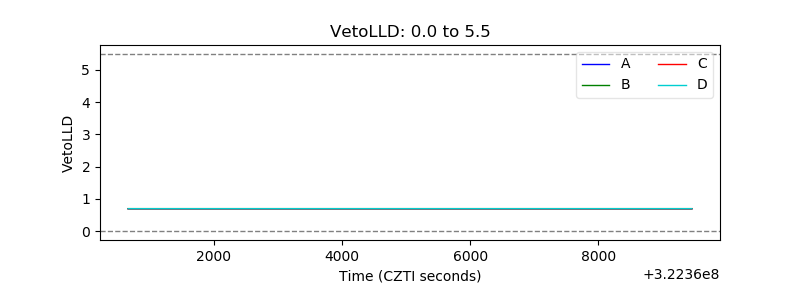 |
| Alpha Counter | 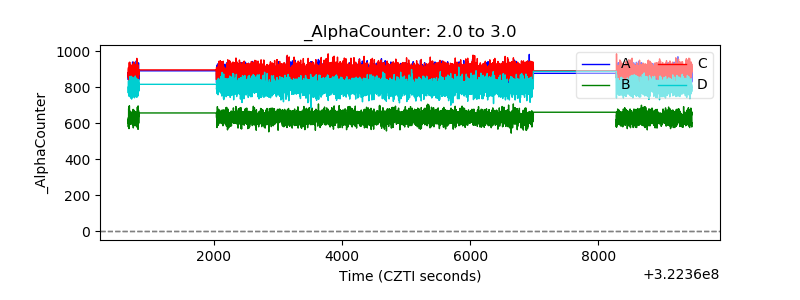 |
| _CPM_Rate | 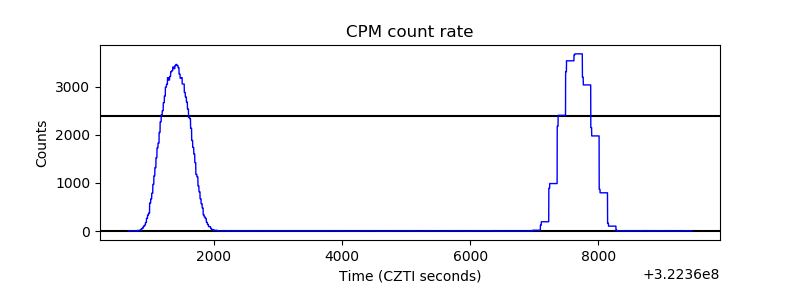 |
| CZT Counter | 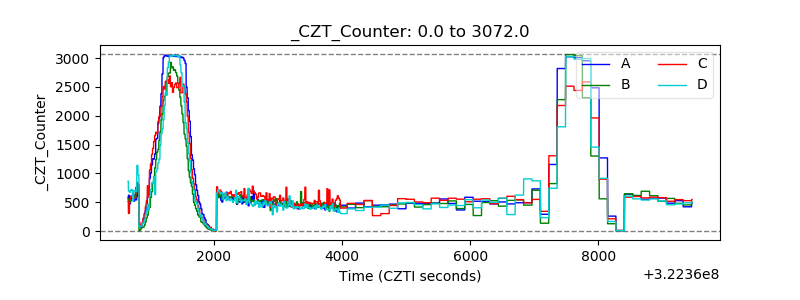 |
| +2.5 Volts monitor |  |
| +5 Volts monitor |  |
| _ROLL_ROT | 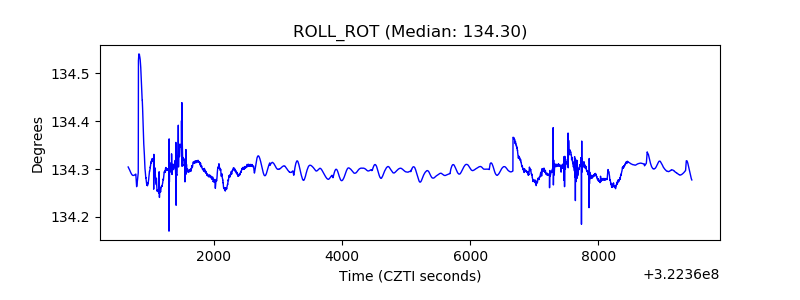 |
| _Roll_DEC |  |
| _Roll_RA | 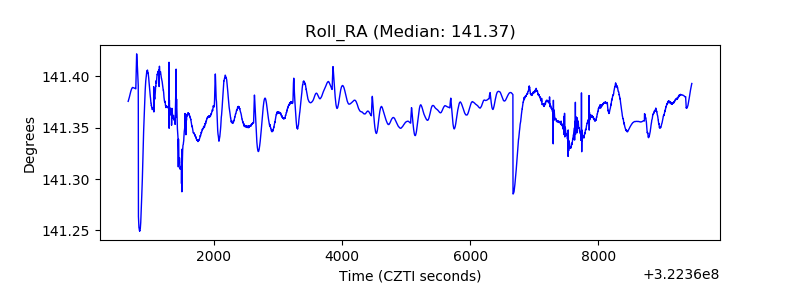 |
| Veto Counter | 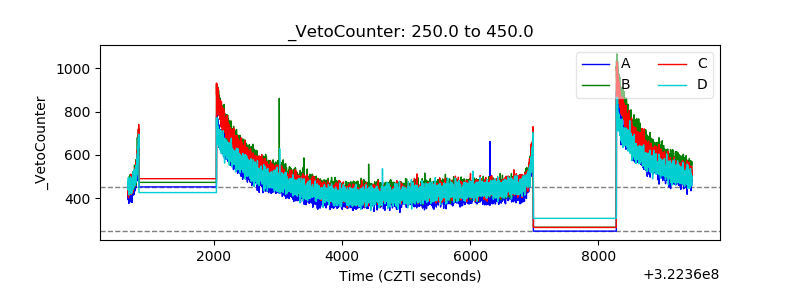 |