| Param | Original file | Final file |
|---|---|---|
| Filename | modeM0/AS1A07_160T05_9000003580_24202cztM0_level2.evt | modeM0/AS1A07_160T05_9000003580_24202cztM0_level2_quad_clean.evt |
| Size (bytes) | 481,633,920 | 83,220,480 |
| Size | 459.3 MB | 79.4 MB |
| Events in quadrant A | 3,419,306 | 540,777 |
| Events in quadrant B | 3,314,408 | 551,085 |
| Events in quadrant C | 3,648,292 | 504,455 |
| Events in quadrant D | 3,782,576 | 489,850 |
| Mode SS | |||
|---|---|---|---|
| Quadrant | BADHDUFLAG | Total packets | Discarded packets |
| A | 0 | 126 | 0 |
| B | 0 | 126 | 0 |
| C | 0 | 126 | 0 |
| D | 0 | 126 | 0 |
| Mode M9 | |||
|---|---|---|---|
| Quadrant | BADHDUFLAG | Total packets | Discarded packets |
| A | 0 | 20 | 0 |
| B | 0 | 21 | 0 |
| C | 0 | 21 | 0 |
| D | 0 | 21 | 0 |
| Mode M0 | |||
|---|---|---|---|
| Quadrant | BADHDUFLAG | Total packets | Discarded packets |
| A | 0 | 13703 | 2 |
| B | 0 | 13444 | 2 |
| C | 0 | 14853 | 2 |
| D | 0 | 15141 | 2 |
| Quadrant | Total seconds | Saturated seconds | Saturation percentage |
|---|---|---|---|
| A | 6218 | 73 | 1.174011% |
| B | 6218 | 80 | 1.286587% |
| C | 6218 | 101 | 1.624317% |
| D | 6218 | 87 | 1.399164% |
Noise dominated data is calculated using 1-second bins in cleaned event files. If a bin has >2000 counts, and if more than 50% of those come from <1% of pixels, then it is considered to be noise-dominated and hence unusable.
| Quadrant | # 1 sec bins | Bins with >0 counts | Bins with >2000 counts | High rate bins dominated by noise | Noise dominated (total time) | Noise dominated (detector-on time) | Marked lightcurve |
|---|---|---|---|---|---|---|---|
| A | 7583 | 6218 | 22 | 22 | 0.29% | 0.35% | 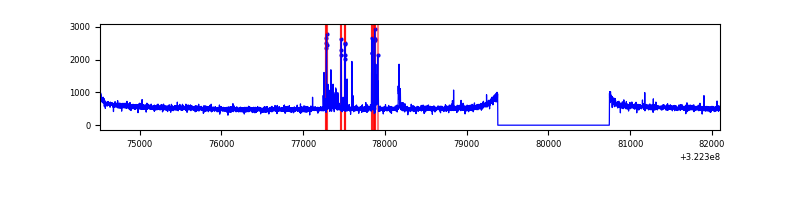 |
| B | 7583 | 6218 | 0 | 0 | 0.00% | 0.00% | 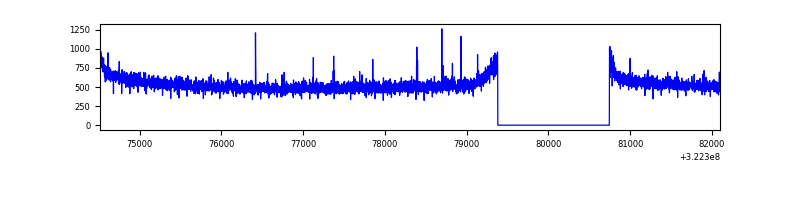 |
| C | 7583 | 6219 | 4 | 4 | 0.05% | 0.06% | 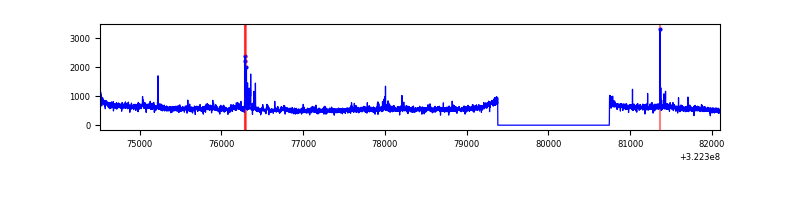 |
| D | 7583 | 6218 | 29 | 29 | 0.38% | 0.47% | 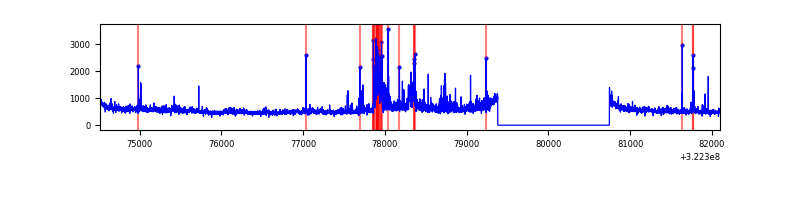 |
Top three noisy pixels from each quadrant. If the there are fewer than three noisy pixels in the level2.evt file, extra rows are filled as -1
| Pixel properties | Quadrant properties | ||||||
|---|---|---|---|---|---|---|---|
| Quadrant | DetID | PixID | Counts | Sigma | Mean | Median | Sigma |
| A | 6 | 16 | 142352 | 854.13 | 850 | 837 | 165.7 |
| A | 13 | 254 | 9214 | 50.56 | 850 | 837 | 165.7 |
| A | 0 | 226 | 7325 | 39.16 | 850 | 837 | 165.7 |
| B | 12 | 111 | 18123 | 110.84 | 846 | 827 | 156.0 |
| B | 11 | 111 | 16181 | 98.4 | 846 | 827 | 156.0 |
| B | 14 | 111 | 14384 | 86.88 | 846 | 827 | 156.0 |
| C | 7 | 247 | 342227 | 1874.22 | 797 | 802 | 182.2 |
| C | 14 | 238 | 130441 | 711.64 | 797 | 802 | 182.2 |
| C | 2 | 16 | 61886 | 335.31 | 797 | 802 | 182.2 |
| D | 8 | 195 | 359732 | 1841.89 | 806 | 784 | 194.9 |
| D | 1 | 52 | 187743 | 959.36 | 806 | 784 | 194.9 |
| D | 12 | 218 | 128342 | 654.55 | 806 | 784 | 194.9 |
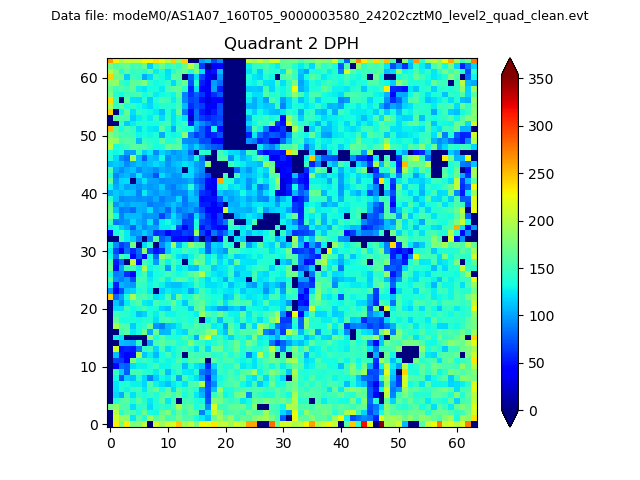
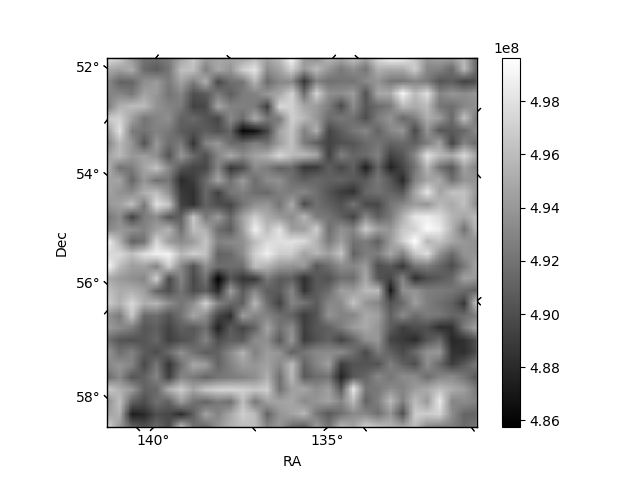
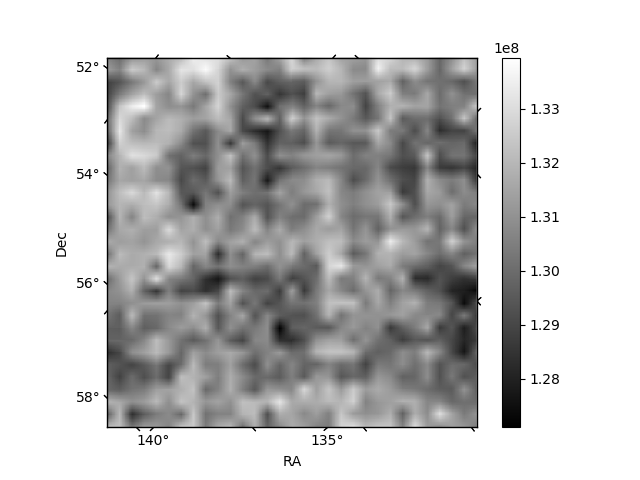
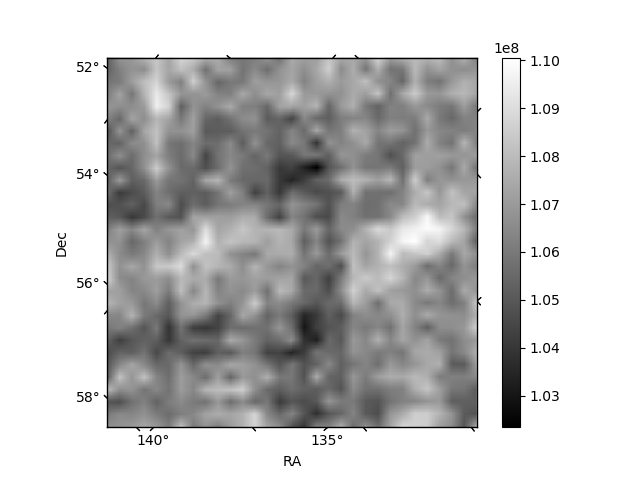
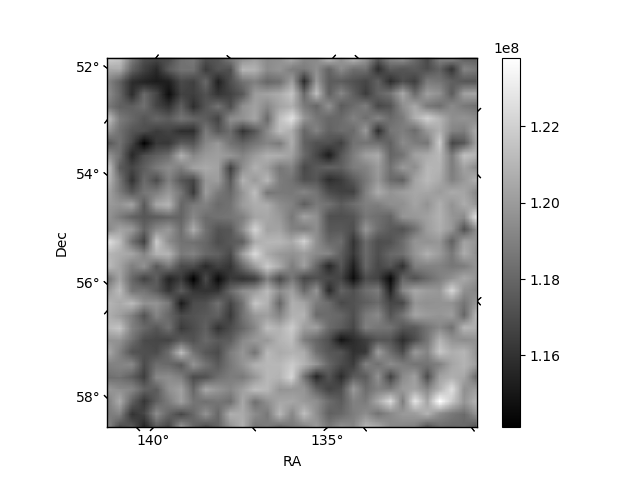
Histogram calculated using DETX and DETY for each event in the final _common_clean file
| Quadrant A | 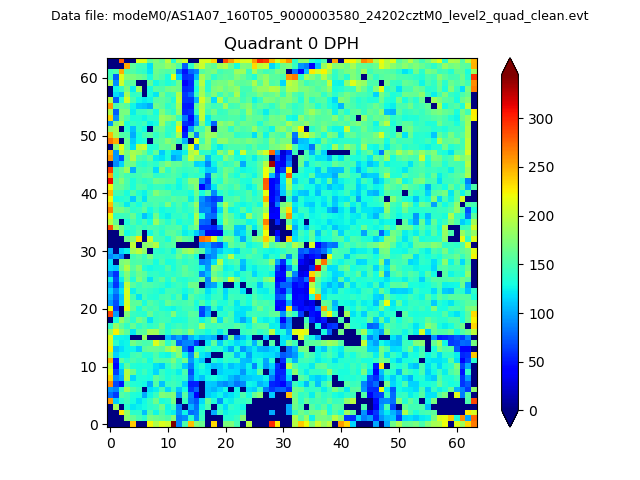 |
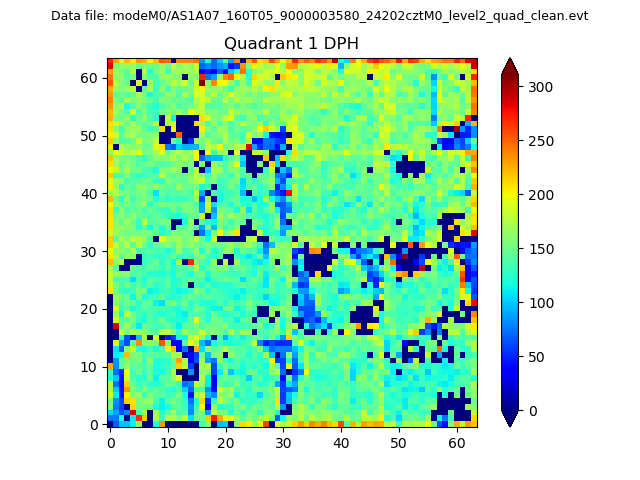 |
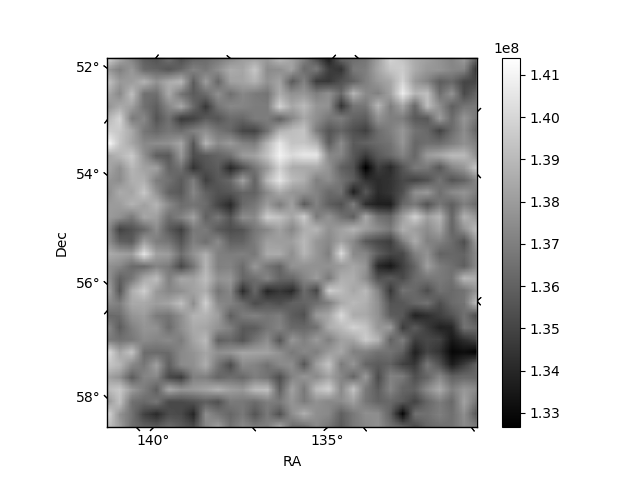
Quadrant B |
|---|---|---|---|
| Quadrant D | 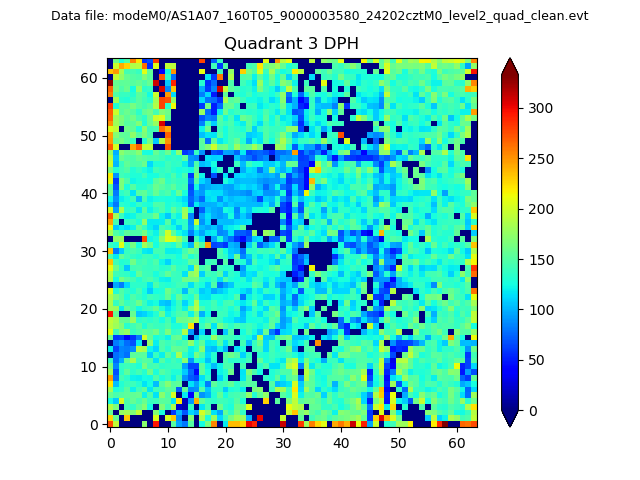 |
 |
Quadrant C |
| Plot type | Count rate plots | Images |
|---|---|---|
| Comparison with Poisson distribution Blue bars denote a histogram of data divided into 1 sec bins. Red curve is a Poisson curve with rate = median count rate of data. |
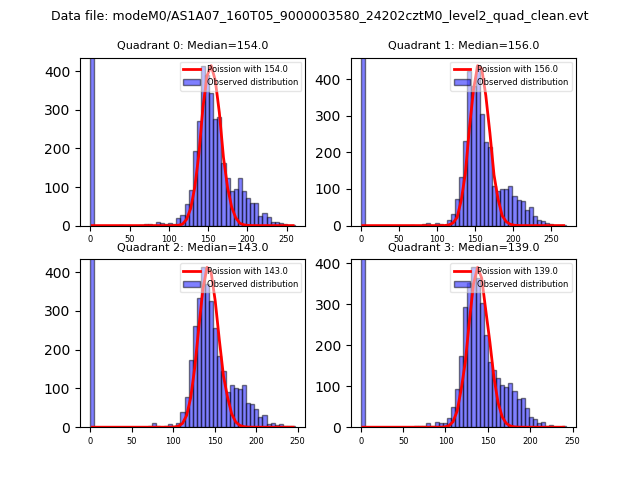 |
 |
| Quadrant-wise count rates Data is divided into 100 sec bins |
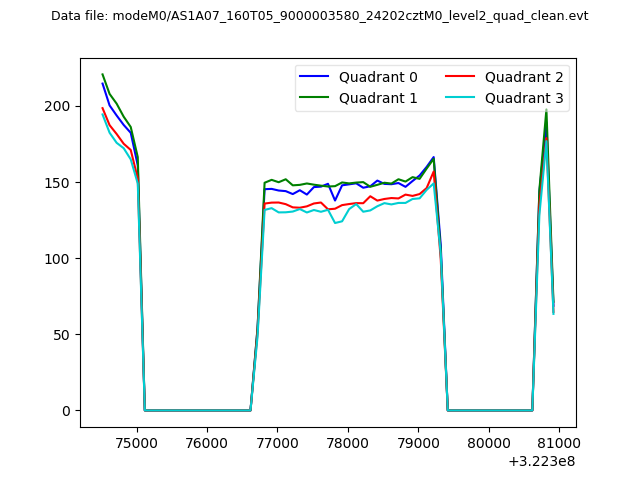 |
|
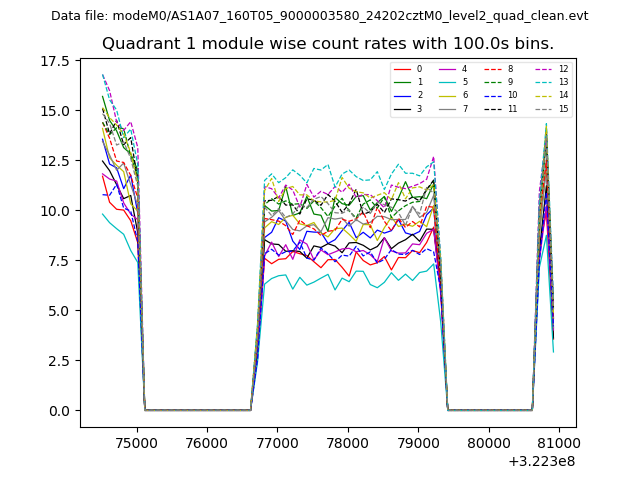
| Module-wise count rates for Quadrant A Data is divided into 100 sec bins |
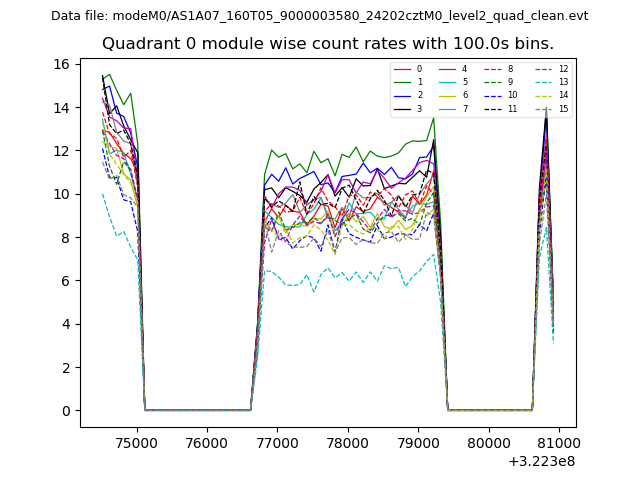 |
 |
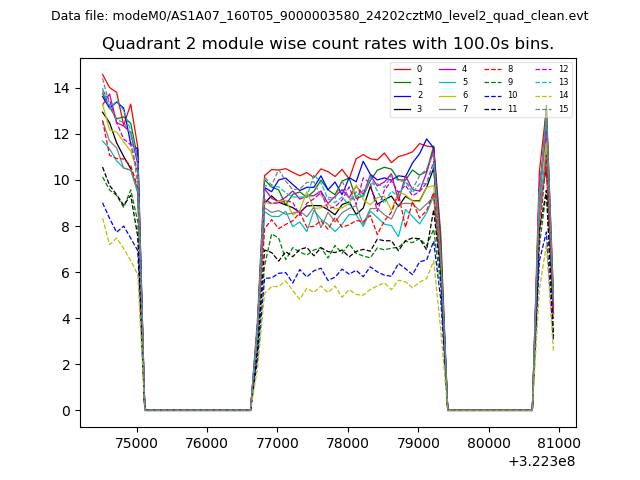
| Module-wise count rates for Quadrant B Data is divided into 100 sec bins |
 |
 |
| Module-wise count rates for Quadrant C Data is divided into 100 sec bins |
 |
 |
| Module-wise count rates for Quadrant D Data is divided into 100 sec bins |
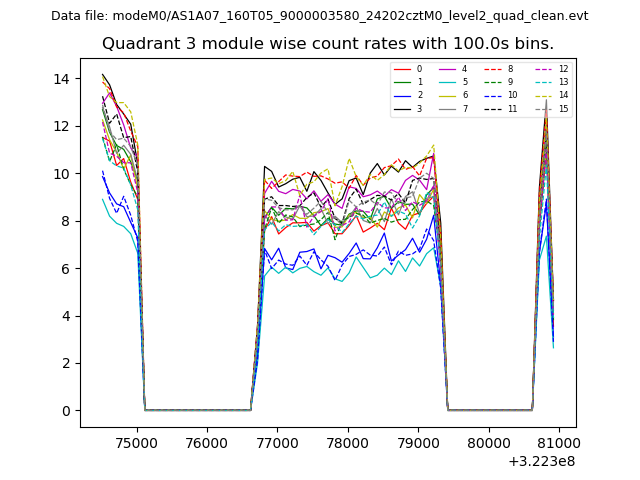 |
 |
| Parameter | Plot |
|---|---|
| CZT HV Monitor | 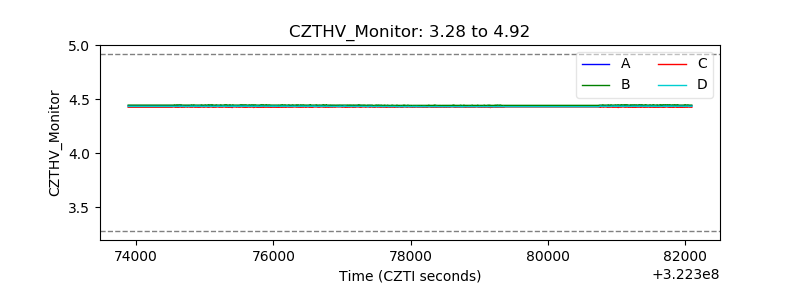 |
| D_VDD | 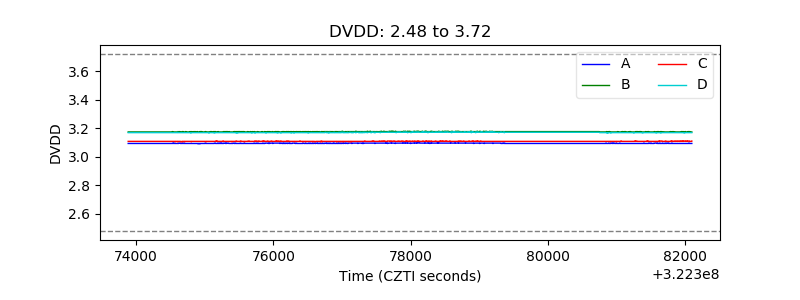 |
| Temperature 1 | 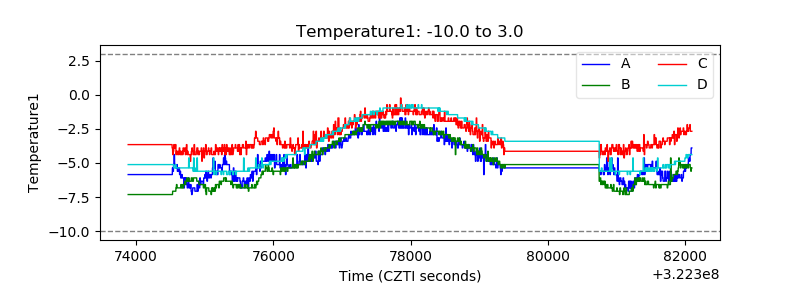 |
| Veto HV Monitor | 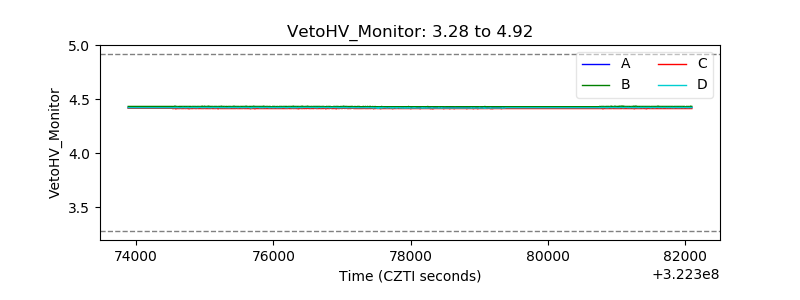 |
| Veto LLD |  |
| Alpha Counter | 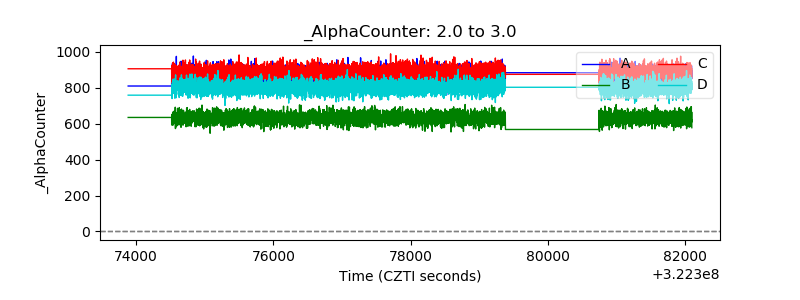 |
| _CPM_Rate | 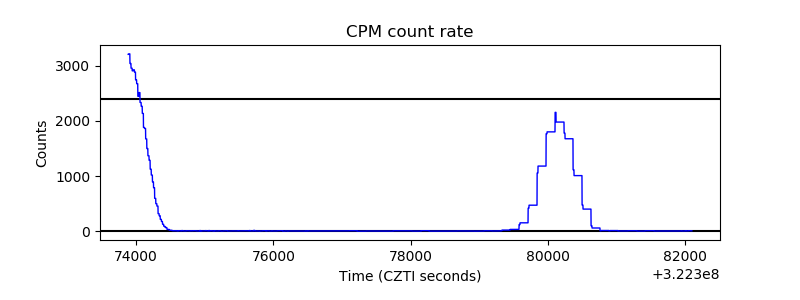 |
| CZT Counter | 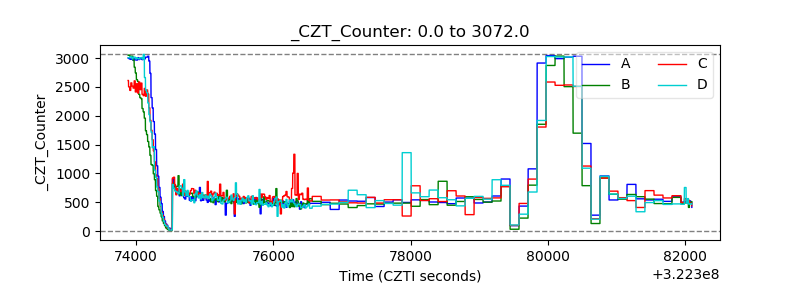 |
| +2.5 Volts monitor |  |
| +5 Volts monitor |  |
| _ROLL_ROT | 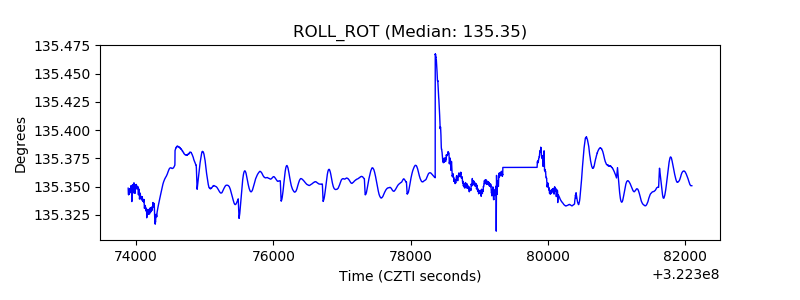 |
| _Roll_DEC | 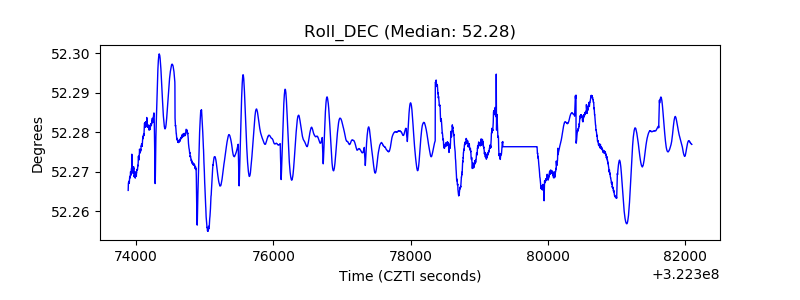 |
| _Roll_RA | 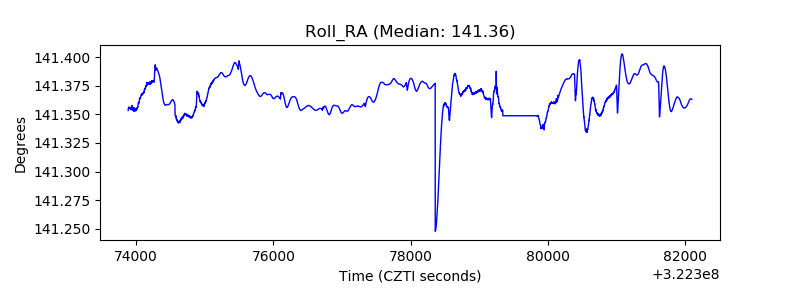 |
| Veto Counter | 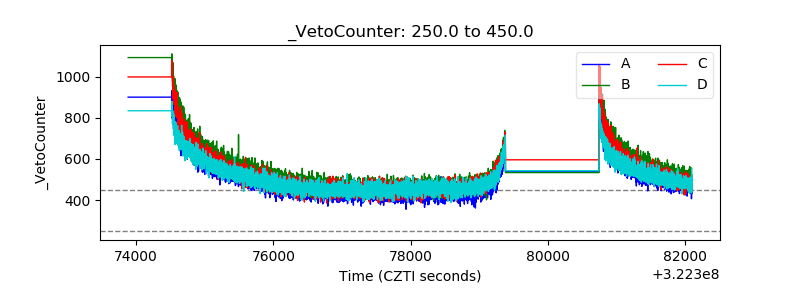 |