| Param | Original file | Final file |
|---|---|---|
| Filename | modeM0/AS1A07_160T05_9000003580_24203cztM0_level2.evt | modeM0/AS1A07_160T05_9000003580_24203cztM0_level2_quad_clean.evt |
| Size (bytes) | 462,597,120 | 78,114,240 |
| Size | 441.2 MB | 74.5 MB |
| Events in quadrant A | 3,279,836 | 500,222 |
| Events in quadrant B | 3,297,219 | 502,837 |
| Events in quadrant C | 3,425,523 | 464,593 |
| Events in quadrant D | 3,577,771 | 456,583 |
| Mode SS | |||
|---|---|---|---|
| Quadrant | BADHDUFLAG | Total packets | Discarded packets |
| A | 0 | 130 | 0 |
| B | 0 | 130 | 0 |
| C | 0 | 130 | 0 |
| D | 0 | 130 | 0 |
| Mode M9 | |||
|---|---|---|---|
| Quadrant | BADHDUFLAG | Total packets | Discarded packets |
| A | 0 | 20 | 0 |
| B | 0 | 21 | 0 |
| C | 0 | 21 | 0 |
| D | 0 | 21 | 0 |
| Mode M0 | |||
|---|---|---|---|
| Quadrant | BADHDUFLAG | Total packets | Discarded packets |
| A | 0 | 13334 | 2 |
| B | 0 | 13420 | 2 |
| C | 0 | 13954 | 2 |
| D | 0 | 14497 | 2 |
| Quadrant | Total seconds | Saturated seconds | Saturation percentage |
|---|---|---|---|
| A | 6316 | 88 | 1.393287% |
| B | 6316 | 124 | 1.963268% |
| C | 6316 | 125 | 1.979101% |
| D | 6316 | 62 | 0.981634% |
Noise dominated data is calculated using 1-second bins in cleaned event files. If a bin has >2000 counts, and if more than 50% of those come from <1% of pixels, then it is considered to be noise-dominated and hence unusable.
| Quadrant | # 1 sec bins | Bins with >0 counts | Bins with >2000 counts | High rate bins dominated by noise | Noise dominated (total time) | Noise dominated (detector-on time) | Marked lightcurve |
|---|---|---|---|---|---|---|---|
| A | 7561 | 6316 | 0 | 0 | 0.00% | 0.00% | 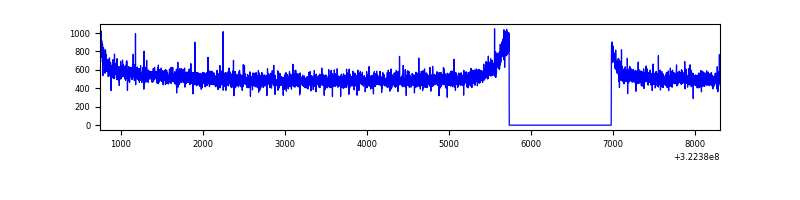 |
| B | 7561 | 6316 | 1 | 1 | 0.01% | 0.02% | 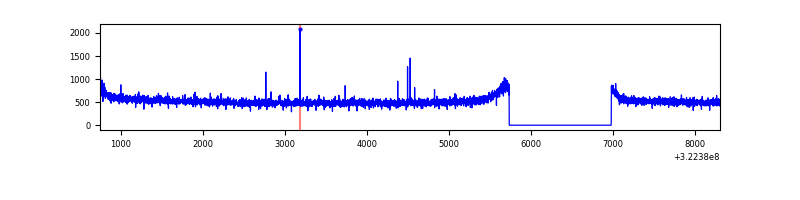 |
| C | 7561 | 6317 | 2 | 2 | 0.03% | 0.03% | 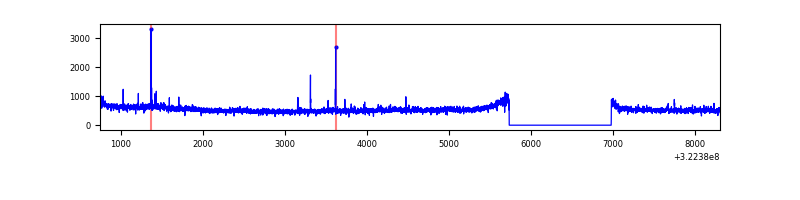 |
| D | 7561 | 6317 | 20 | 20 | 0.26% | 0.32% | 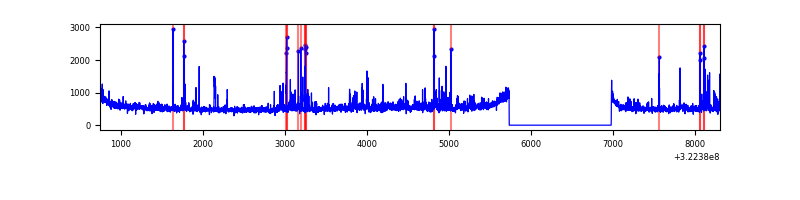 |
Top three noisy pixels from each quadrant. If the there are fewer than three noisy pixels in the level2.evt file, extra rows are filled as -1
| Pixel properties | Quadrant properties | ||||||
|---|---|---|---|---|---|---|---|
| Quadrant | DetID | PixID | Counts | Sigma | Mean | Median | Sigma |
| A | 13 | 254 | 9644 | 52.36 | 850 | 834 | 168.3 |
| A | 0 | 226 | 7297 | 38.41 | 850 | 834 | 168.3 |
| A | 3 | 137 | 7130 | 37.42 | 850 | 834 | 168.3 |
| B | 12 | 111 | 18476 | 111.96 | 841 | 822 | 157.7 |
| B | 11 | 111 | 16145 | 97.18 | 841 | 822 | 157.7 |
| B | 14 | 111 | 14788 | 88.57 | 841 | 822 | 157.7 |
| C | 7 | 247 | 155384 | 849.98 | 796 | 801 | 181.9 |
| C | 14 | 238 | 129702 | 708.77 | 796 | 801 | 181.9 |
| C | 2 | 16 | 36248 | 194.9 | 796 | 801 | 181.9 |
| D | 1 | 52 | 253271 | 1300.89 | 808 | 786 | 194.1 |
| D | 8 | 195 | 182337 | 935.41 | 808 | 786 | 194.1 |
| D | 7 | 238 | 76329 | 389.22 | 808 | 786 | 194.1 |
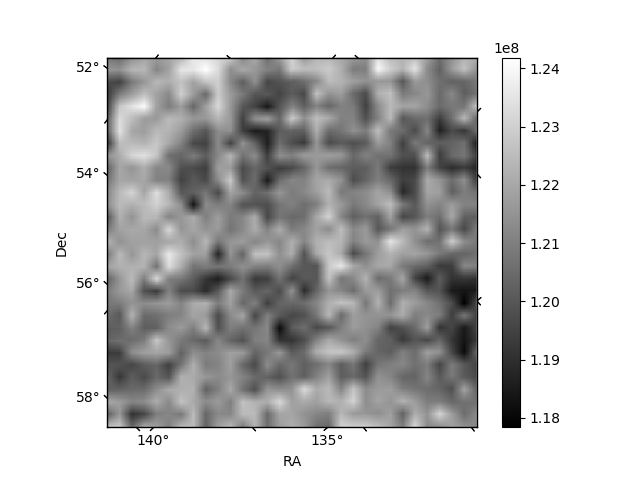
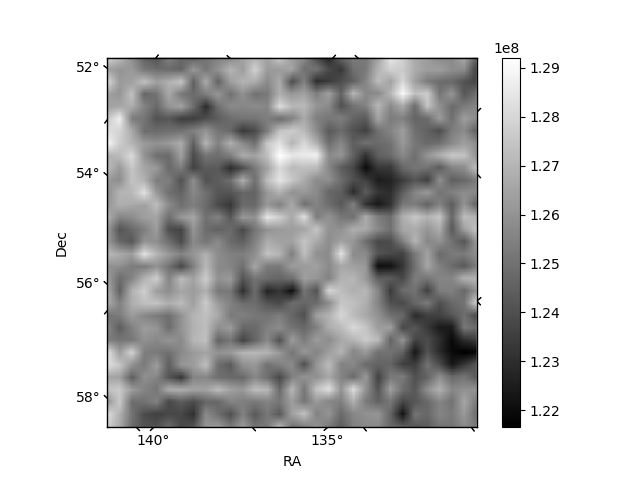
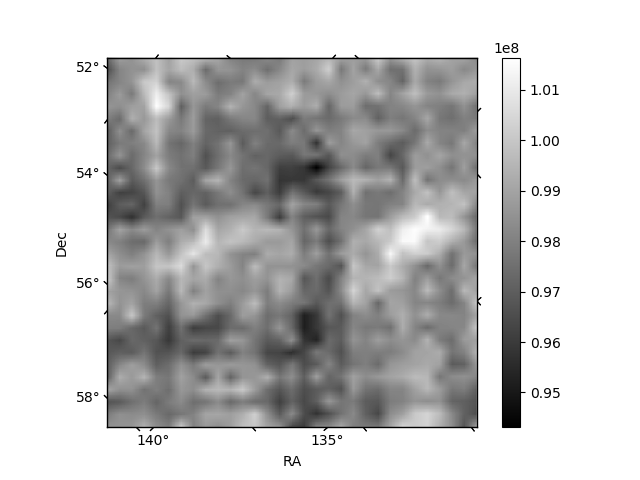
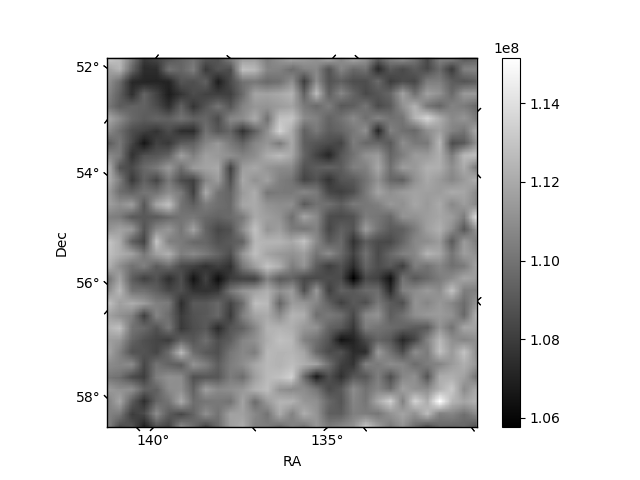
Histogram calculated using DETX and DETY for each event in the final _common_clean file
| Quadrant A | 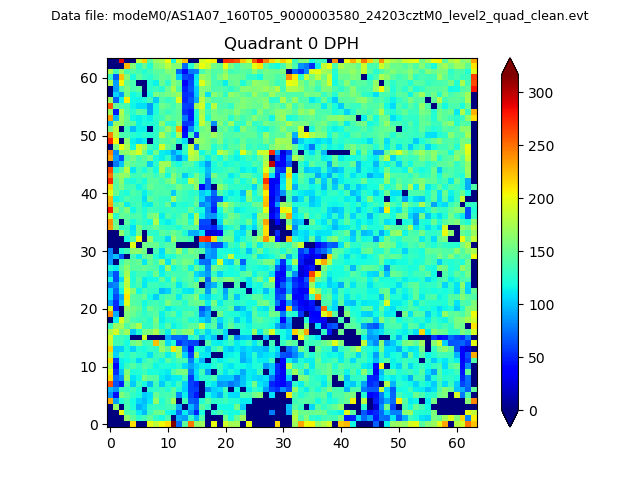 |
 |
Quadrant B |
|---|---|---|---|
| Quadrant D |  |
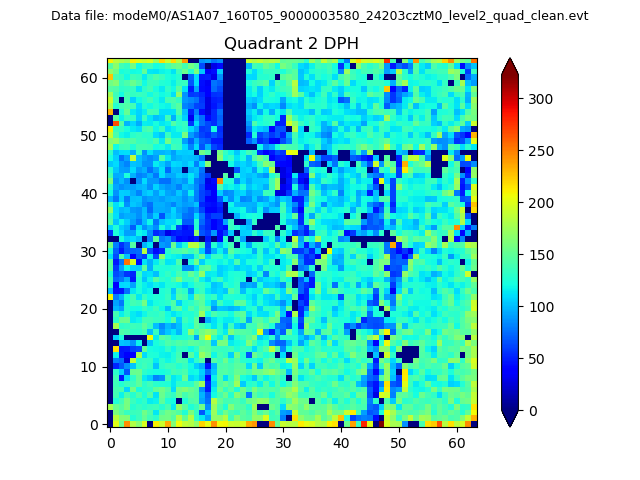 |
Quadrant C |
| Plot type | Count rate plots | Images |
|---|---|---|
| Comparison with Poisson distribution Blue bars denote a histogram of data divided into 1 sec bins. Red curve is a Poisson curve with rate = median count rate of data. |
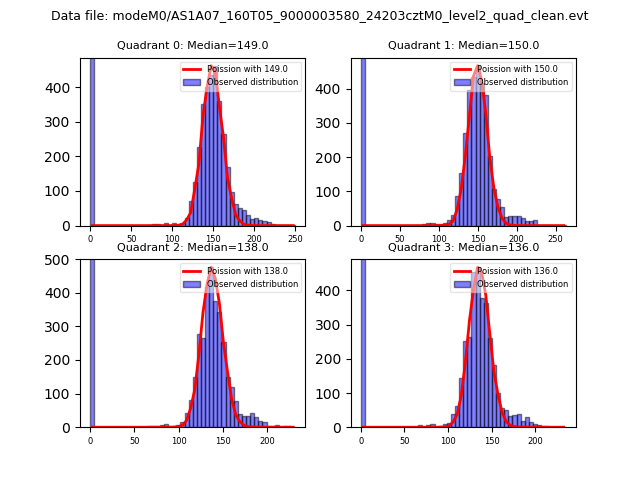 |
 |
| Quadrant-wise count rates Data is divided into 100 sec bins |
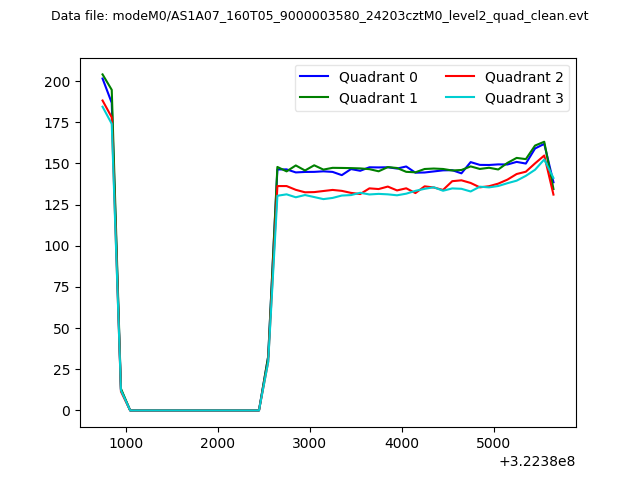 |
|
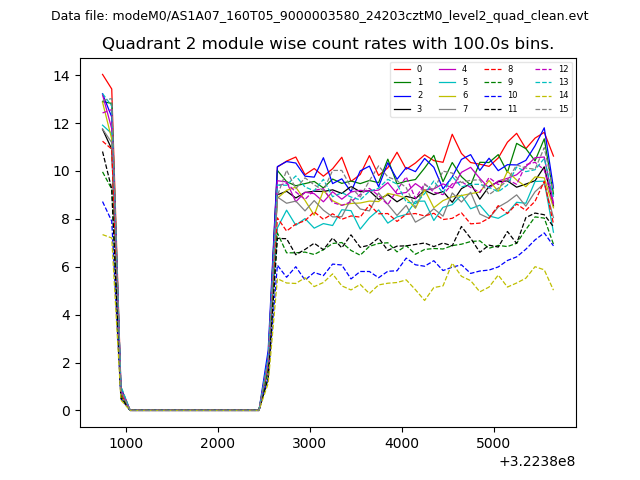
| Module-wise count rates for Quadrant A Data is divided into 100 sec bins |
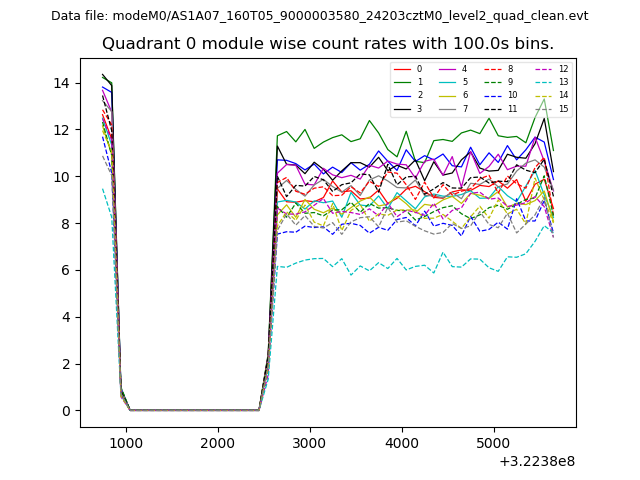 |
 |
| Module-wise count rates for Quadrant B Data is divided into 100 sec bins |
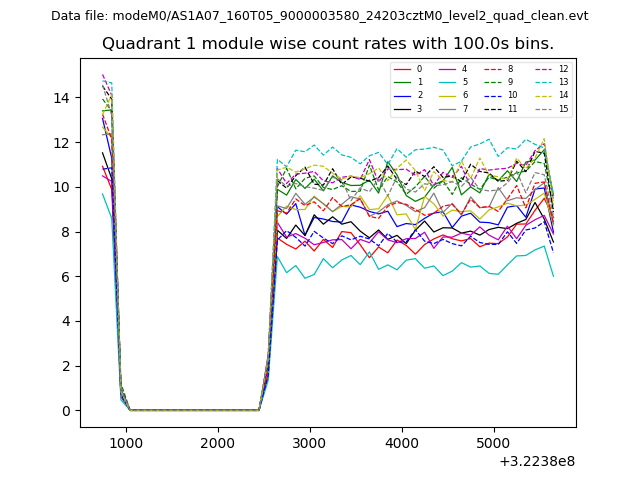 |
 |
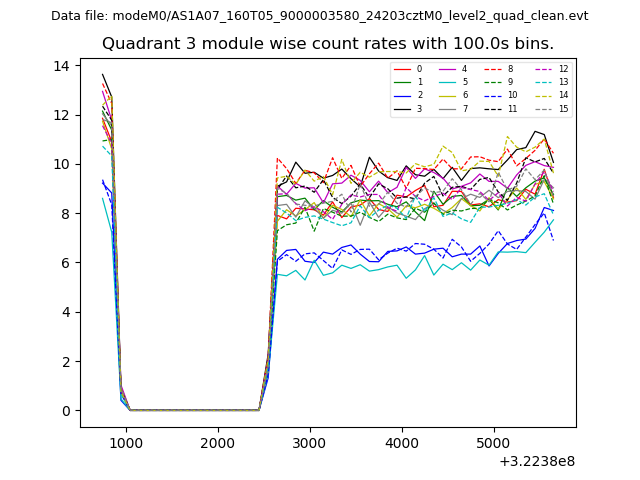
| Module-wise count rates for Quadrant C Data is divided into 100 sec bins |
 |
 |
| Module-wise count rates for Quadrant D Data is divided into 100 sec bins |
 |
 |
| Parameter | Plot |
|---|---|
| CZT HV Monitor | 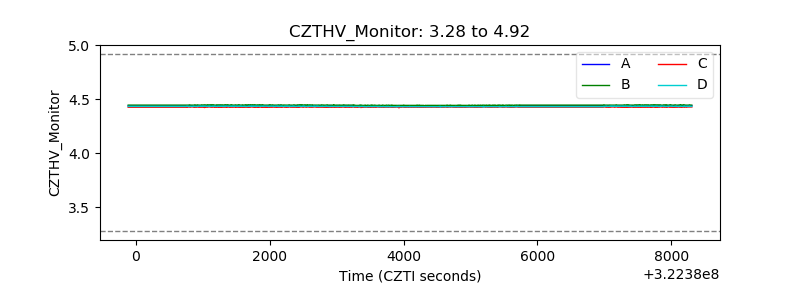 |
| D_VDD | 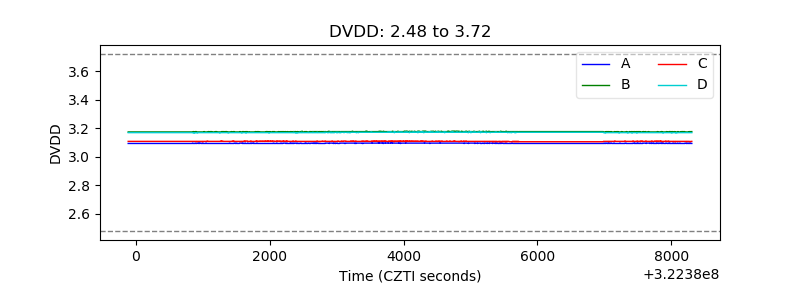 |
| Temperature 1 | 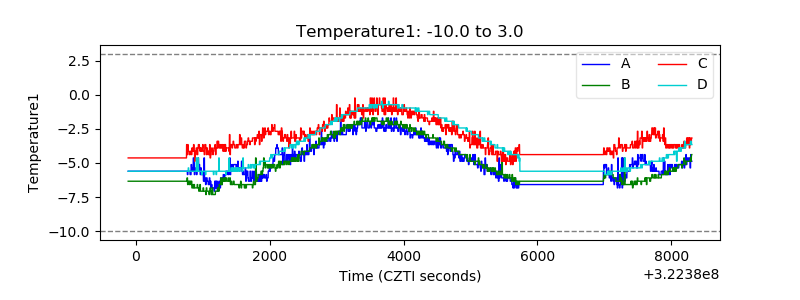 |
| Veto HV Monitor | 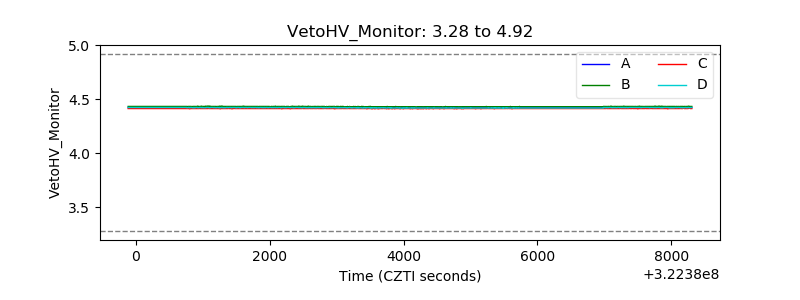 |
| Veto LLD | 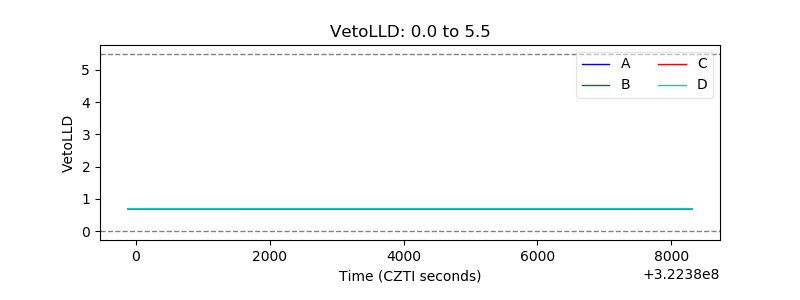 |
| Alpha Counter | 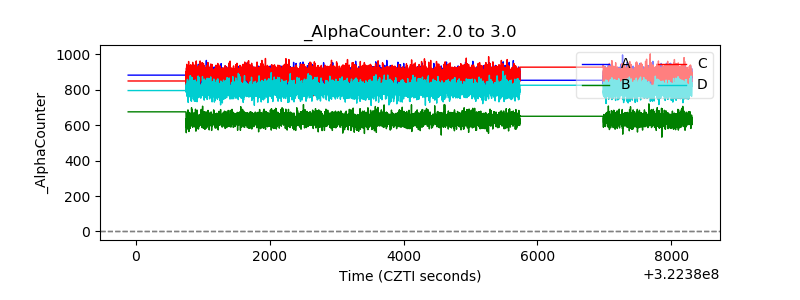 |
| _CPM_Rate | 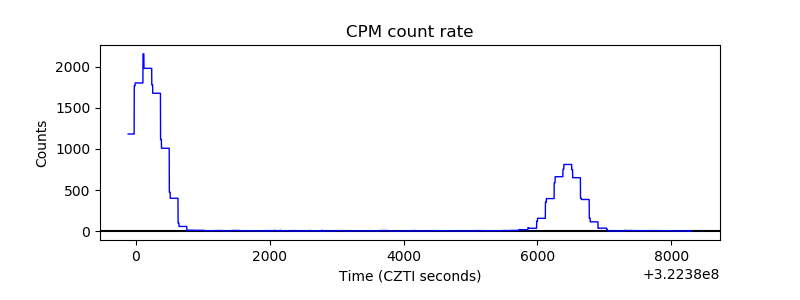 |
| CZT Counter | 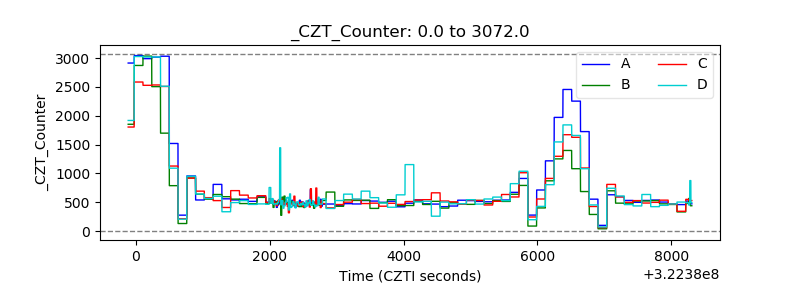 |
| +2.5 Volts monitor |  |
| +5 Volts monitor |  |
| _ROLL_ROT | 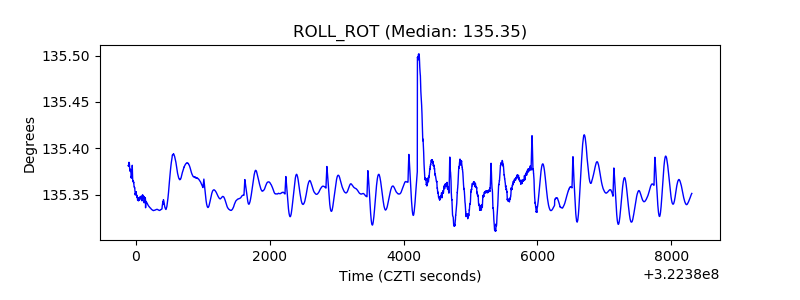 |
| _Roll_DEC | 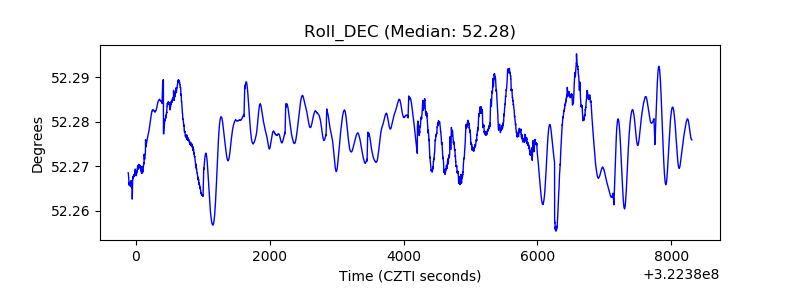 |
| _Roll_RA | 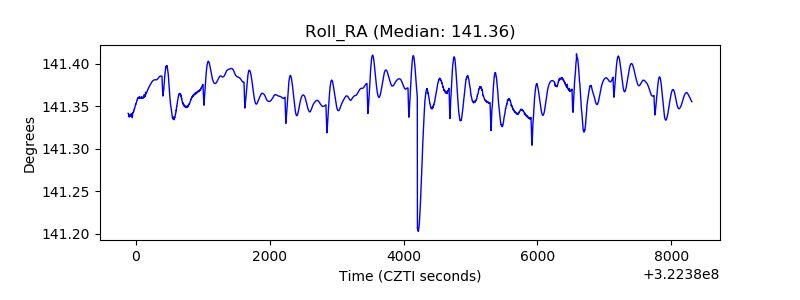 |
| Veto Counter | 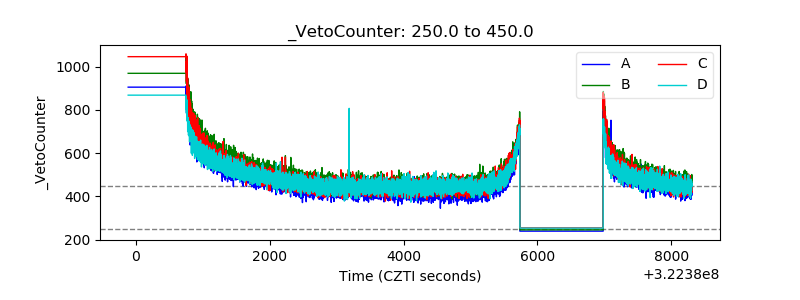 |