| Param | Original file | Final file |
|---|---|---|
| Filename | modeM0/AS1A07_160T05_9000003580_24204cztM0_level2.evt | modeM0/AS1A07_160T05_9000003580_24204cztM0_level2_quad_clean.evt |
| Size (bytes) | 502,058,880 | 91,886,400 |
| Size | 478.8 MB | 87.6 MB |
| Events in quadrant A | 3,469,341 | 596,512 |
| Events in quadrant B | 3,466,363 | 598,375 |
| Events in quadrant C | 3,840,991 | 555,483 |
| Events in quadrant D | 3,960,796 | 552,371 |
| Mode SS | |||
|---|---|---|---|
| Quadrant | BADHDUFLAG | Total packets | Discarded packets |
| A | 0 | 142 | 0 |
| B | 0 | 142 | 0 |
| C | 0 | 142 | 0 |
| D | 0 | 142 | 0 |
| Mode M9 | |||
|---|---|---|---|
| Quadrant | BADHDUFLAG | Total packets | Discarded packets |
| A | 0 | 21 | 0 |
| B | 0 | 21 | 0 |
| C | 0 | 21 | 0 |
| D | 0 | 21 | 0 |
| Mode M0 | |||
|---|---|---|---|
| Quadrant | BADHDUFLAG | Total packets | Discarded packets |
| A | 0 | 14403 | 2 |
| B | 0 | 14357 | 2 |
| C | 0 | 15267 | 2 |
| D | 0 | 15991 | 2 |
| Quadrant | Total seconds | Saturated seconds | Saturation percentage |
|---|---|---|---|
| A | 6881 | 187 | 2.717628% |
| B | 6881 | 222 | 3.226275% |
| C | 6881 | 279 | 4.054643% |
| D | 6881 | 158 | 2.296178% |
Noise dominated data is calculated using 1-second bins in cleaned event files. If a bin has >2000 counts, and if more than 50% of those come from <1% of pixels, then it is considered to be noise-dominated and hence unusable.
| Quadrant | # 1 sec bins | Bins with >0 counts | Bins with >2000 counts | High rate bins dominated by noise | Noise dominated (total time) | Noise dominated (detector-on time) | Marked lightcurve |
|---|---|---|---|---|---|---|---|
| A | 9031 | 6881 | 0 | 0 | 0.00% | 0.00% | 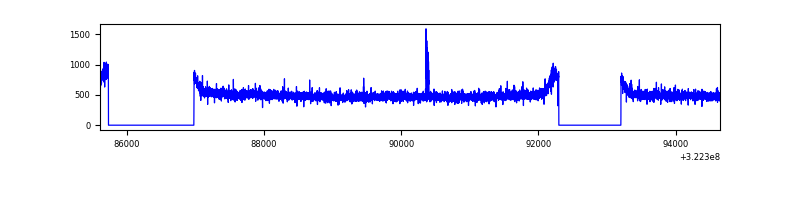 |
| B | 9031 | 6881 | 0 | 0 | 0.00% | 0.00% | 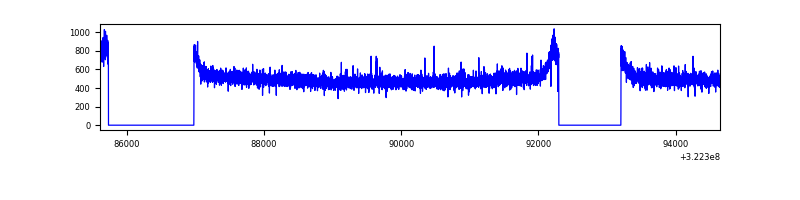 |
| C | 9031 | 6882 | 49 | 49 | 0.54% | 0.71% | 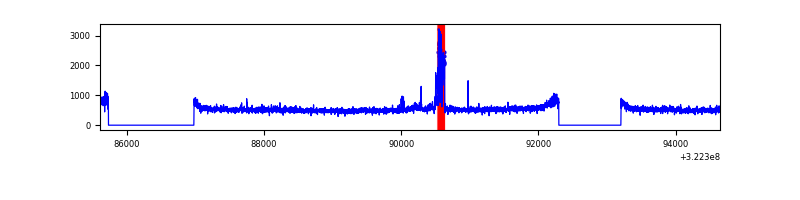 |
| D | 9031 | 6882 | 32 | 32 | 0.35% | 0.46% | 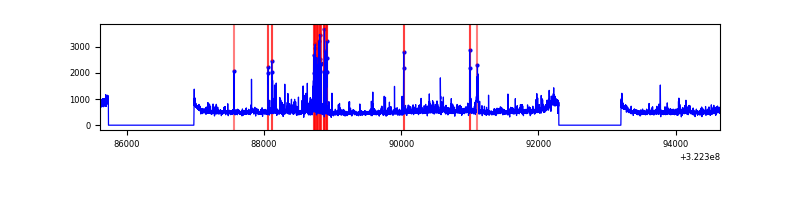 |
Top three noisy pixels from each quadrant. If the there are fewer than three noisy pixels in the level2.evt file, extra rows are filled as -1
| Pixel properties | Quadrant properties | ||||||
|---|---|---|---|---|---|---|---|
| Quadrant | DetID | PixID | Counts | Sigma | Mean | Median | Sigma |
| A | 4 | 2 | 19537 | 104.19 | 895 | 876 | 179.1 |
| A | 13 | 254 | 10555 | 54.04 | 895 | 876 | 179.1 |
| A | 3 | 137 | 7991 | 39.72 | 895 | 876 | 179.1 |
| B | 12 | 111 | 20213 | 115.51 | 882 | 859 | 167.5 |
| B | 11 | 111 | 18024 | 102.45 | 882 | 859 | 167.5 |
| B | 14 | 111 | 16330 | 92.34 | 882 | 859 | 167.5 |
| C | 7 | 247 | 223805 | 1152.29 | 839 | 842 | 193.5 |
| C | 2 | 16 | 209223 | 1076.93 | 839 | 842 | 193.5 |
| C | 14 | 238 | 135799 | 697.47 | 839 | 842 | 193.5 |
| D | 8 | 195 | 332699 | 1597.46 | 860 | 835 | 207.7 |
| D | 7 | 238 | 273867 | 1314.27 | 860 | 835 | 207.7 |
| D | 12 | 218 | 55140 | 261.4 | 860 | 835 | 207.7 |
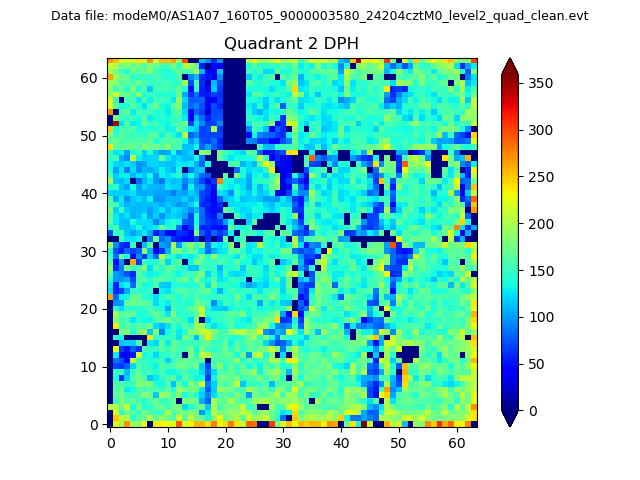
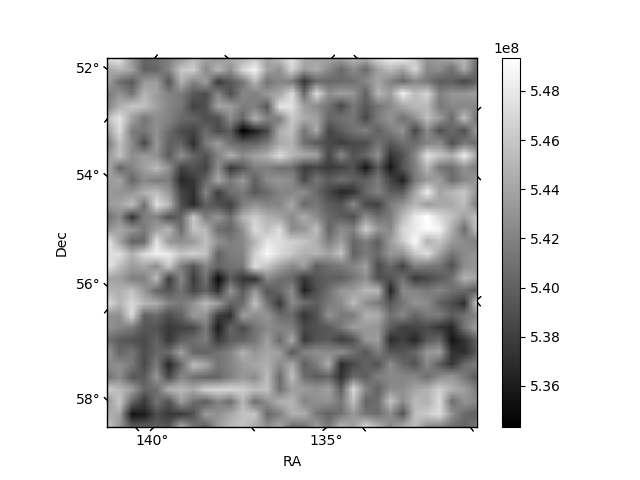
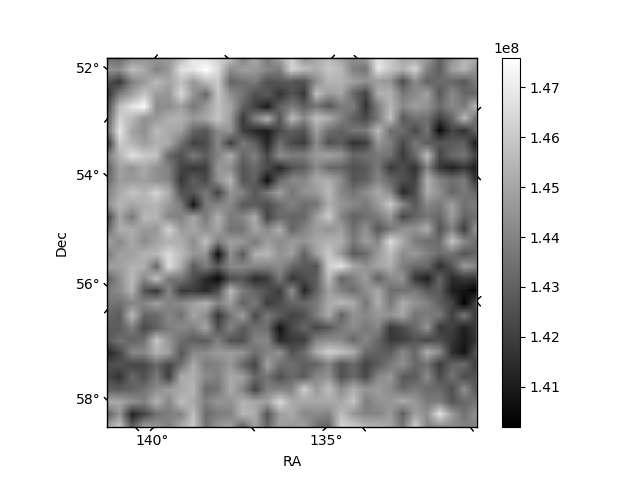
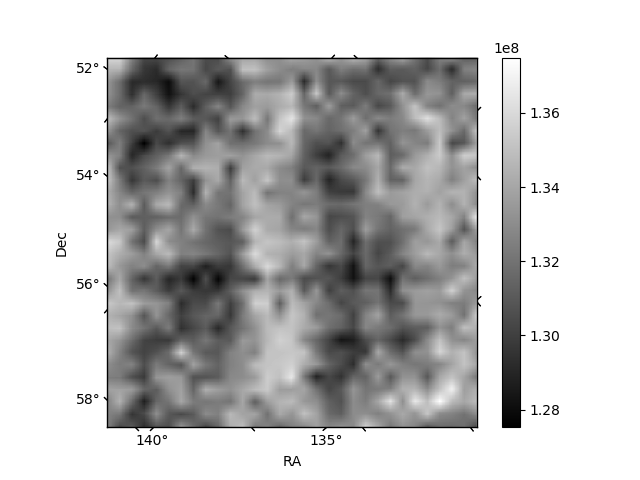
Histogram calculated using DETX and DETY for each event in the final _common_clean file
| Quadrant A | 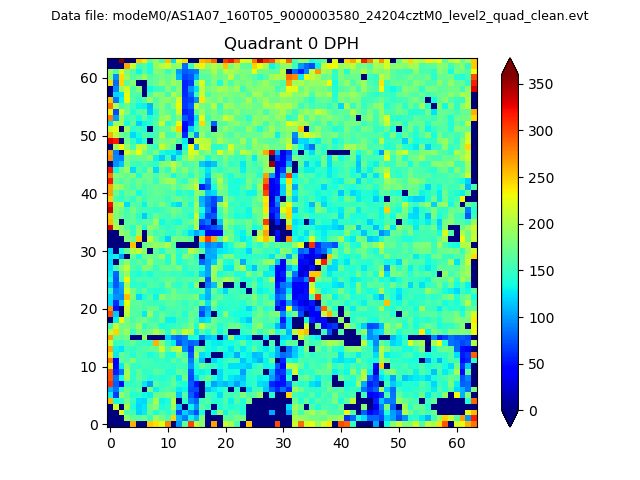 |
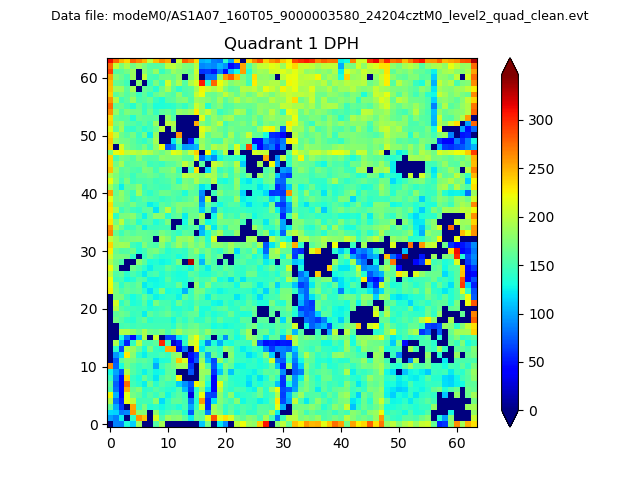 |
Quadrant B |
|---|---|---|---|
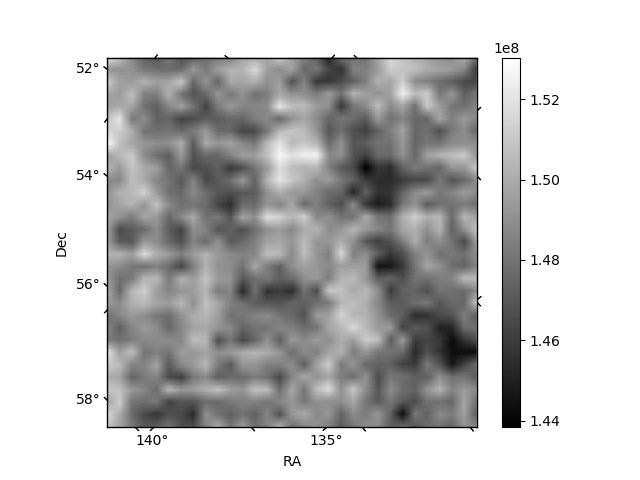
| Quadrant D | 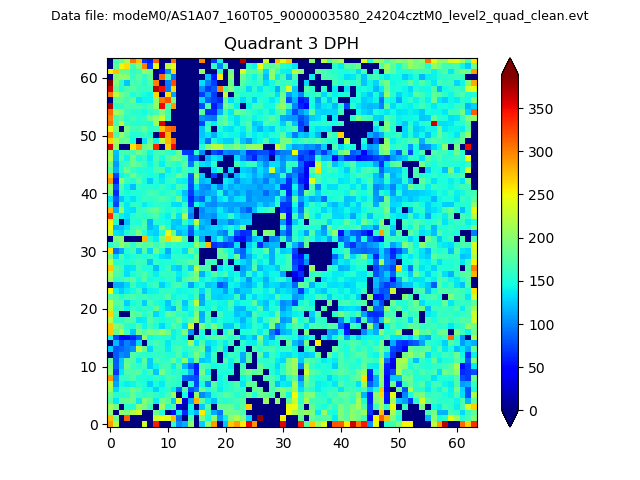 |
 |
Quadrant C |
| Plot type | Count rate plots | Images |
|---|---|---|
| Comparison with Poisson distribution Blue bars denote a histogram of data divided into 1 sec bins. Red curve is a Poisson curve with rate = median count rate of data. |
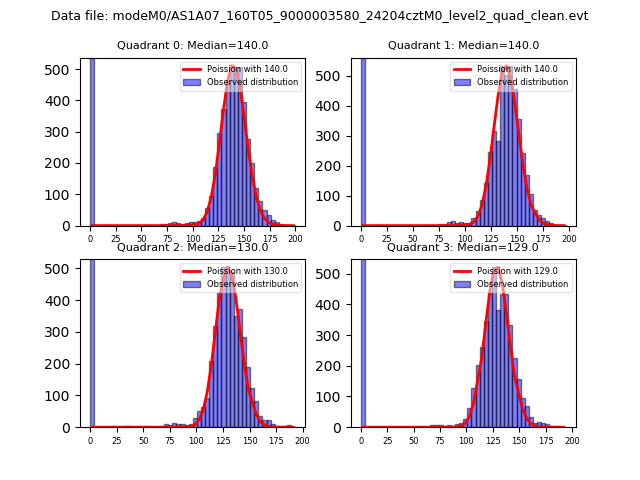 |
 |
| Quadrant-wise count rates Data is divided into 100 sec bins |
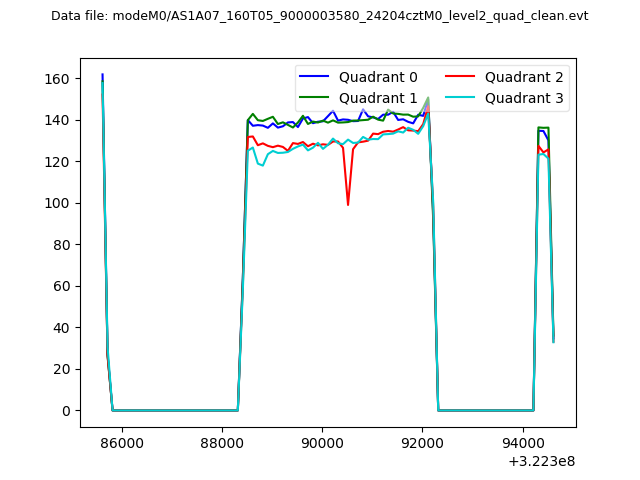 |
|
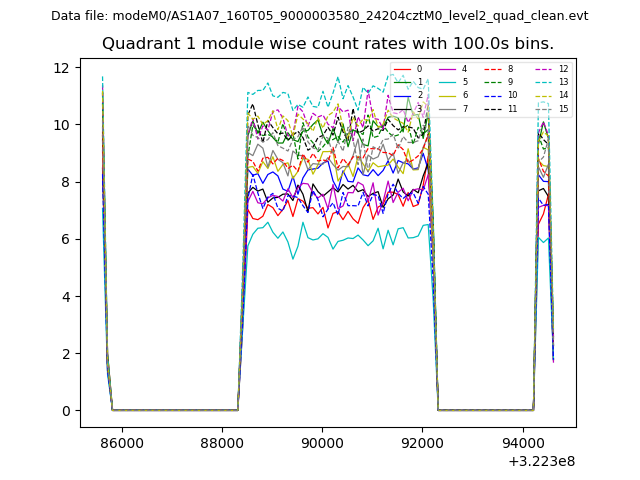
| Module-wise count rates for Quadrant A Data is divided into 100 sec bins |
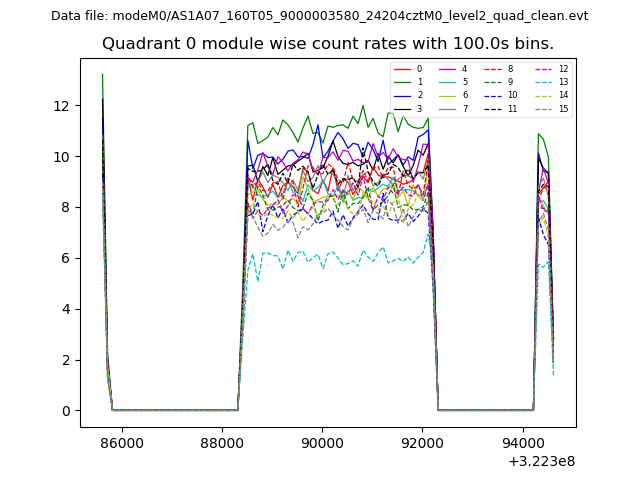 |
 |
| Module-wise count rates for Quadrant B Data is divided into 100 sec bins |
 |
 |
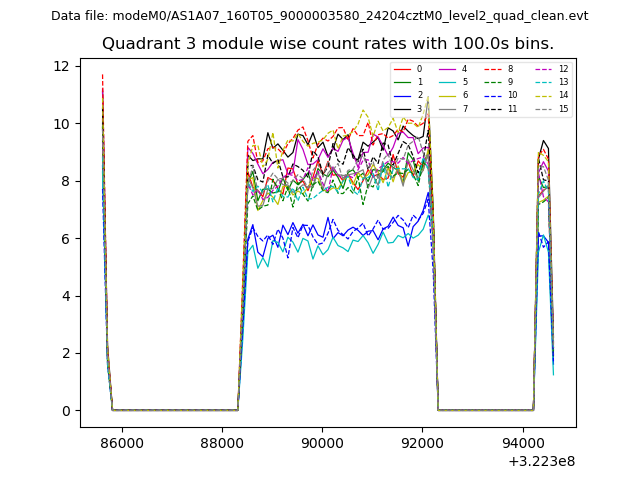
| Module-wise count rates for Quadrant C Data is divided into 100 sec bins |
 |
 |
| Module-wise count rates for Quadrant D Data is divided into 100 sec bins |
 |
 |
| Parameter | Plot |
|---|---|
| CZT HV Monitor | 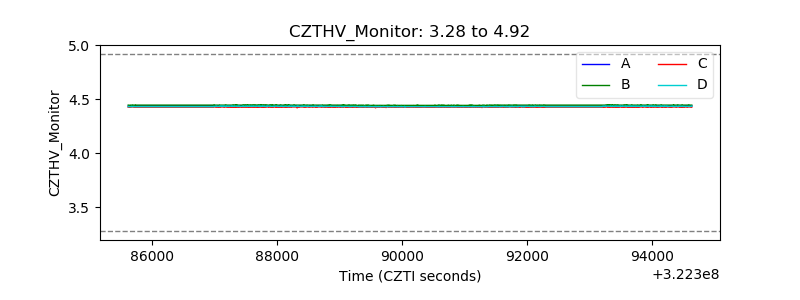 |
| D_VDD | 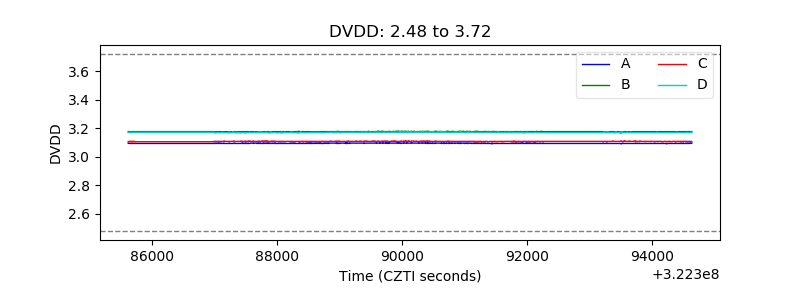 |
| Temperature 1 | 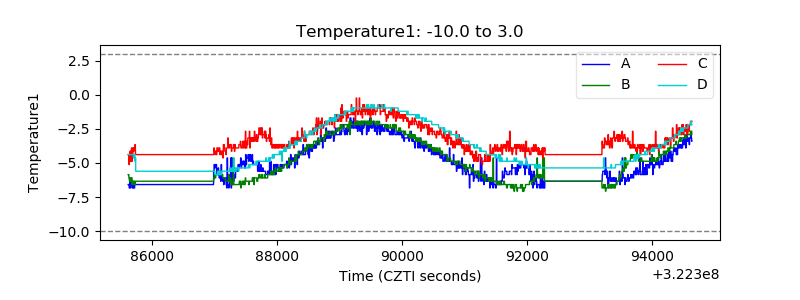 |
| Veto HV Monitor | 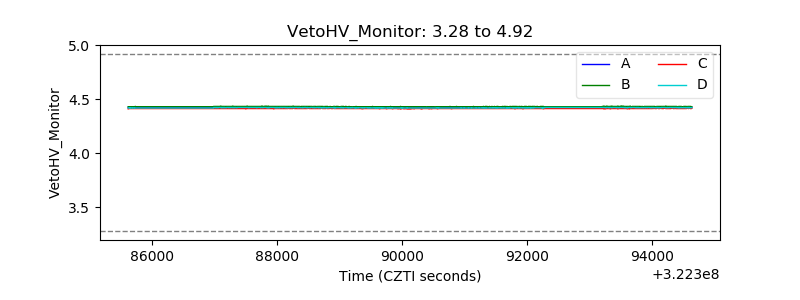 |
| Veto LLD | 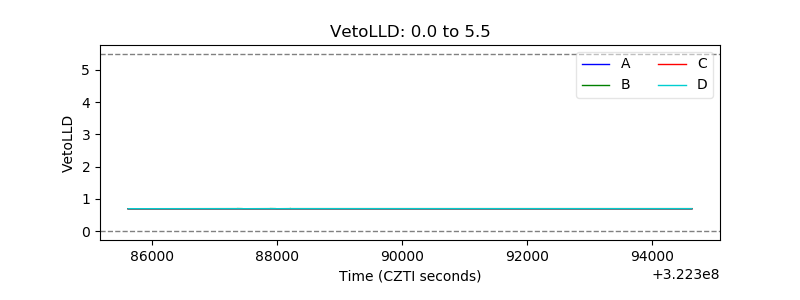 |
| Alpha Counter | 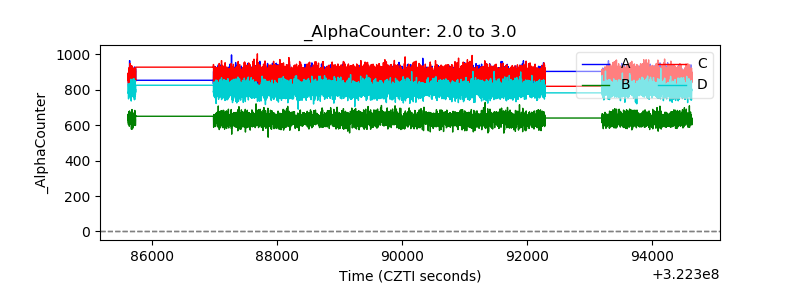 |
| _CPM_Rate | 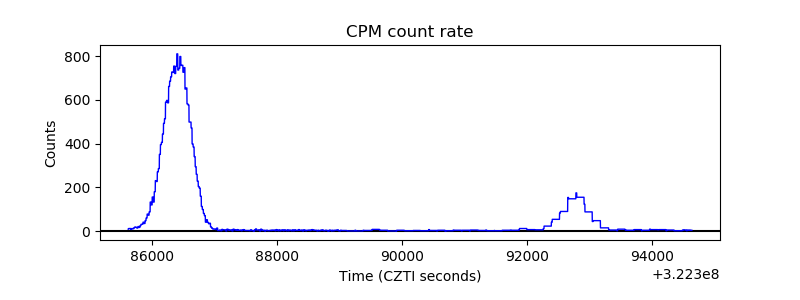 |
| CZT Counter | 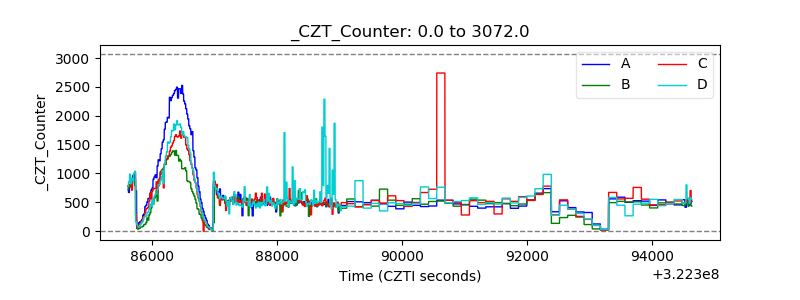 |
| +2.5 Volts monitor |  |
| +5 Volts monitor |  |
| _ROLL_ROT | 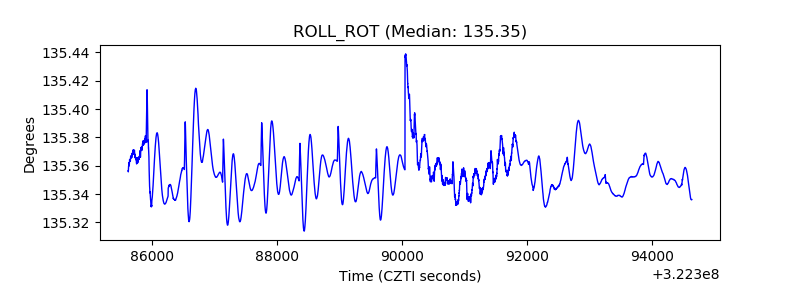 |
| _Roll_DEC | 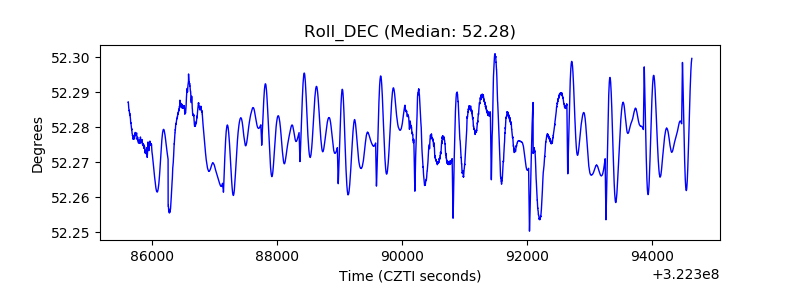 |
| _Roll_RA | 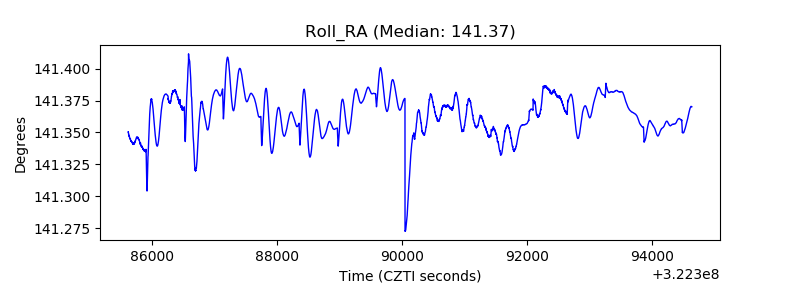 |
| Veto Counter |  |