| Param | Original file | Final file |
|---|---|---|
| Filename | modeM0/AS1A07_160T05_9000003580_24205cztM0_level2.evt | modeM0/AS1A07_160T05_9000003580_24205cztM0_level2_quad_clean.evt |
| Size (bytes) | 488,568,960 | 103,651,200 |
| Size | 465.9 MB | 98.8 MB |
| Events in quadrant A | 3,359,195 | 683,493 |
| Events in quadrant B | 3,401,290 | 685,936 |
| Events in quadrant C | 3,607,630 | 641,720 |
| Events in quadrant D | 3,944,582 | 632,288 |
| Mode SS | |||
|---|---|---|---|
| Quadrant | BADHDUFLAG | Total packets | Discarded packets |
| A | 0 | 144 | 0 |
| B | 0 | 144 | 0 |
| C | 0 | 144 | 0 |
| D | 0 | 144 | 0 |
| Mode M9 | |||
|---|---|---|---|
| Quadrant | BADHDUFLAG | Total packets | Discarded packets |
| A | 0 | 5 | 0 |
| B | 0 | 5 | 0 |
| C | 0 | 5 | 0 |
| D | 0 | 5 | 0 |
| Mode M0 | |||
|---|---|---|---|
| Quadrant | BADHDUFLAG | Total packets | Discarded packets |
| A | 0 | 14518 | 1 |
| B | 0 | 14571 | 1 |
| C | 0 | 14733 | 1 |
| D | 0 | 16127 | 1 |
| Quadrant | Total seconds | Saturated seconds | Saturation percentage |
|---|---|---|---|
| A | 7120 | 103 | 1.446629% |
| B | 7121 | 119 | 1.671114% |
| C | 7121 | 124 | 1.741328% |
| D | 7121 | 73 | 1.025137% |
Noise dominated data is calculated using 1-second bins in cleaned event files. If a bin has >2000 counts, and if more than 50% of those come from <1% of pixels, then it is considered to be noise-dominated and hence unusable.
| Quadrant | # 1 sec bins | Bins with >0 counts | Bins with >2000 counts | High rate bins dominated by noise | Noise dominated (total time) | Noise dominated (detector-on time) | Marked lightcurve |
|---|---|---|---|---|---|---|---|
| A | 7590 | 7120 | 0 | 0 | 0.00% | 0.00% |  |
| B | 7591 | 7121 | 1 | 1 | 0.01% | 0.01% |  |
| C | 7591 | 7121 | 0 | 0 | 0.00% | 0.00% |  |
| D | 7591 | 7122 | 8 | 8 | 0.11% | 0.11% |  |
Top three noisy pixels from each quadrant. If the there are fewer than three noisy pixels in the level2.evt file, extra rows are filled as -1
| Pixel properties | Quadrant properties | ||||||
|---|---|---|---|---|---|---|---|
| Quadrant | DetID | PixID | Counts | Sigma | Mean | Median | Sigma |
| A | 13 | 254 | 11450 | 60.59 | 869 | 850 | 174.9 |
| A | 3 | 137 | 7825 | 39.87 | 869 | 850 | 174.9 |
| A | 0 | 226 | 7478 | 37.89 | 869 | 850 | 174.9 |
| B | 12 | 111 | 19813 | 114.83 | 862 | 839 | 165.2 |
| B | 11 | 111 | 17693 | 102.0 | 862 | 839 | 165.2 |
| B | 14 | 111 | 15796 | 90.52 | 862 | 839 | 165.2 |
| C | 7 | 247 | 239865 | 1258.07 | 821 | 826 | 190.0 |
| C | 14 | 238 | 133714 | 699.39 | 821 | 826 | 190.0 |
| C | 2 | 16 | 31539 | 161.64 | 821 | 826 | 190.0 |
| D | 8 | 195 | 355909 | 1751.6 | 836 | 811 | 202.7 |
| D | 7 | 238 | 210338 | 1033.54 | 836 | 811 | 202.7 |
| D | 12 | 218 | 190398 | 935.18 | 836 | 811 | 202.7 |
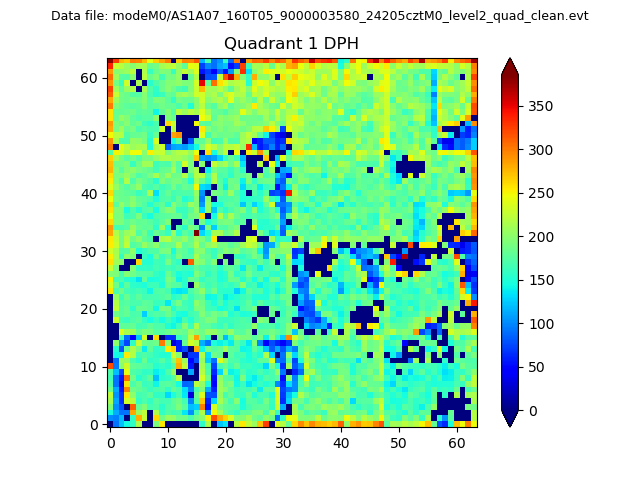
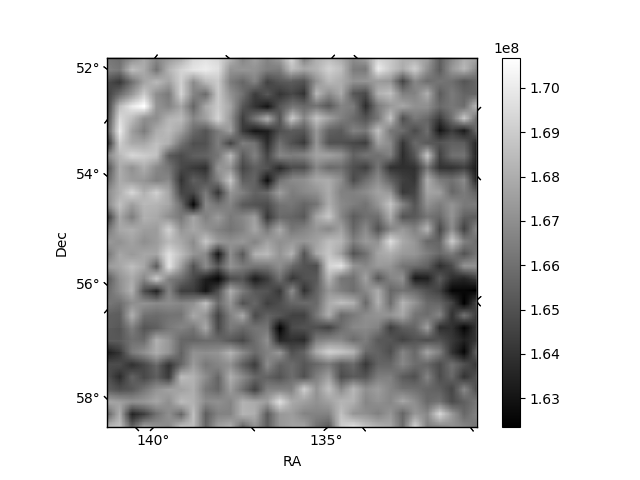
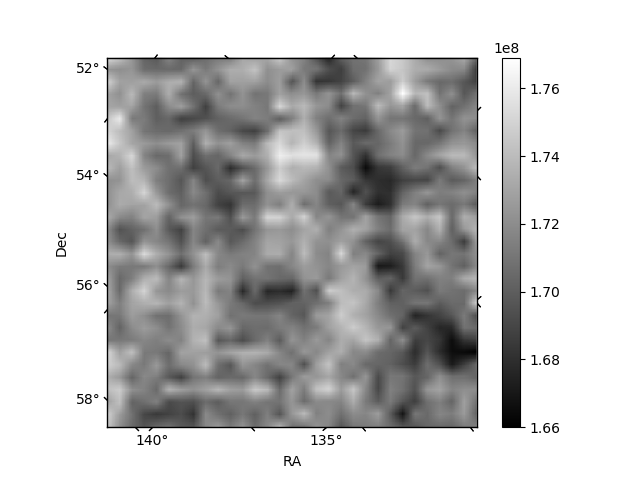
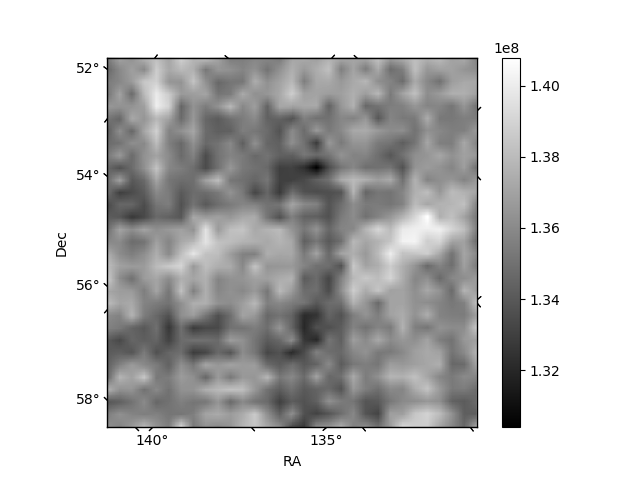
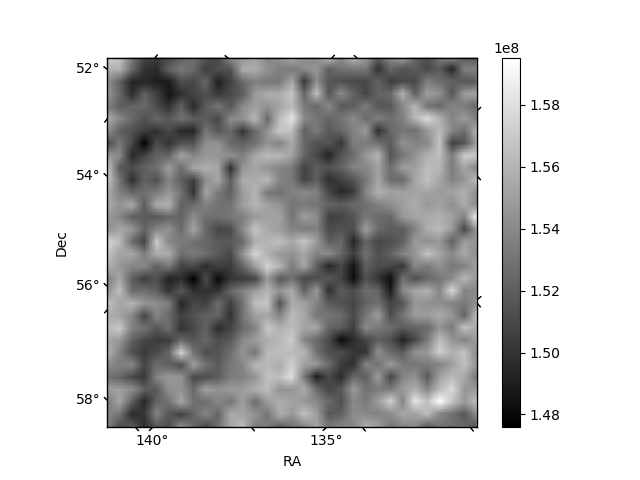
Histogram calculated using DETX and DETY for each event in the final _common_clean file
| Quadrant A | 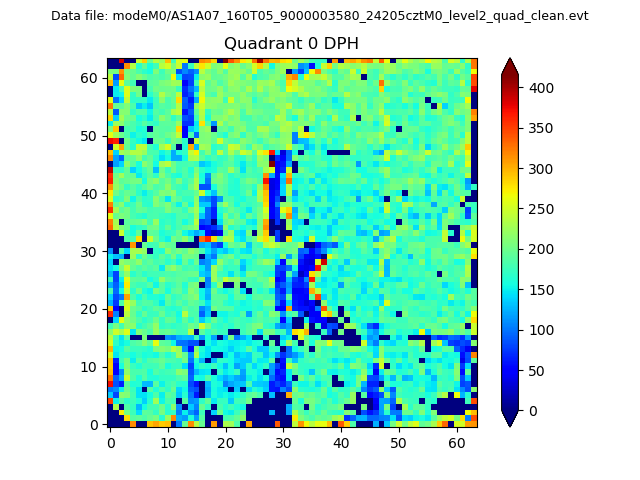 |
 |
Quadrant B |
|---|---|---|---|
| Quadrant D | 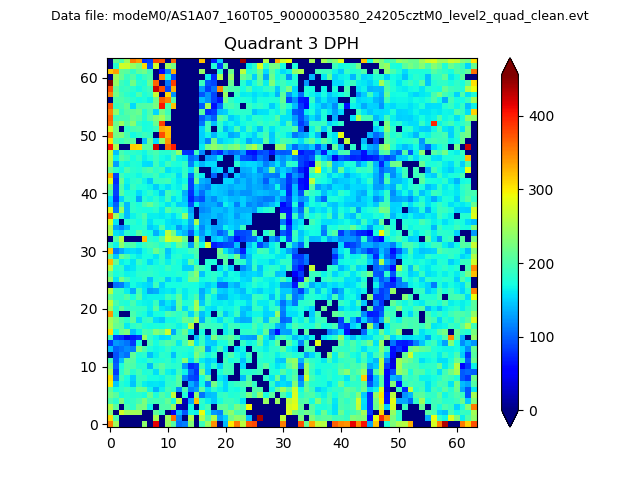 |
 |
Quadrant C |
| Plot type | Count rate plots | Images |
|---|---|---|
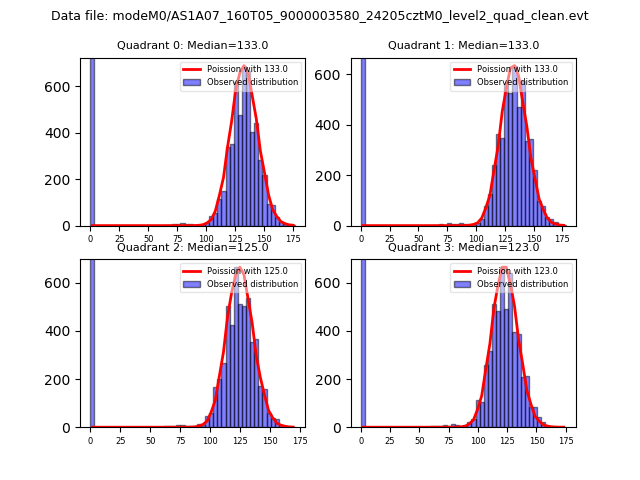
| Comparison with Poisson distribution Blue bars denote a histogram of data divided into 1 sec bins. Red curve is a Poisson curve with rate = median count rate of data. |
 |
 |
| Quadrant-wise count rates Data is divided into 100 sec bins |
 |
|
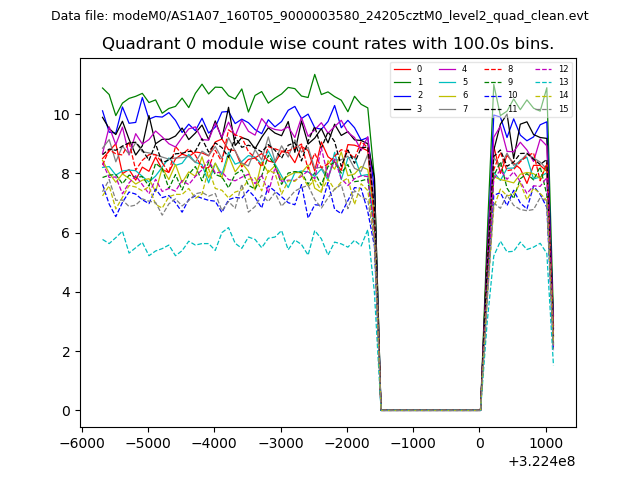
| Module-wise count rates for Quadrant A Data is divided into 100 sec bins |
 |
 |
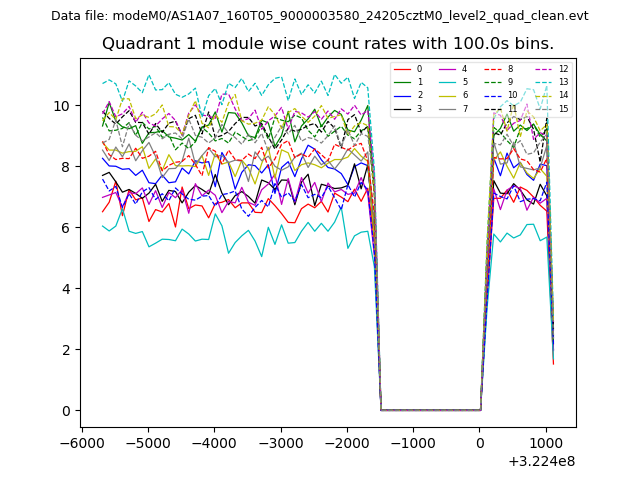
| Module-wise count rates for Quadrant B Data is divided into 100 sec bins |
 |
 |
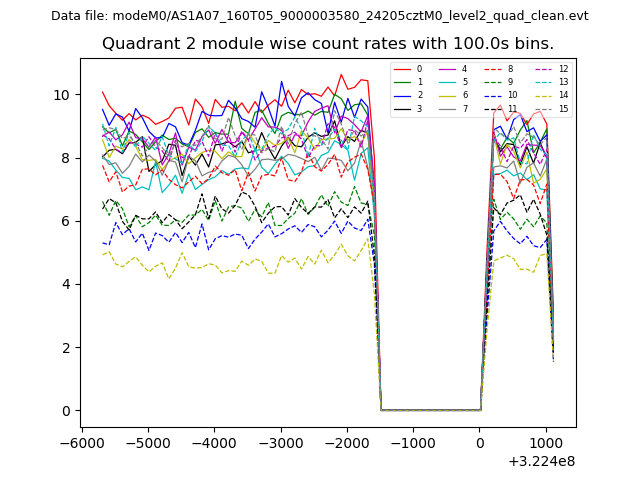
| Module-wise count rates for Quadrant C Data is divided into 100 sec bins |
 |
 |
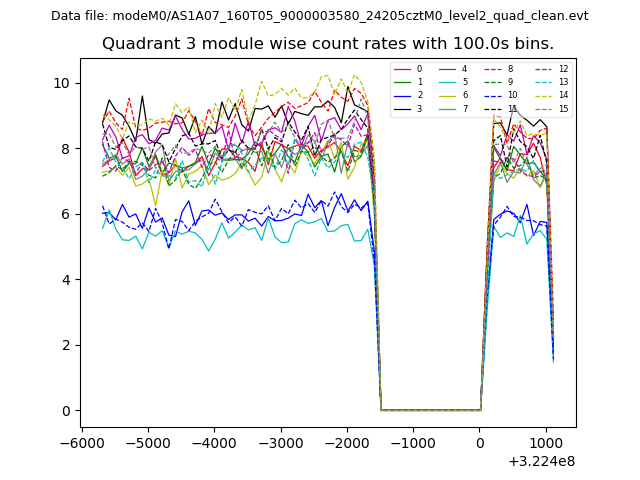
| Module-wise count rates for Quadrant D Data is divided into 100 sec bins |
 |
 |
| Parameter | Plot |
|---|---|
| CZT HV Monitor | 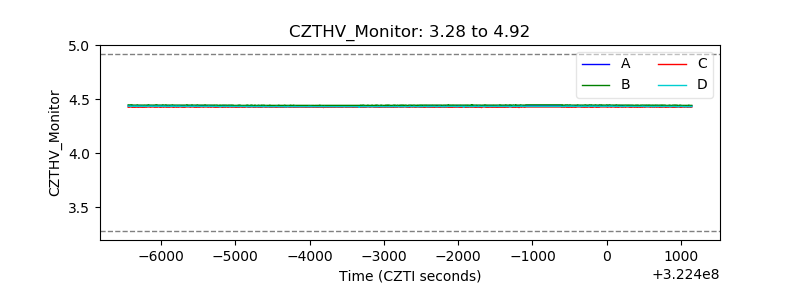 |
| D_VDD | 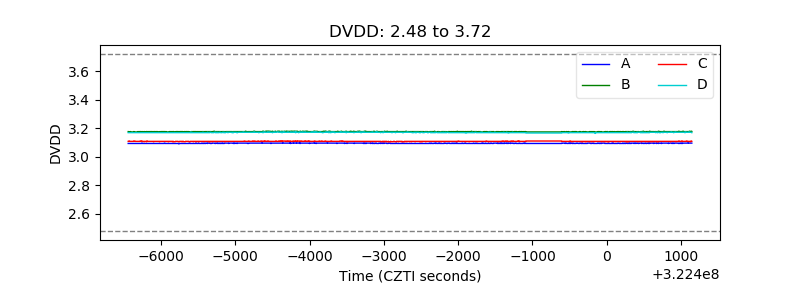 |
| Temperature 1 | 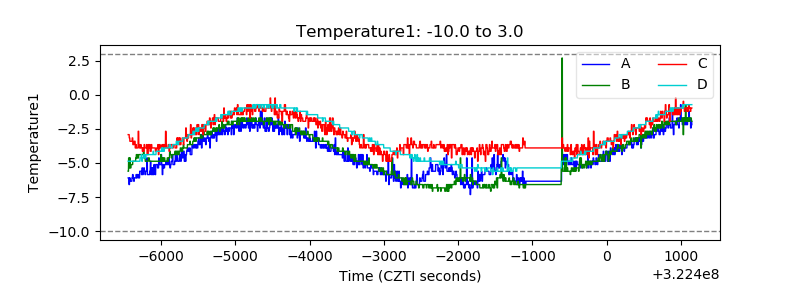 |
| Veto HV Monitor | 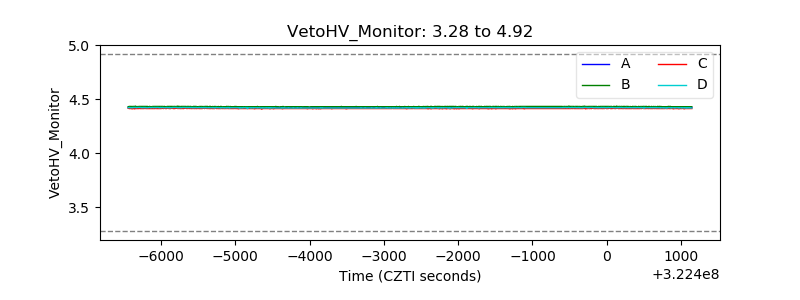 |
| Veto LLD | 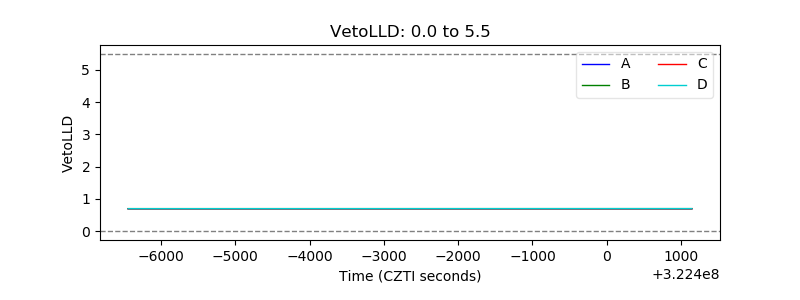 |
| Alpha Counter | 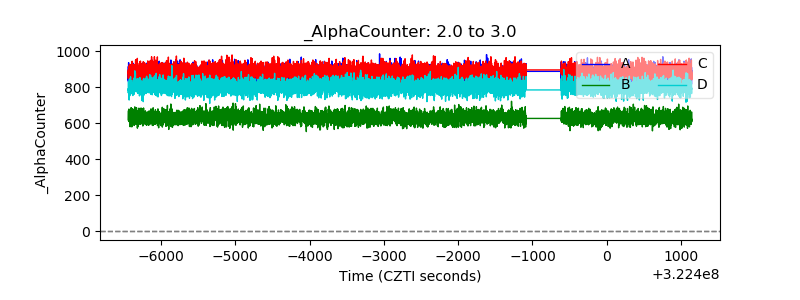 |
| _CPM_Rate | 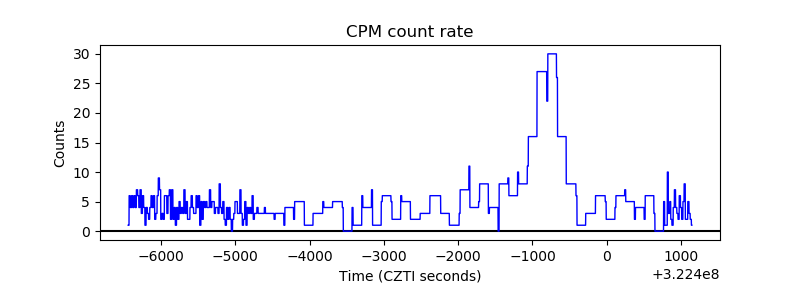 |
| CZT Counter |  |
| +2.5 Volts monitor |  |
| +5 Volts monitor |  |
| _ROLL_ROT | 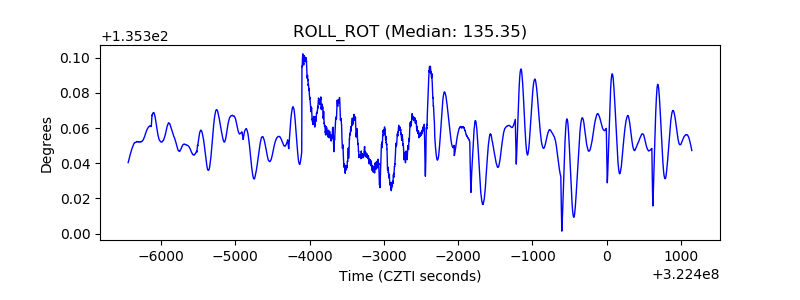 |
| _Roll_DEC | 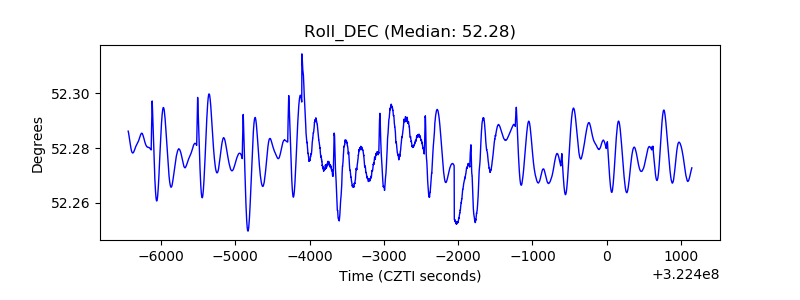 |
| _Roll_RA | 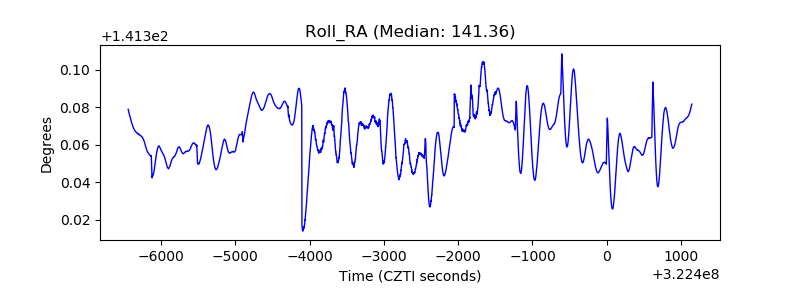 |
| Veto Counter | 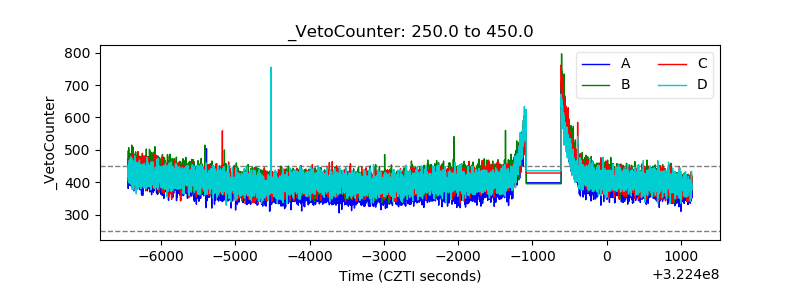 |