| Param | Original file | Final file |
|---|---|---|
| Filename | modeM0/AS1A07_160T05_9000003580_24206cztM0_level2.evt | modeM0/AS1A07_160T05_9000003580_24206cztM0_level2_quad_clean.evt |
| Size (bytes) | 550,321,920 | 108,103,680 |
| Size | 524.8 MB | 103.1 MB |
| Events in quadrant A | 3,532,884 | 718,321 |
| Events in quadrant B | 3,551,985 | 719,033 |
| Events in quadrant C | 4,307,166 | 663,466 |
| Events in quadrant D | 4,773,387 | 659,256 |
| Mode SS | |||
|---|---|---|---|
| Quadrant | BADHDUFLAG | Total packets | Discarded packets |
| A | 0 | 148 | 0 |
| B | 0 | 148 | 0 |
| C | 0 | 148 | 0 |
| D | 0 | 148 | 0 |
| Mode M0 | |||
|---|---|---|---|
| Quadrant | BADHDUFLAG | Total packets | Discarded packets |
| A | 0 | 15312 | 0 |
| B | 0 | 15317 | 0 |
| C | 0 | 17205 | 0 |
| D | 0 | 19039 | 0 |
| Quadrant | Total seconds | Saturated seconds | Saturation percentage |
|---|---|---|---|
| A | 7382 | 217 | 2.939583% |
| B | 7382 | 207 | 2.804118% |
| C | 7383 | 444 | 6.013816% |
| D | 7383 | 187 | 2.532846% |
Noise dominated data is calculated using 1-second bins in cleaned event files. If a bin has >2000 counts, and if more than 50% of those come from <1% of pixels, then it is considered to be noise-dominated and hence unusable.
| Quadrant | # 1 sec bins | Bins with >0 counts | Bins with >2000 counts | High rate bins dominated by noise | Noise dominated (total time) | Noise dominated (detector-on time) | Marked lightcurve |
|---|---|---|---|---|---|---|---|
| A | 7382 | 7382 | 0 | 0 | 0.00% | 0.00% | 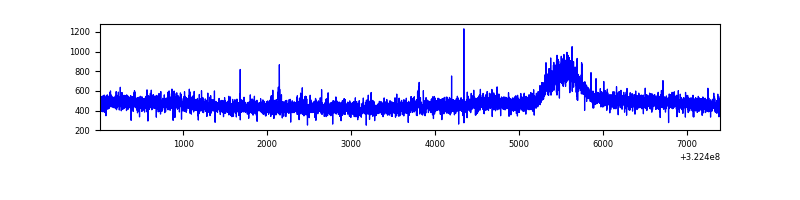 |
| B | 7382 | 7382 | 0 | 0 | 0.00% | 0.00% | 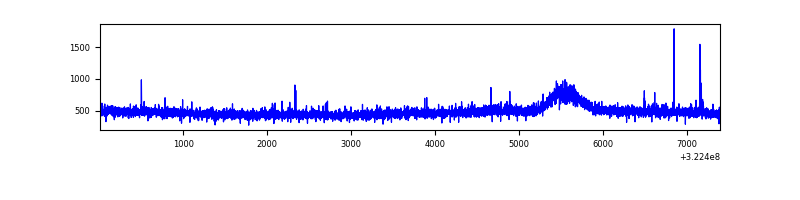 |
| C | 7383 | 7383 | 115 | 115 | 1.56% | 1.56% | 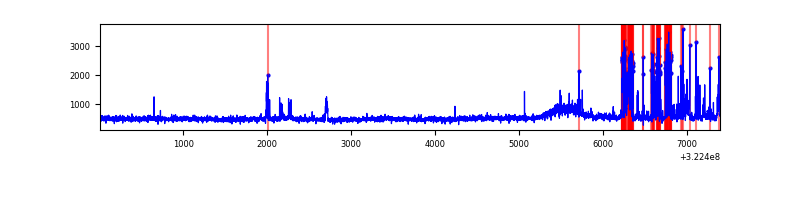 |
| D | 7383 | 7383 | 41 | 41 | 0.56% | 0.56% |  |
Top three noisy pixels from each quadrant. If the there are fewer than three noisy pixels in the level2.evt file, extra rows are filled as -1
| Pixel properties | Quadrant properties | ||||||
|---|---|---|---|---|---|---|---|
| Quadrant | DetID | PixID | Counts | Sigma | Mean | Median | Sigma |
| A | 3 | 1 | 16533 | 84.82 | 912 | 890 | 184.4 |
| A | 13 | 254 | 11978 | 60.12 | 912 | 890 | 184.4 |
| A | 3 | 137 | 8482 | 41.17 | 912 | 890 | 184.4 |
| B | 12 | 111 | 21063 | 117.67 | 900 | 877 | 171.6 |
| B | 11 | 111 | 19213 | 106.88 | 900 | 877 | 171.6 |
| B | 14 | 111 | 16696 | 92.21 | 900 | 877 | 171.6 |
| C | 2 | 16 | 581399 | 2906.27 | 856 | 858 | 199.8 |
| C | 7 | 247 | 246329 | 1228.86 | 856 | 858 | 199.8 |
| C | 14 | 238 | 134865 | 670.86 | 856 | 858 | 199.8 |
| D | 8 | 195 | 995798 | 4658.81 | 881 | 855 | 213.6 |
| D | 7 | 238 | 224735 | 1048.31 | 881 | 855 | 213.6 |
| D | 12 | 218 | 200232 | 933.58 | 881 | 855 | 213.6 |
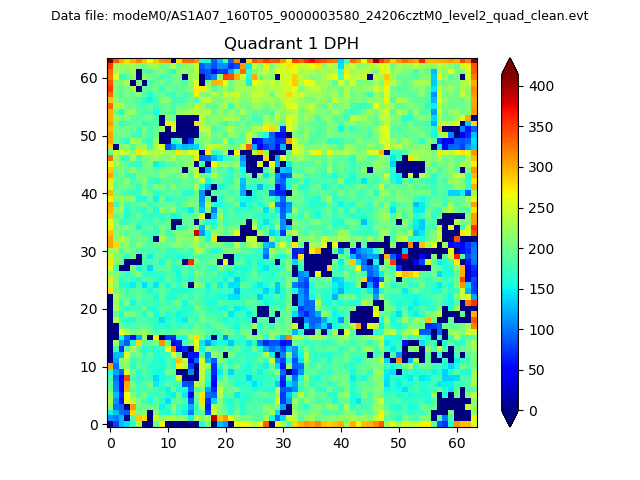
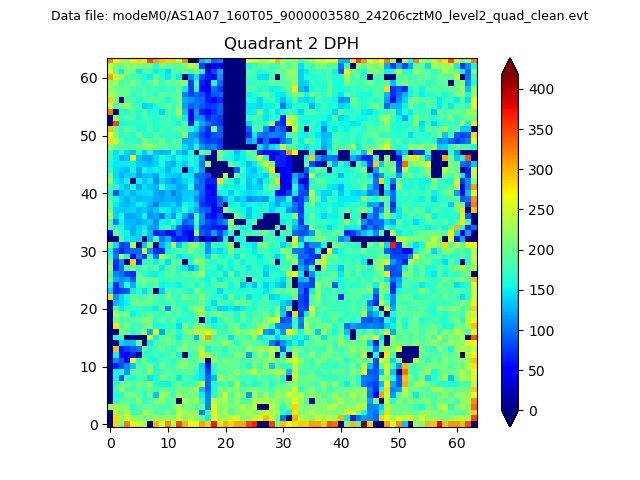
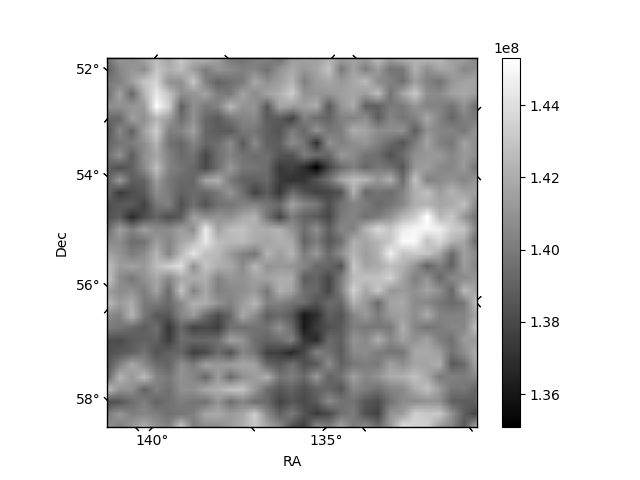
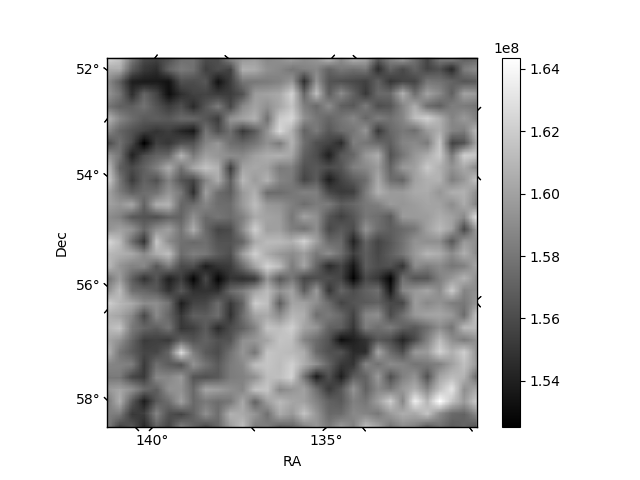
Histogram calculated using DETX and DETY for each event in the final _common_clean file
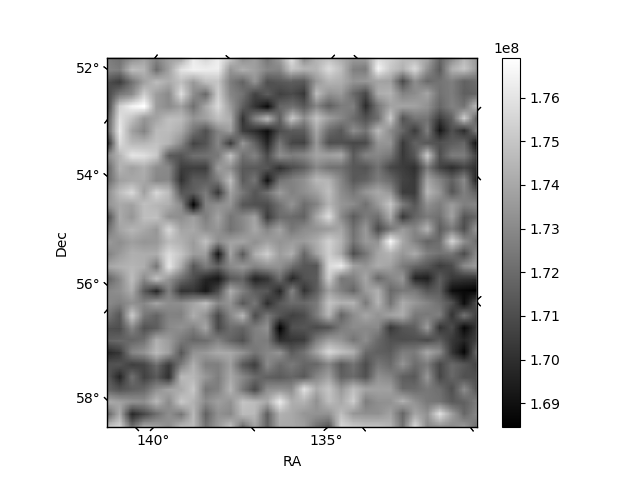
| Quadrant A |  |
 |
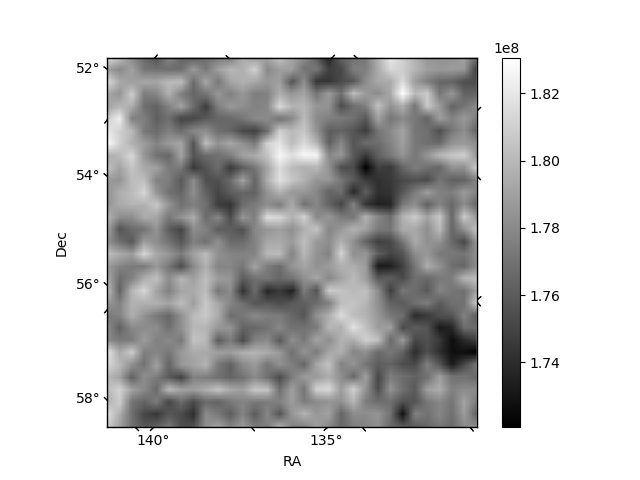
Quadrant B |
|---|---|---|---|
| Quadrant D |  |
 |
Quadrant C |
| Plot type | Count rate plots | Images |
|---|---|---|
| Comparison with Poisson distribution Blue bars denote a histogram of data divided into 1 sec bins. Red curve is a Poisson curve with rate = median count rate of data. |
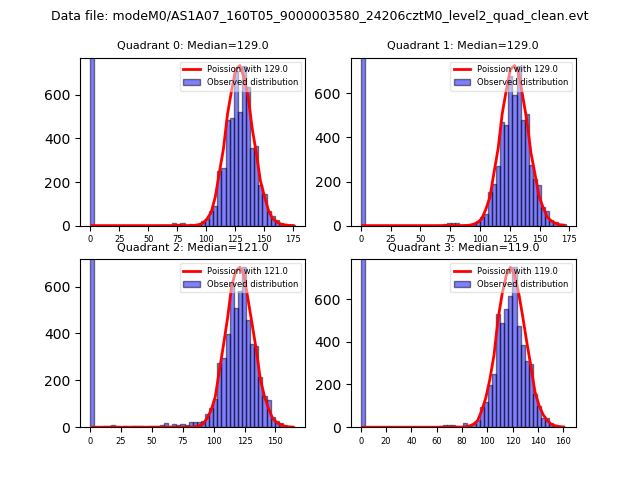 |
 |
| Quadrant-wise count rates Data is divided into 100 sec bins |
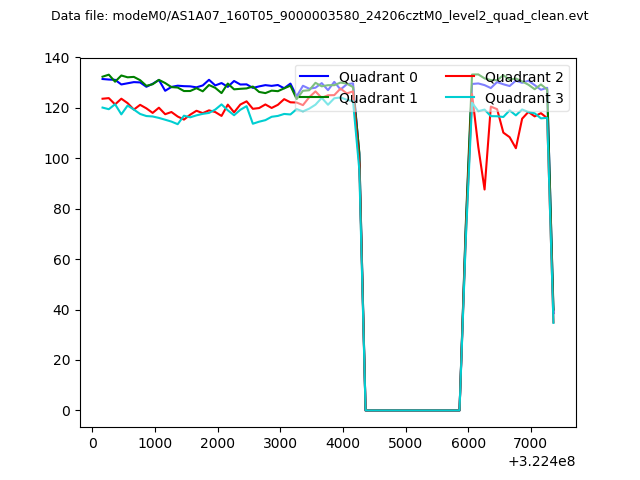 |
|
| Module-wise count rates for Quadrant A Data is divided into 100 sec bins |
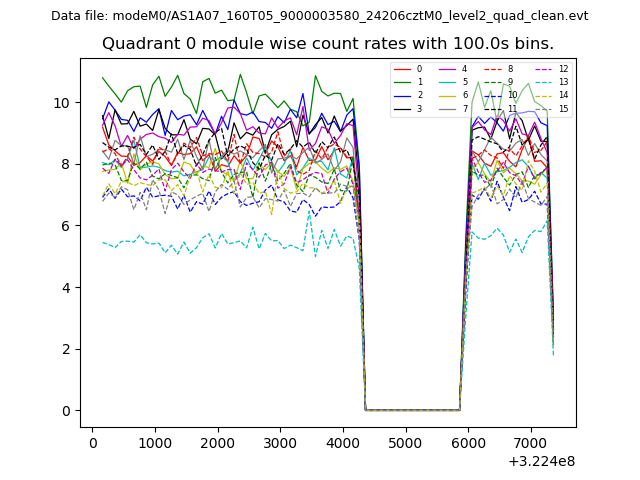 |
 |
| Module-wise count rates for Quadrant B Data is divided into 100 sec bins |
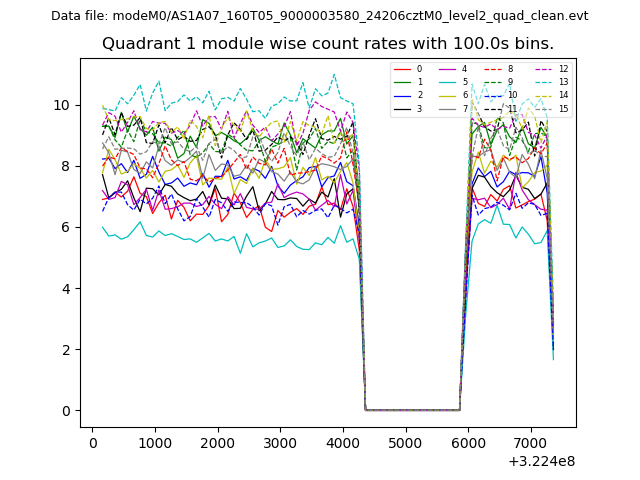 |
 |
| Module-wise count rates for Quadrant C Data is divided into 100 sec bins |
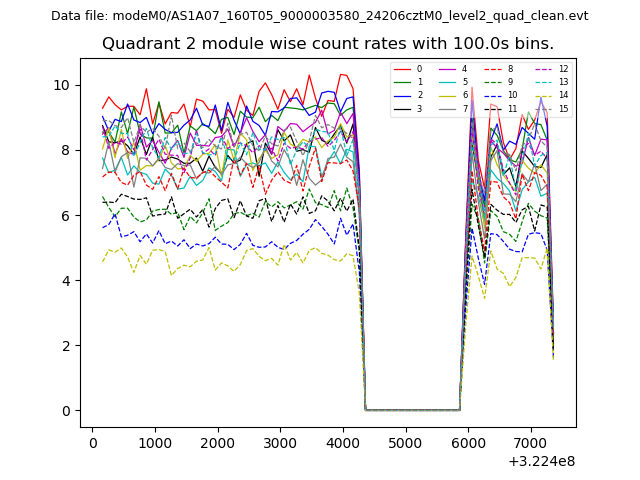 |
 |
| Module-wise count rates for Quadrant D Data is divided into 100 sec bins |
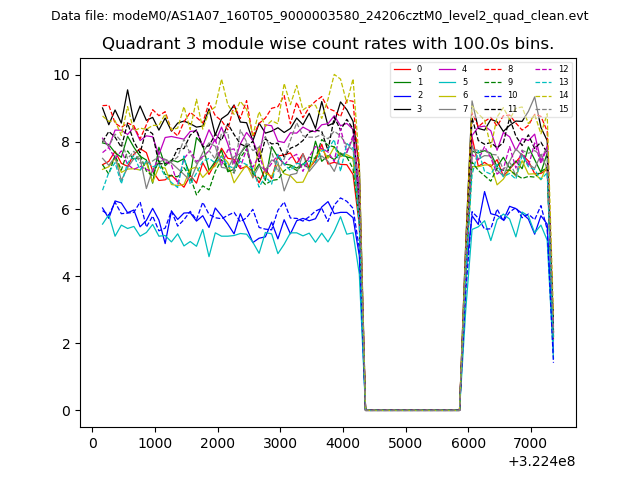 |
 |
| Parameter | Plot |
|---|---|
| CZT HV Monitor | 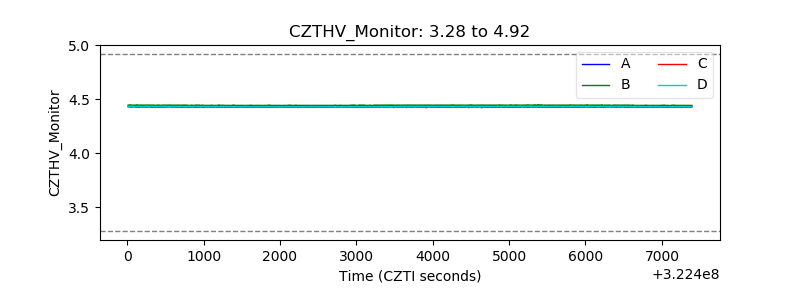 |
| D_VDD |  |
| Temperature 1 | 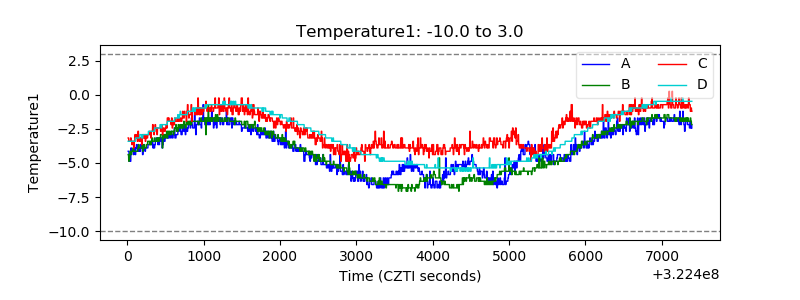 |
| Veto HV Monitor | 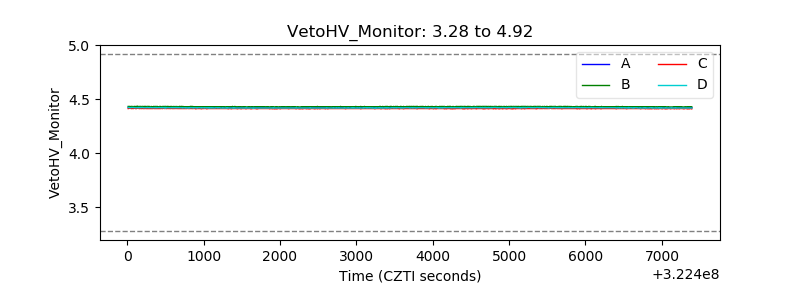 |
| Veto LLD | 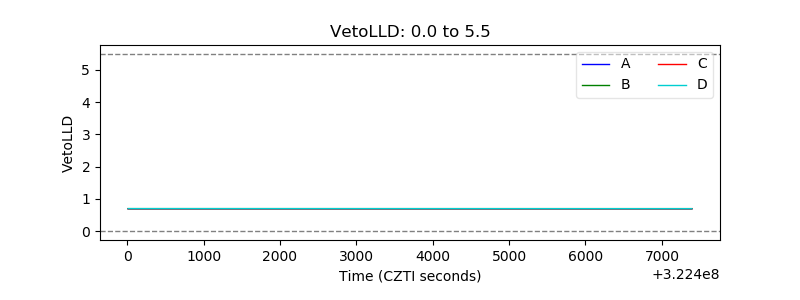 |
| Alpha Counter | 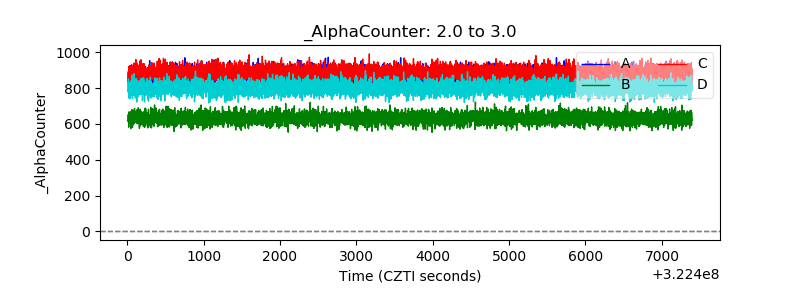 |
| _CPM_Rate | 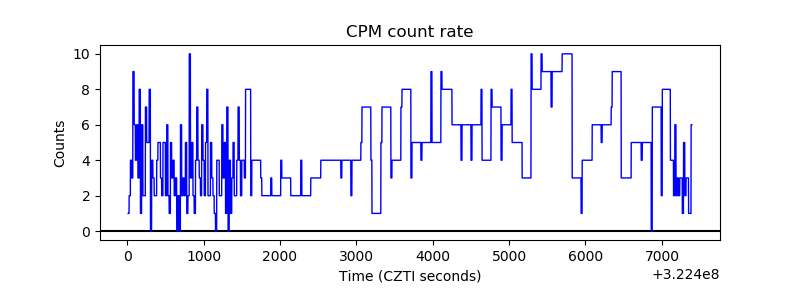 |
| CZT Counter | 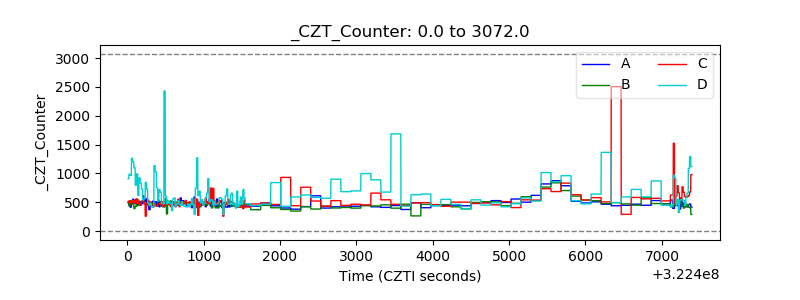 |
| +2.5 Volts monitor |  |
| +5 Volts monitor |  |
| _ROLL_ROT | 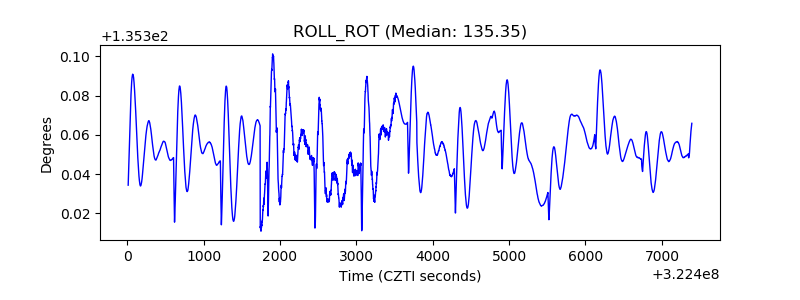 |
| _Roll_DEC | 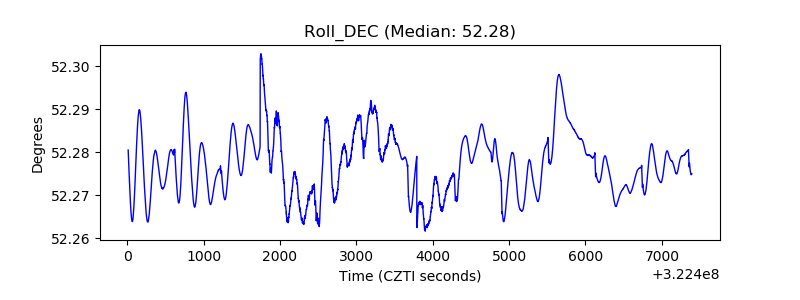 |
| _Roll_RA | 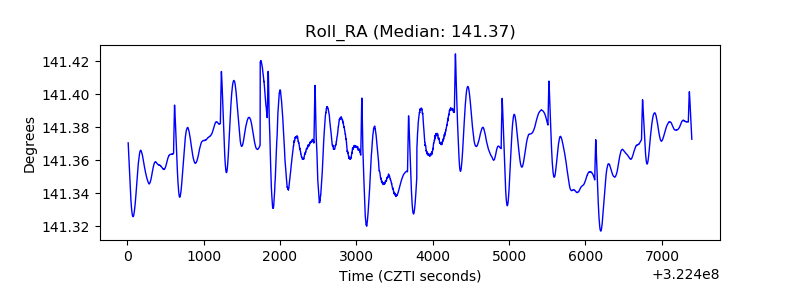 |
| Veto Counter | 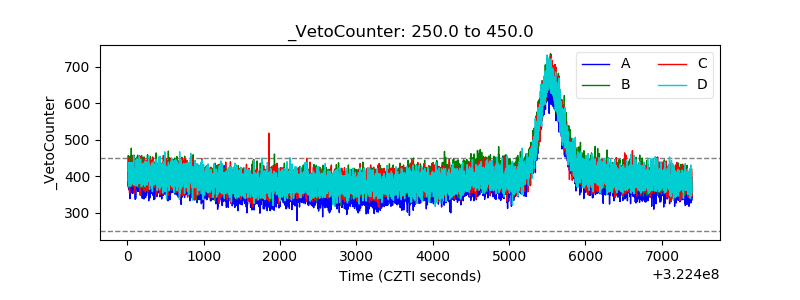 |