| Param | Original file | Final file |
|---|---|---|
| Filename | modeM0/AS1A07_160T05_9000003580_24210cztM0_level2.evt | modeM0/AS1A07_160T05_9000003580_24210cztM0_level2_quad_clean.evt |
| Size (bytes) | 168,603,840 | 36,429,120 |
| Size | 160.8 MB | 34.7 MB |
| Events in quadrant A | 903,597 | 253,520 |
| Events in quadrant B | 891,957 | 252,801 |
| Events in quadrant C | 1,587,958 | 221,828 |
| Events in quadrant D | 1,585,793 | 230,652 |
| Mode SS | |||
|---|---|---|---|
| Quadrant | BADHDUFLAG | Total packets | Discarded packets |
| A | 0 | 38 | 0 |
| B | 0 | 38 | 0 |
| C | 0 | 38 | 0 |
| D | 0 | 38 | 0 |
| Mode M0 | |||
|---|---|---|---|
| Quadrant | BADHDUFLAG | Total packets | Discarded packets |
| A | 0 | 3991 | 0 |
| B | 0 | 3987 | 0 |
| C | 0 | 5900 | 0 |
| D | 0 | 6063 | 0 |
| Quadrant | Total seconds | Saturated seconds | Saturation percentage |
|---|---|---|---|
| A | 1984 | 2 | 0.100806% |
| B | 1985 | 0 | 0.000000% |
| C | 1985 | 223 | 11.234257% |
| D | 1985 | 67 | 3.375315% |
Noise dominated data is calculated using 1-second bins in cleaned event files. If a bin has >2000 counts, and if more than 50% of those come from <1% of pixels, then it is considered to be noise-dominated and hence unusable.
| Quadrant | # 1 sec bins | Bins with >0 counts | Bins with >2000 counts | High rate bins dominated by noise | Noise dominated (total time) | Noise dominated (detector-on time) | Marked lightcurve |
|---|---|---|---|---|---|---|---|
| A | 1984 | 1984 | 0 | 0 | 0.00% | 0.00% | 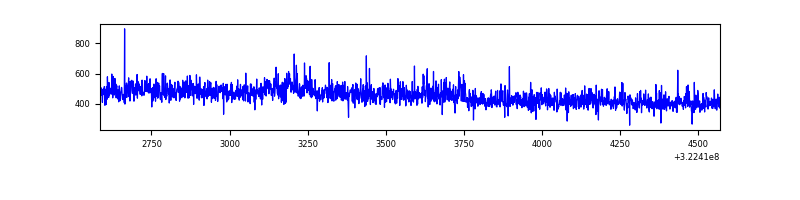 |
| B | 1985 | 1985 | 0 | 0 | 0.00% | 0.00% | 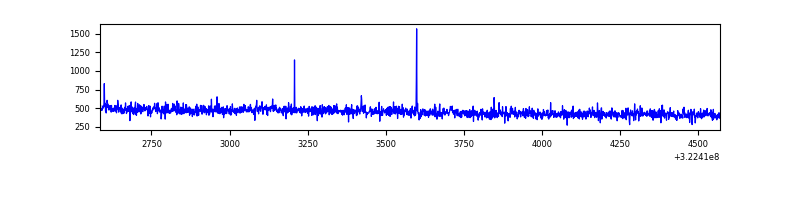 |
| C | 1985 | 1985 | 177 | 177 | 8.92% | 8.92% | 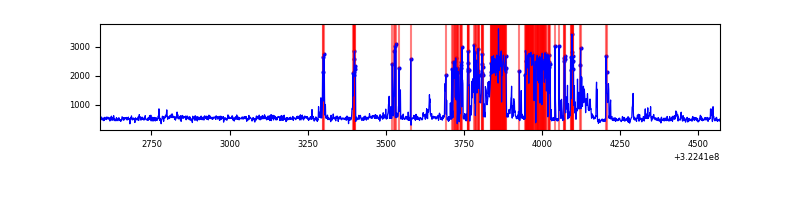 |
| D | 1985 | 1985 | 52 | 52 | 2.62% | 2.62% | 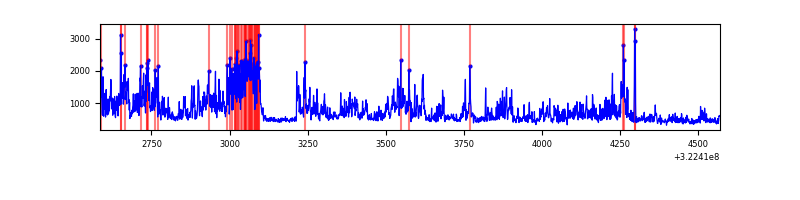 |
Top three noisy pixels from each quadrant. If the there are fewer than three noisy pixels in the level2.evt file, extra rows are filled as -1
| Pixel properties | Quadrant properties | ||||||
|---|---|---|---|---|---|---|---|
| Quadrant | DetID | PixID | Counts | Sigma | Mean | Median | Sigma |
| A | 3 | 1 | 13542 | 276.28 | 230 | 225 | 48.2 |
| A | 13 | 254 | 3106 | 59.77 | 230 | 225 | 48.2 |
| A | 3 | 137 | 1937 | 35.52 | 230 | 225 | 48.2 |
| B | 12 | 111 | 5021 | 107.09 | 225 | 220 | 44.8 |
| B | 11 | 111 | 4314 | 91.32 | 225 | 220 | 44.8 |
| B | 0 | 245 | 3844 | 80.83 | 225 | 220 | 44.8 |
| C | 2 | 16 | 607642 | 11891.85 | 210 | 212 | 51.1 |
| C | 7 | 247 | 126821 | 2478.66 | 210 | 212 | 51.1 |
| C | 14 | 238 | 33003 | 641.96 | 210 | 212 | 51.1 |
| D | 8 | 195 | 662561 | 11921.57 | 223 | 217 | 55.6 |
| D | 7 | 238 | 48573 | 870.36 | 223 | 217 | 55.6 |
| D | 12 | 233 | 12550 | 221.98 | 223 | 217 | 55.6 |
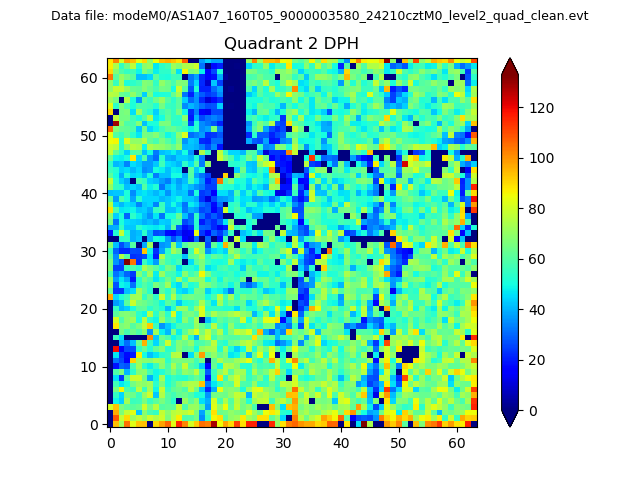
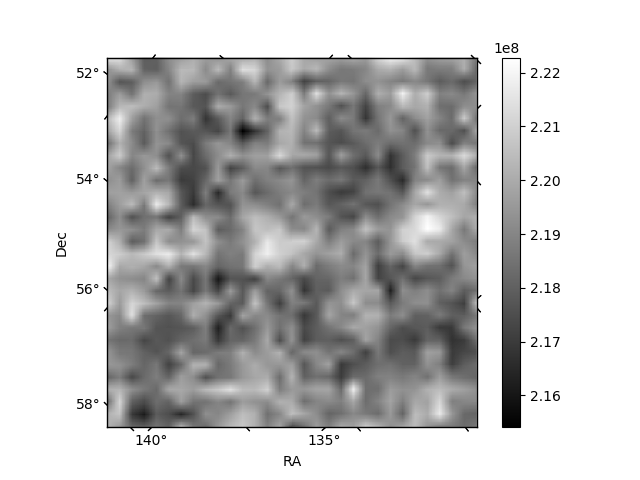
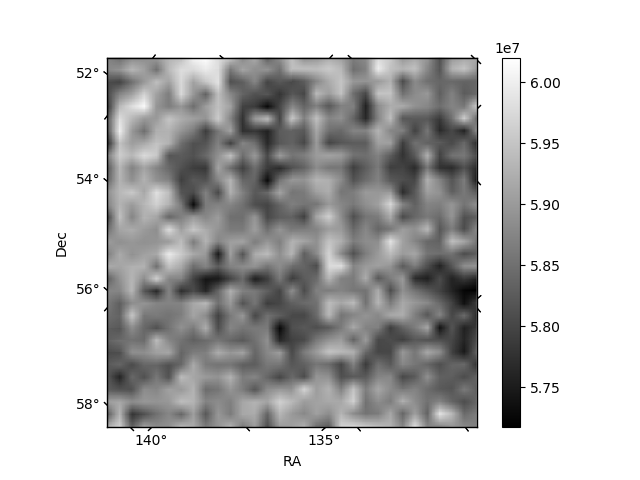
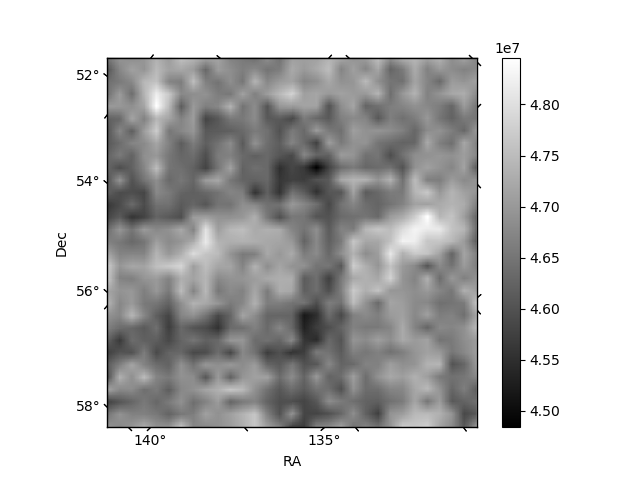
Histogram calculated using DETX and DETY for each event in the final _common_clean file
| Quadrant A | 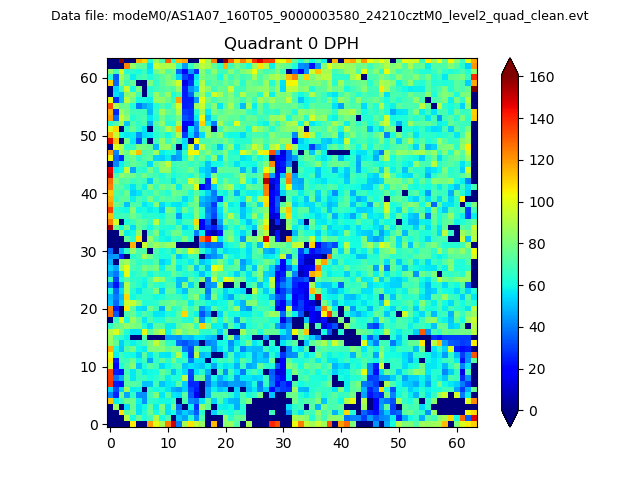 |
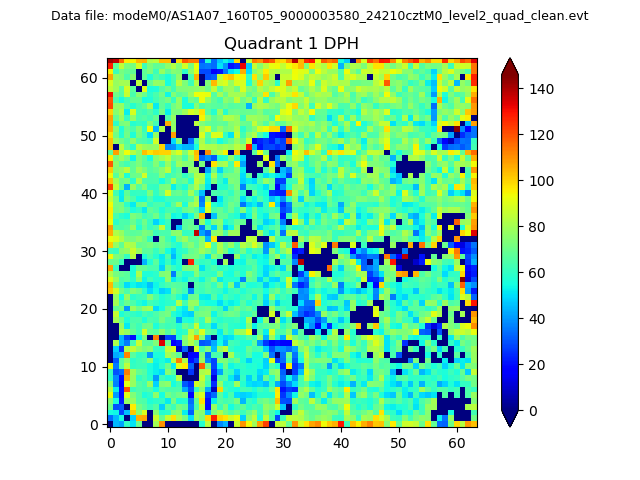 |
Quadrant B |
|---|---|---|---|
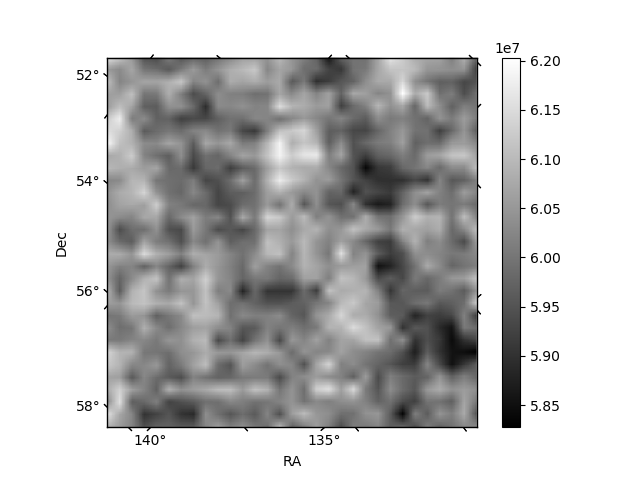
| Quadrant D | 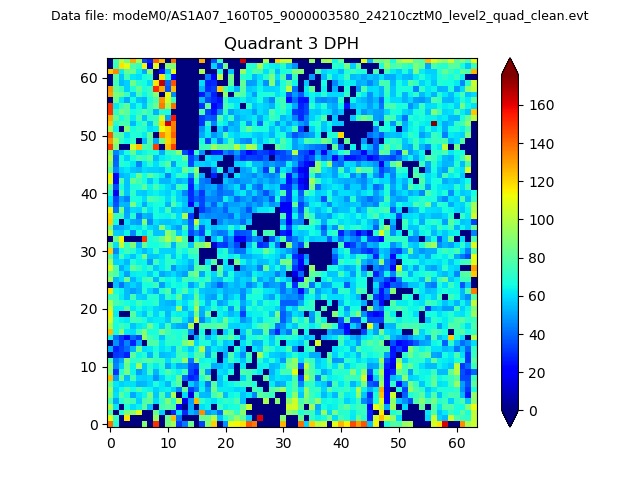 |
 |
Quadrant C |
| Plot type | Count rate plots | Images |
|---|---|---|
| Comparison with Poisson distribution Blue bars denote a histogram of data divided into 1 sec bins. Red curve is a Poisson curve with rate = median count rate of data. |
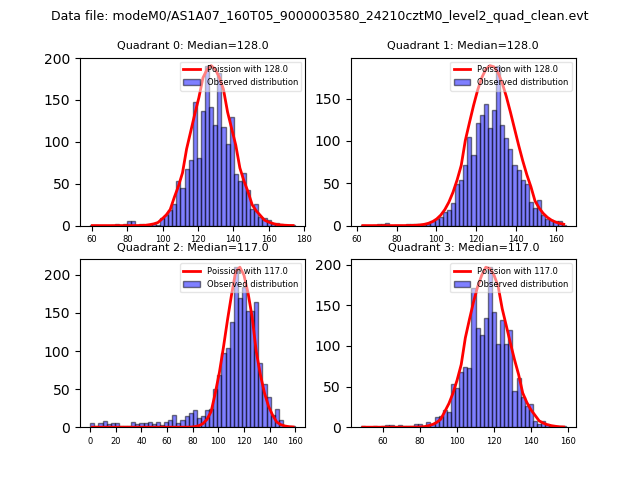 |
 |
| Quadrant-wise count rates Data is divided into 100 sec bins |
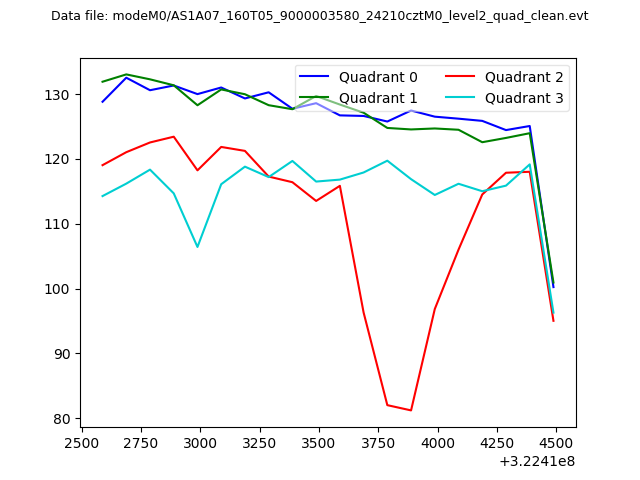 |
|
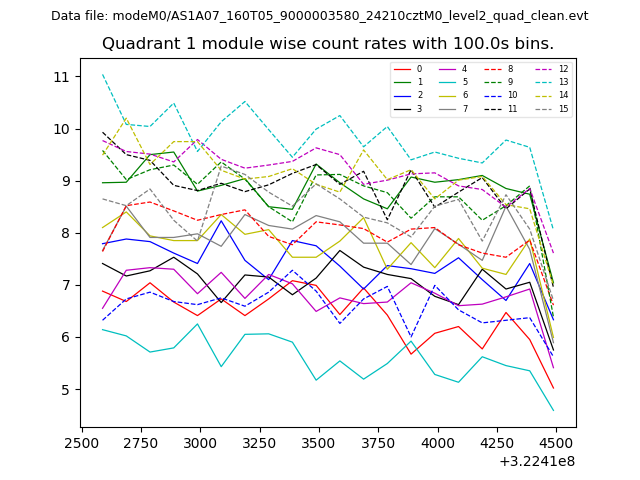
| Module-wise count rates for Quadrant A Data is divided into 100 sec bins |
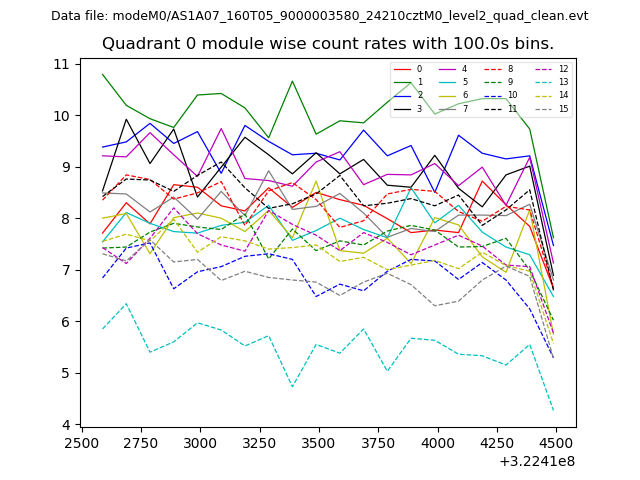 |
 |
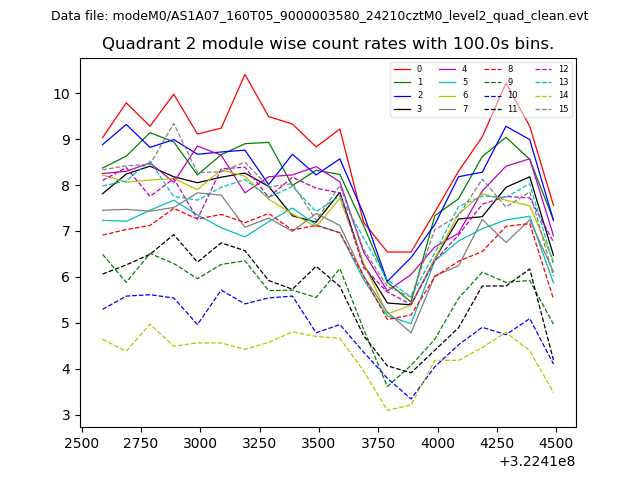
| Module-wise count rates for Quadrant B Data is divided into 100 sec bins |
 |
 |
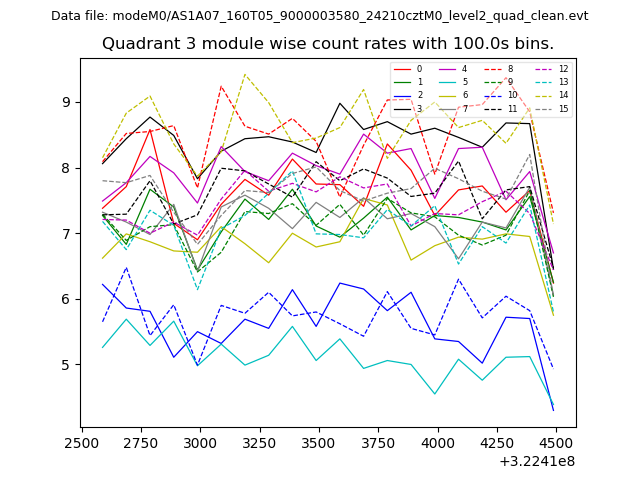
| Module-wise count rates for Quadrant C Data is divided into 100 sec bins |
 |
 |
| Module-wise count rates for Quadrant D Data is divided into 100 sec bins |
 |
 |
| Parameter | Plot |
|---|---|
| CZT HV Monitor | 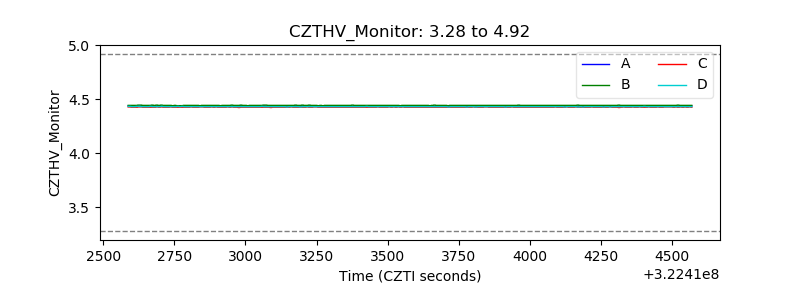 |
| D_VDD | 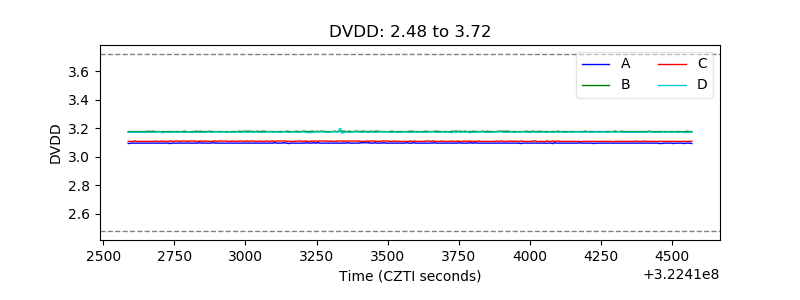 |
| Temperature 1 |  |
| Veto HV Monitor | 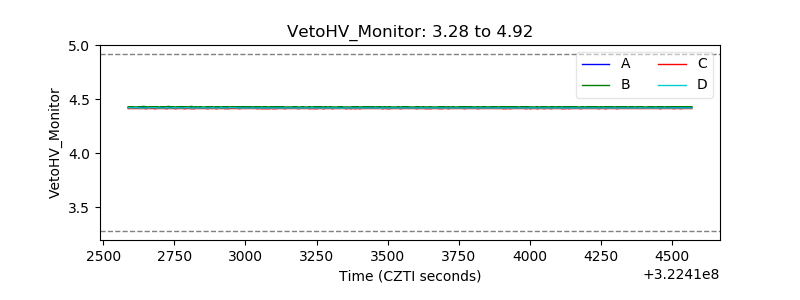 |
| Veto LLD | 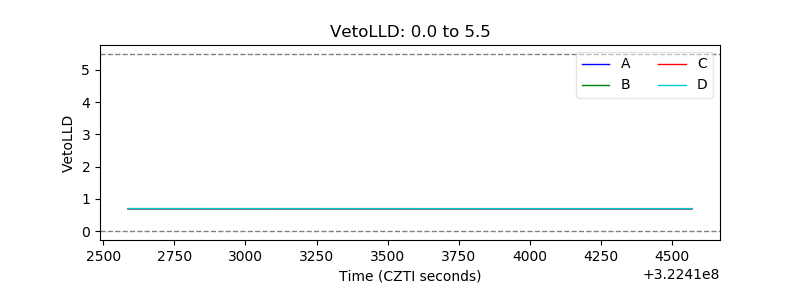 |
| Alpha Counter | 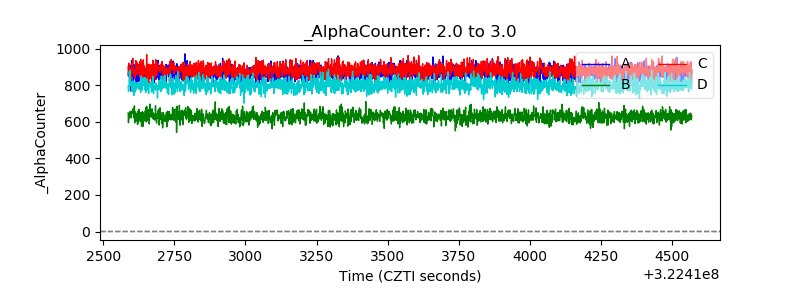 |
| _CPM_Rate | 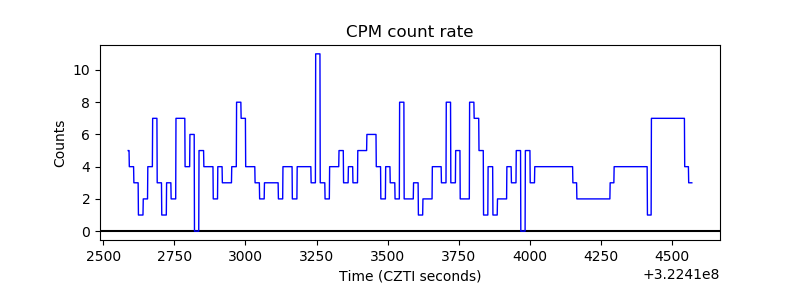 |
| CZT Counter | 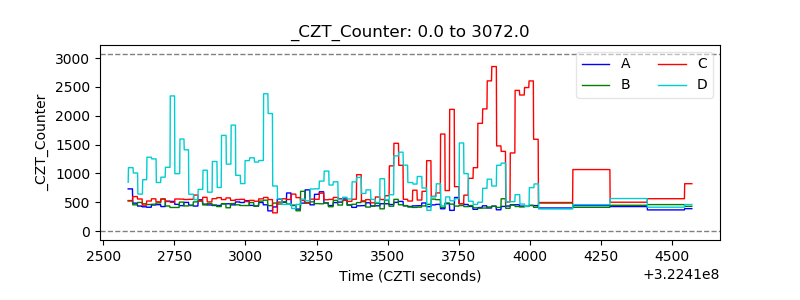 |
| +2.5 Volts monitor |  |
| +5 Volts monitor | 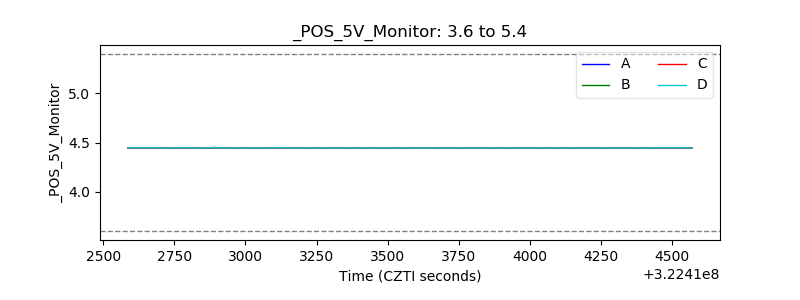 |
| _ROLL_ROT | 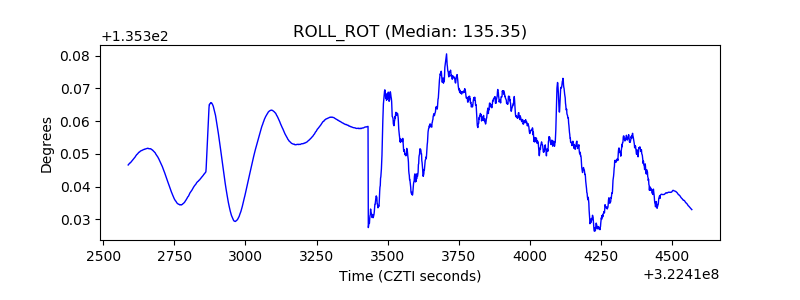 |
| _Roll_DEC | 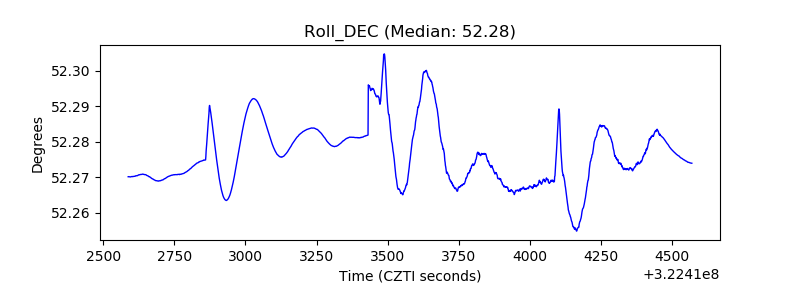 |
| _Roll_RA | 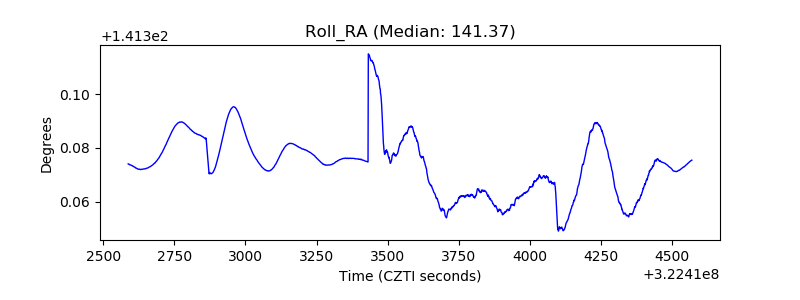 |
| Veto Counter | 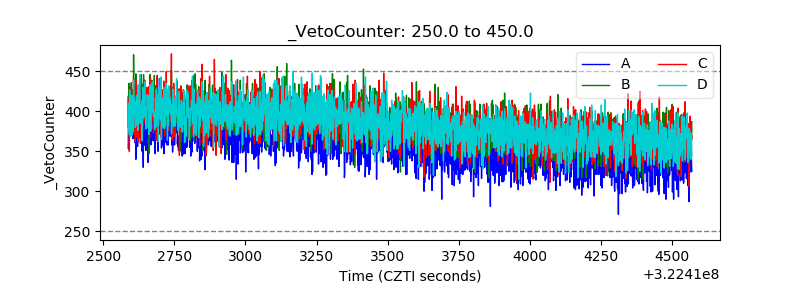 |